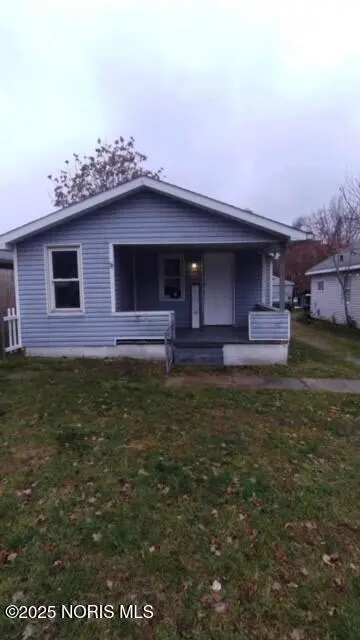
2433 Paradise Ave · Toledo, OH
Flood risk 1/10 · Minimal
- FEMA flood zone
- X (unshaded)
- Chance of flooding over 30 yrs
- 0.0%
- Est. flood insurance / yr
- $507 – $1,088
Fire risk 1/10 · Minimal
- Est. fire insurance / yr
- $713 – $1,323
Heat risk 3/10 · Minor
- Hot days now (above 101°F)
- 7 days/yr
- Hot days in 30 yrs
- 16 days/yr
Wind risk 2/10 · Minimal
- Chance of severe wind over 30 yrs
- —
Air-quality risk 2/10 · Minimal
- Unhealthy air days now
- 1 days/yr
- Unhealthy air days in 30 yrs
- 3 days/yr
Risk factors via First Street. Map © Google.
Why this score? — see what drove the C- grade
The composite is a weighted blend of 9 inputs, each scored 0–100. Each bar is that input's sub-score; the figure is the points it added to the 100-point composite (weight × sub-score).
- Cash flow +19.7/30.0
- ARV discount +7.5/15.0
- 1% rule +6.7/10.0
- DSCR +6.2/10.0
- Schools +3.5/10.0
- Rent growth +3.3/5.0
- Livability +3.3/5.0
- Condition / age +2.5/5.0
- Appreciation +0.0/10.0
$70,000
🖨 Deal sheet (PDF) 📄 Offer letter ✓ Due diligence
Listing remarks
Cute 2 bed 1 bath Washington Local bungalow. Home offers 2 beds, 1 bath, large kitchen and 1st floor laundry. Home needs cosmetic updates to make it yours! Nice backyard, bsmt has exterior entrance and is just for furnace and HWT.
Key facts
- Backyard
- Large kitchen
- 1st floor laundry
Tags
Property features AI
Exterior
- Parking: 2 parking spaces; Driveway; Off-street parking; Unpaved parking
- Utilities: Electricity connected (100 Amp service); Natural gas connected; Public water; Public sewer
- Home design: Single-family residence; One story; No common walls; Exterior entry basement
- Construction: Aluminum siding; Vinyl siding; Block foundation
- Exterior features: Deck; Shingle roof
Interior
- Kitchen: Kitchen (Main)
- Bedrooms: Bedroom (Main); Bedroom 2 (Main)
- Flooring: Carpet; Laminate
- Bathrooms: 1 full bathroom
- Heating & cooling: Forced air heating; Natural gas heating
- Interior features: 5 total rooms; Other interior features
- Laundry & utility: Laundry on the main level
Neighborhood map
What this means for you Summary
Snapshot
- This is a 2-bed/1.0-bath single-family listed at $70k.
Deal economics
- At list price, monthly cash flow is $82 ($983/yr) — positive.
- The deal already cash-flows at list — no discount required.
- Meets the 1% rule at list price ($817 rent vs $70k).
- Recommended offer: $69k (1.5% below list) — sets the bar for market timing.
Location & tenants
- Location reads 66/100 on livability (#645 in OH) — a middle-class / working-renter tenant base. Strengths: cost of living A+, housing A+, health & safety A+; Watch: amenities C-, crime F, commute F.
- Washington Local (urban): math 37% / reading 47% proficiency, ranked #528 of 656 in OH (top 80%) — families likely to look elsewhere, expect single-tenant / working-renter base with shorter leases.
- Zoned schools: Silver Creek Elementary School (math 32% / reading 42%, grade F, #1,087 of 1,584 statewide, top 70%, 653 students, 0% FRL); Whitmer High School (math 38% / reading 48%, grade F, #494 of 781 statewide, top 63%, 2,247 students, 42% FRL) — zoned schools average 21% FRL vs 48% district-wide (28 pts lower); this property's tenant base skews higher-income than the district average.
- Market conditions: Rents rising (+3.3%/yr); 118 active listings in the ZIP; 23 comparable units currently listed for rent nearby; rentals at typical pace (median 23d on market — plan ~3-4 weeks tenant-placement turnaround); 415 units permitted in Lucas County in 2024 (122 in 5+ unit buildings).
- This rent is only 15% of the median local income ($64k/yr) — well below the 30% rent-burden line; pricing power to push rent on renewal without tenant pushback.
Forward outlook
- Local home prices are declining (-3.0%/yr); year-one equity from $484 of loan paydown is wiped out by about $2k of value loss. Plan a longer hold.
- Lucas County population projected at -16% by 2050 — secular population decline; favor cash flow + early exit over multi-decade hold.
Negotiation context
- It's been on market 23 days — a 2% lower offer ($69k) is reasonable based on typical stale-listing flexibility.
- 7 sale attempts since 13y ago with the ask held roughly flat each time — persistent listings suggest the price (not the market) is what's stuck; bring a comps-based counter.
- Current owner paid $49k; 43% above their basis — modest negotiation headroom, anchor on the comps not their cost.
Risks & watch-outs
- Watch-outs: property tax is 2.9% of price; built in 1921 — expect roof / HVAC / electrical / plumbing capex.
Questions for the listing agent
- Built in 1921 — when were the roof, HVAC, electrical panel, plumbing, and water heater last replaced?
- Property tax is high relative to price — has the assessment been appealed recently, and will the sale trigger a re-assessment?
- Is there a deadline driving the sale (1031 exchange, divorce, estate, relocation)? That informs how much negotiation room exists.
- Schools are D-rated, which usually means shorter tenancies and higher turnover. Who's the typical renter profile here, and what's been the actual vacancy rate?
- Crime grade is F in this area — have there been break-ins, vandalism, or insurance claims at this property in the last 3 years? What carrier currently insures it and at what premium?
- What's the average days-on-market for RENTAL listings here right now (not sales)? A rising rental-DOM trend means longer vacancies and softer asking-rent achievability than the comps imply.
- What's the recent tenant-quality profile in this submarket — average credit score on applications, eviction rate, late-payment / NSF rate, and stable-employment percentage? A property-management company in the area should have these aggregated.
- How much new for-sale + rental construction is in the pipeline within 1–3 miles? Heavy new supply typically softens prices + rents 12–24 months out; constrained supply supports both.
Investment metrics
- 1% rule
- 1.17% ✓
- Cap rate
- 7.70%
- Cash-on-cash
- 5.02%
- DSCR
- 1.22
- GRM
- 7.1
CMA / ARV
- ARV (median comp)
- $166,742
- List price
- $70,000
- Delta
- -58.38%
- Verdict
- UNDERPRICED
- Comps
- 2 within 2.0 mi
Show comp detail 12 sales within ~0.75 mi
| Address | Dist | Beds/Ba | Sqft | Sold | Price | $/sf | Match |
|---|---|---|---|---|---|---|---|
| — | 0.21mi | 2/1.0 | 736 (-2%) | 10mo | $115,000 | $156 | 79 |
| 2551 Elsie Ave | 0.54mi | 2/1.0 | 744 (-0%) | 2mo | $134,500 | $181 | 73 |
| 5239 Rowland Rd | 0.37mi | 2/1.0 | 746 (-0%) | 14mo | $110,000 | $147 | 71 |
| 2344 Mellwood Ave | 0.40mi | 2/1.0 | 790 (+6%) | 6mo | $99,000 | $125 | 66 |
| 5303 Winona Rd | 0.27mi | 2/1.0 | 850 (+14%) | 1mo | $130,000 | $153 | 64 |
| 2824 Nash Rd | 0.47mi | 2/1.0 | 720 (-4%) | 13mo | $152,900 | $212 | 62 |
| 2605 Wyndale Rd | 0.45mi | 2/1.0 | 816 (+9%) | 6mo | $169,000 | $207 | 59 |
| 2437 Murray Dr | 0.42mi | 2/1.0 | 680 (-9%) | 8mo | $115,000 | $169 | 59 |
| 5241 Rowland Rd | 0.37mi | 2/1.0 | 680 (-9%) | 14mo | $98,000 | $144 | 56 |
| 2831 Elsie Ave | 0.70mi | 2/1.0 | 740 (-1%) | 14mo | $123,700 | $167 | 54 |
| 2345 Murray Dr | 0.43mi | 1/1.0 (-1) | 792 (+6%) | 21mo | $75,000 | $95 | 48 |
| 2449 Lambert Dr | 0.70mi | 2/1.0 | 840 (+12%) | 14mo | $99,000 | $118 | 36 |
Match score weights: distance 35% · size 25% · config 20% · recency 20%. Top-matched comps best support the ARV.
Projected returns pro-forma
-3.0% appreciation · 3.3% rent growth · sell at horizon
- IRR
- -8.0%
- Equity multiple
- 0.70×
- Total profit
- $-5,815
- Equity at exit
- $10,437
- IRR
- 2.1%
- Equity multiple
- 1.15×
- Total profit
- $2,928
- Equity at exit
- $6,052
Cash invested: $19,600 (down + closing). Projections, not guarantees.
Landlord ↔ Tenant lean methodology
- Overall (STATE)
- 73 Landlord-Friendly
- State Ohio
- 73 Landlord-Friendly · R+6
- County
- — inherits STATE
- City
- — inherits STATE
ZIP-level market 43613
- Home prices YoY
- -20.7%
- Rents YoY
- 3.3%
- Active inventory
- 118
- Price-to-rent
- 7.1×
Monthly cashflow live
- Estimated rent
- $817 high interval (Pro) →
- Mortgage (P&I)
- −$367
- Tax from tax record
- −$167 /mo · $2,005/yr
- Insurance
- −$29
- HOA
- −$0
- Vacancy / Maint / Mgmt
- −$172
- Net cashflow
- $82
Break-even live
Sensitivity live
| Price | -10% $122 | -5% $102 | +0% $82 | +5% $62 | +10% $42 |
|---|---|---|---|---|---|
| Rent | -10% $17 | -5% $50 | +0% $82 | +5% $114 | +10% $146 |
| Rate | -1.0pp $117 | -0.5pp $100 | base $82 | +0.5pp $64 | +1.0pp $45 |
UW: 25.0% down · 7.5% · 30yr · 1.5% tax · 5.0% vac · 8.0% maint · 8.0% mgmt
Financing live
Cash to close
- Down payment
- $17,500
- Closing costs
- $2,100
- Reserves months
- —
- Total cash needed
- —
Loan-product check · same deal, 3 products live
Conventional
25% down · 7.5% · 30yr
- Down + closing
- —
- Monthly P&I
- —
- Monthly cashflow
- —
- DSCR
- —
- Eligible?
- —
Personal DTI + credit; lowest rate.
DSCR
20% down · 8.5% · 30yr
- Down + closing
- —
- Monthly P&I
- —
- Monthly cashflow
- —
- DSCR
- —
- Eligible?
- —
No personal income docs; deal must DSCR.
Hard money
10% down · 12.0% · 12mo
- Down + closing
- —
- Monthly P&I
- —
- Monthly cashflow
- —
- DSCR
- —
- Eligible?
- —
Short-term bridge; refi at stabilization.
Rent comps 23 comps
| Address | Beds | Baths | Sqft | Rent | $/sqft | DOM | Units | Dist |
|---|---|---|---|---|---|---|---|---|
| 4912 Douglas Rd Unit 2459-2F Toledo, OH | 1.0 | 1.0 | 495 | $650 | $1.31 | 45d | 1 | 0.23mi |
| 2255 W Laskey Rd Apt 10 Toledo, OH | 2.0 | 1.0 | 650 | $775 | $1.19 | 16d | 1 | 0.27mi |
| 2255 W Laskey Rd Unit 14 Toledo, OH | 2.0 | 1.0 | 650 | $775 | $1.19 | 23d | 1 | 0.27mi |
| 4836 Douglas Rd Unit 6 Toledo, OH | 1.0 | 1.0 | 600 | $695 | $1.16 | 25d | 1 | 0.30mi |
| 2241 W Laskey Rd Toledo, OH | 1.0 | 1.0 | 600 | $695 | $1.16 | 16d | 1 | 0.31mi |
| 5517 Douglas Rd Unit 5 Toledo, OH | 1.0 | 1.0 | 700 | $695 | $0.99 | 45d | 1 | 0.53mi |
| 1801 Christian Ave Toledo, OH | 1.0–2.0 | 1.0 | 750 | $939 | $1.25 | 16d | 1 | 0.75mi |
| 5317 Jackman Rd Unit 4 Toledo, OH | 2.0 | 1.0 | 625 | $655 | $1.05 | 25d | 1 | 0.91mi |
| 1933 W Alexis Rd Toledo, OH | 1.0 | 1.0 | 475 | $660 | $1.39 | 23d | 1 | 0.94mi |
| 5834 Yermo Dr Toledo, OH | 1.0–2.0 | 1.0–2.0 | 870 | $909 | $1.04 | 16d | 12 | 0.98mi |
| 5816 Tetherwood Dr Toledo, OH | 1.0 | 1.0 | 475 | $660 | $1.39 | 45d | 1 | 0.99mi |
| 3065 Tremainsville Rd Toledo, OH | 1.0–2.0 | 1.0 | 800 | $929 | $1.16 | 16d | 1 | 1.01mi |
| 5080 Secor Rd Toledo, OH | 1.0–2.0 | 1.0–1.5 | 699 | $925 | $1.32 | 45d | 1 | 1.04mi |
| 5360 Secor Rd Unit 312 Toledo, OH | 1.0 | 1.0 | 700 | $599 | $0.86 | 25d | 1 | 1.08mi |
| 4435 Jackman Rd Toledo, OH | 1.0–2.0 | 1.0 | 725 | $922 | $1.27 | 16d | 3 | 1.12mi |
| 5339 Secor Rd Unit 5339-205 Toledo, OH | 1.0 | 1.0 | 586 | $690 | $1.18 | 25d | 1 | 1.16mi |
| 3353 W Laskey Rd Unit 2 Toledo, OH | 3.0 | 1.0 | 750 | $850 | $1.13 | 23d | 1 | 1.18mi |
| 3355 W Laskey Rd Apt 24 Toledo, OH | 2.0 | 1.0 | 750 | $850 | $1.13 | 25d | 1 | 1.20mi |
| 3355 W Laskey Rd Toledo, OH | 2.0 | 1.0 | 750 | $850 | $1.13 | 16d | 2 | 1.20mi |
| 5722 Gay St Unit G2 Toledo, OH | 1.0 | 1.0 | 570 | $650 | $1.14 | 25d | 1 | 1.21mi |
| 3355 W Alexis Rd Toledo, OH | 2.0 | 1.0 | 675 | $809 | $1.20 | 16d | 3 | 1.41mi |
| 2027 Berkshire Pl Toledo, OH | 2.0 | 1.0 | 600 | $845 | $1.41 | 25d | 1 | 1.42mi |
| 4137 Secor Rd Toledo, OH | 1.0–2.0 | 1.0 | 750 | $921 | $1.23 | 16d | 7 | 1.49mi |
Listing history 42 events
-
2026-06-21days on market $70,000 Active 23 DOM
-
2026-06-18days on market $70,000 Active 20 DOM
-
2026-06-17days on market $70,000 Active 19 DOM
-
2026-06-16days on market $70,000 Active 18 DOM
-
2026-06-15days on market $70,000 Active 17 DOM
-
2026-06-14days on market $70,000 Active 15 DOM
-
2026-06-13pricedays on market $70,000 Active 14 DOM
-
2026-06-10days on market $72,500 Active 12 DOM
-
2026-06-09days on market $72,500 Active 11 DOM
-
2026-06-08days on market $72,500 Active 10 DOM
-
2026-06-07days on market $72,500 Active 9 DOM
-
2026-06-03days on market $72,500 Active 5 DOM
-
2026-06-02days on market $72,500 Active 4 DOM
-
2026-06-01days on market $72,500 Active 3 DOM
-
2026-05-31days on market $72,500 Active 2 DOM
-
2026-05-30pricestatusdays on market $72,500 Active 1 DOM
-
2026-05-04price $69,400 230-char remark
-
2026-04-17price $69,900 230-char remark
-
2026-03-23price $75,000 230-char remark
-
2026-03-02$80,000 Active 230-char remark
-
2025-12-02historical
-
2025-11-03$85,000 Active
-
2025-10-14price $21,000
-
2025-10-14price $20,500
-
2025-10-13price $12,005
-
2024-03-24historical $800
-
2024-02-29price $800
-
2023-12-29price $900
-
2023-12-01$950
-
2018-05-18soldstatus $48,900
-
2018-05-18soldstatus $52,900
-
2016-12-29soldstatus $48,900
-
2016-11-28soldstatus $21,000
-
2016-10-07$39,000
-
2015-03-13soldstatus $20,500
-
2015-02-23price $24,900
-
2015-01-02$24,900
-
2013-09-13soldstatus $12,005
-
2013-07-05price $14,000
-
2013-02-28$14,000
-
1990-02-28soldstatus $29,000
-
1978-06-07soldstatus $19,500
ⓘ Source: listings_history table (triggers on properties + properties_extension) + one-shot
backfill from property_details.listing_events for pre-trigger history.
Tax reassessment forecast OH · Partial reset (capped growth)
- Current annual tax
- $2,005 · $167/mo
- Projected year-2 tax
- $2,005 · $167/mo
- Expected delta
- $0/yr ($0/mo · 0.0%)
ⓘ Screening estimate from a state-policy table — verify with the county assessor before closing.
Climate risk First Street
- Flood 1/10 Low FEMA zone X (unshaded) · 0% chance over 30 yrs
- Wildfire 1/10 Low
- Heat 3/10 Moderate 7 d/yr ≥101°F today · 16 d/yr by 30 yrs out
- Wind 2/10 Low
- Air quality 2/10 Low 1 unhealthy d/yr today · 3 by 30 yrs out
Nearby sold comps map
Loading sold comps map…
Walkable amenities ~0.75 mi
Loading nearby amenities…
Taxation est. · year 1
- Rental income
- $9,802
- − Mortgage interest
- −$3,921
- − Property taxes
- −$2,005
- − Insurance
- −$350
- − Repairs & maintenance
- −$784
- − Management
- −$784
- − Depreciation
- −$2,036
- Taxable loss
- −$79
- Est. tax savings @ 24.0%
- +$19
- After-tax cash flow
- $1,002/yr
For passive investors: Depreciation is non-cash, so a rental often shows a tax loss while cash-flowing — sheltering income. Rental losses are passive: they offset passive income freely, and up to $25,000/yr can offset ordinary (W-2) income if you actively participate and your MAGI is under $100k (phasing out to $0 by $150k); unused losses carry forward. On sale, claimed depreciation is recaptured at up to 25%, and gains may owe capital-gains tax (a 1031 exchange can defer both). Figures are a year-1 estimate at your 24.0% rate — not tax advice; consult a CPA.
Schools (NCES district)
- District
- Washington Local
- NCES district ID
- 3904823
- Math proficiency
- 37% ▼ -20.00%
- Reading proficiency
- 47% ▼ -11.00%
- Median HH income
- $42,105
- Composite
- 35.36/100
- National rank
- #4957
- State rank
- #528 of 656 in OH
Livability — Toledo
- Score
- 66/100
- State rank
- #645
- US rank
- #11442
Category grades
Schools grade is shown separately in the Schools card above.
Census & demographics
- Census place
- Toledo, OH
- County
- Lucas County · 380,724 people
- City population
- 280,811
- Metro
- Toledo, OH
- Population (ZIP)
- 30,780
- Household income
- $64,384
- Rent vs Own
- Severe rent burden
- 917.0
Population outlook (Lucas County) Hauer SSP2
- Today (2025)
- 420,751 people
- By 2030
- 410,187 · -2.5%
- By 2040
- 384,019 · -8.7%
- By 2050
- 355,125 · -15.6%
- By 2075
- 291,683 · -30.7%
- By 2100
- 233,670 · -44.5%
Race, ethnicity, and origin ACS 2023
- Neighborhood character
- Predominantly White (71%)
- Race & ethnicity
- White 71% Black 15% Two or more races 10% Hispanic / Latino 7%
- Hispanic origin (detail)
- Mexican 5%
- Common ancestry
- Romanian 9% Lithuanian 3% Slovak 1%
- Foreign-born
- 2% · Canada
- Languages at home
- 95% English-only · Spanish 3% Arabic 1%
Political lean MEDSL · Lucas
- 2024 margin
- D (+12.6) · D 55.8% · R 43.2%
- 2008→2024 swing
- -18.9pp toward R · 2008: 31.4pp · 2024: 12.6pp
- All cycles
- 2024: D+12.6 2020: D+16.8 2016: D+17.4 2012: D+30.4 2008: D+31.4
Not yet ingested
- Civics
- —
Market trends
- HPI YoY
- ▼ -62.37%
- Current HPI
- 239.1345
- Rent YoY
- ▲ 3.30%
- Metro
- Toledo, OH
- State GDP YoY
- ▲ 1.98%
- F500 in state
- 48
Industry mix (Fortune 500 HQ in OH)
| Industry | F500 HQs | Revenue |
|---|---|---|
| Insurance | 3 | $145B |
|
||
| Industrial Machinery | 3 | $49B |
|
||
| Financial Services | 3 | $24B |
|
||
| Consumer Goods | 2 | $93B |
|
||
| Aerospace / Defense | 2 | $47B |
|
||
| Utilities | 2 | $33B |
|
||
Price history
+259.0% since first listed29 events — show timeline
- 2026-06-10 Price Changed $70,000 NORIS
- 2026-05-29 Listed $72,500 NORIS
- 2026-05-21 Listing Removed — NORIS
- 2026-05-04 Price Changed $69,400 NORIS
- 2026-04-17 Price Changed $69,900 NORIS
- 2026-03-23 Price Changed $75,000 NORIS
- 2026-03-02 Listed $80,000 NORIS
- 2025-12-02 Listing Removed — NORIS
- 2025-11-03 Listed $85,000 NORIS
- 2025-10-14 Price Changed $21,000 NORIS
- 2025-10-14 Price Changed $20,500 NORIS
- 2025-10-13 Price Changed $12,005 NORIS
- 2024-03-24 Rental Removed $800 BUILDIUM
- 2024-02-29 Price Changed $800 BUILDIUM
- 2023-12-29 Price Changed $900 BUILDIUM
- 2023-12-01 Listed for Rent $950 BUILDIUM
- 2018-05-18 Sold (Public Records) $52,900 Public Records
- 2018-05-18 Sold (Public Records) $48,900 Public Records
- 2016-12-29 Sold (Public Records) $48,900 Public Records
- 2016-11-28 Sold (MLS) $21,000 NORIS
- 2016-10-07 Listed $39,000 NORIS
- 2015-03-13 Sold (MLS) $20,500 NORIS
- 2015-02-23 Price Changed $24,900 NORIS
- 2015-01-02 Listed $24,900 NORIS
- 2013-09-13 Sold (MLS) $12,005 NORIS
- 2013-07-05 Price Changed $14,000 NORIS
- 2013-02-28 Listed $14,000 NORIS
- 1990-02-28 Sold (Public Records) $29,000 Public Records
- 1978-06-07 Sold (Public Records) $19,500 Public Records
Property tax history
+8.8%/yrLatest (2025): $2,005 · -13.5% YoY. Source: county tax records.
Cash-flow waterfall
monthlySold comps — $/sqft
last 12 mo · ≤1 miLoading sold comps…