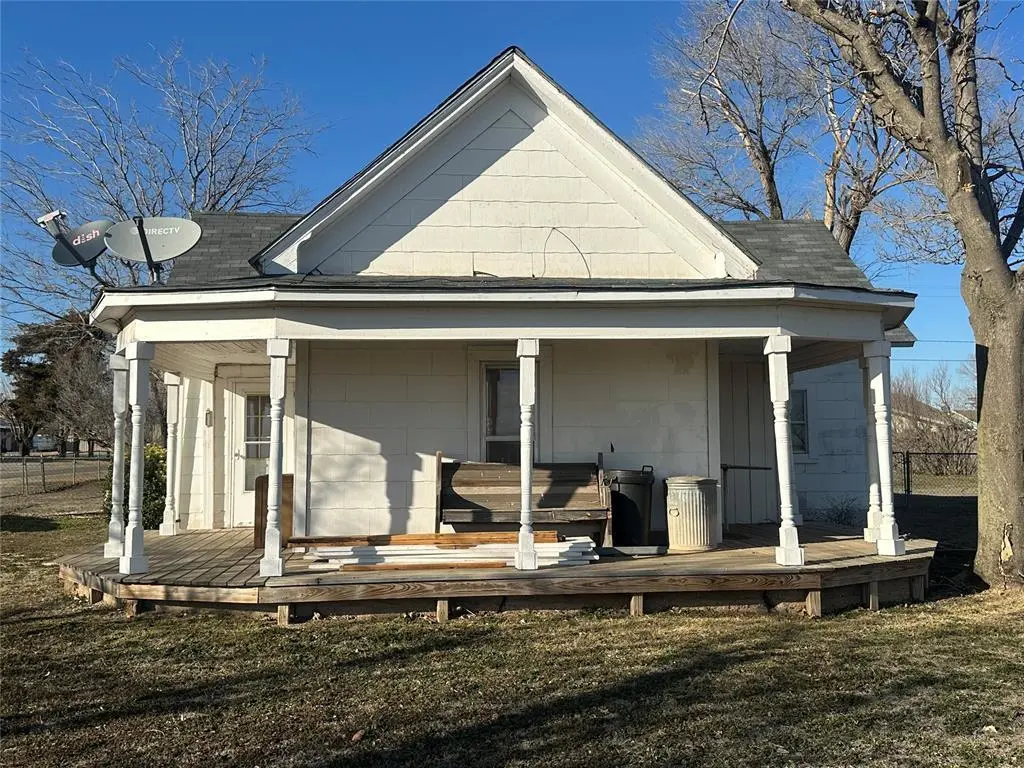
100 Chickasaw Ave · East Duke, OK
Flood risk 1/10 · Minimal
- FEMA flood zone
- X (unshaded)
- Chance of flooding over 30 yrs
- 0.0%
- Est. flood insurance / yr
- $507 – $1,088
Fire risk 1/10 · Minimal
- Est. fire insurance / yr
- $2,463 – $4,575
Heat risk 7/10 · Major
- Hot days now (above 108°F)
- 7 days/yr
- Hot days in 30 yrs
- 18 days/yr
Wind risk 2/10 · Minimal
- Chance of severe wind over 30 yrs
- 4.0%
Air-quality risk 1/10 · Minimal
- Unhealthy air days now
- 0 days/yr
- Unhealthy air days in 30 yrs
- 0 days/yr
Risk factors via First Street. Map © Google.
Why this score? — see what drove the B grade
The composite is a weighted blend of 9 inputs, each scored 0–100. Each bar is that input's sub-score; the figure is the points it added to the 100-point composite (weight × sub-score).
- Cash flow +30.0/30.0
- 1% rule +10.0/10.0
- DSCR +10.0/10.0
- ARV discount +5.8/15.0
- Appreciation +5.0/10.0
- Livability +3.1/5.0
- Rent growth +2.5/5.0
- Schools +2.4/10.0
- Condition / age +2.2/5.0
$55,000
🖨 Deal sheet 📄 Offer letter ✓ Due diligence
Listing remarks
Charming Historic Home in the Heart of Duke, OK. Step back in time with this beautifully preserved 1902 home, the second house ever built in the historic town of Duke, OK. With vintage charm and modern updates, this 2-bedroom, 1-bathroom home is a rare find! Nestled on a spacious corner lot with 4 total lots, there’s plenty of room to enjoy both indoors and out. Home is conveniently locked 2 blocks from the school, which also serves as the community storm shelter. The inviting wrap-around porch is perfect for relaxing, with new decking recently added to both the front and back of the house. A covered back deck provides an ideal space for outdoor entertaining or quiet evenings overlook
Key facts
- Well-insulated home
- Covered back deck
- Wrap-around porch
Tags
Property features AI
Finance
- Other: Property status: Existing; Vacant and ready for occupancy; Corner lot size approximately 0.32 acres
- Financial info: Loan qualification available; Not assumable
- HOA & community: No mandatory association dues
Exterior
- Home design: Single-family residence; One level; South-facing
- Construction: Frame construction; Composition roof (replaced 2024); Post-tension foundation
- Exterior features: Covered deck; Covered porch; Spa / hot tub; Outbuildings; Chain link fencing; Corner lot
Interior
- Bedrooms: 2 bedrooms
- Bathrooms: 1 full bathroom
- Interior features: Living area; Dining area; Wood-burning fireplace
Neighborhood map
What this means for you Summary
Snapshot
- This is a 2-bed/1.0-bath single-family listed at $55k. Condition is rated fair.
Deal economics
- At list price, monthly cash flow is $353 ($4k/yr) — positive.
- The deal already cash-flows at list — no discount required.
- Meets the 1% rule at list price ($928 rent vs $55k).
- Recommended offer: $54k (1.5% below list) — sets the bar for market timing.
Location & tenants
- Location reads 61/100 on livability (#273 in OK) — a middle-class / working-renter tenant base. Strengths: cost of living A+, housing A+, employment B; Watch: crime D-, amenities F, commute F.
- Duke (rural): math 25% / reading 25% proficiency, ranked #336 of 513 in OK (top 66%) — low school quality limits family demand, transient renter base, plan for 1-2y turnover.
- Zoned schools: Duke Es (math 12% / reading 22%, grade F, #540 of 845 statewide, top 68%, 97 students, 0% FRL); Duke Hs (math 24% / reading 24%, grade F, #150 of 447 statewide, top 48%, 53 students, 0% FRL) — zoned schools average 0% FRL vs 39% district-wide (39 pts lower); this property's tenant base skews higher-income than the district average.
- Market conditions: 6 active listings in the ZIP; 8 units permitted in Jackson County in 2024 (0 in 5+ unit buildings).
Forward outlook
- In year one you build about $2k of equity ($380 loan paydown + $2k appreciation (3.0% local appreciation)).
- Jackson County population projected to shrink 6% by 2050 — rents likely to lag national; underwrite the cash flow, not the appreciation.
- At projected returns (3.0% appreciation + 3.0% rent growth), your $15k cash investment doubles in ~3 years — after that, you're playing with house money.
Negotiation context
- It's been on market 24 days — a 2% lower offer ($54k) is reasonable based on typical stale-listing flexibility.
- 3 sale attempts with the ask held roughly flat each time — persistent listings suggest the price (not the market) is what's stuck; bring a comps-based counter.
Risks & watch-outs
- Watch-outs: built in 1940 — expect roof / HVAC / electrical / plumbing capex.
- Climate carrying-cost: extreme-heat days projected 7→18/yr by 2055 (HVAC capex compounding) — expect insurance premiums to compound above CPI over the hold.
Questions for the listing agent
- Have any recent inspections been done? Can we get a copy of the seller's disclosures and any deferred-maintenance estimates?
- Built in 1940 — when were the roof, HVAC, electrical panel, plumbing, and water heater last replaced?
- Is there a deadline driving the sale (1031 exchange, divorce, estate, relocation)? That informs how much negotiation room exists.
- Schools are D-rated, which usually means shorter tenancies and higher turnover. Who's the typical renter profile here, and what's been the actual vacancy rate?
- Crime grade is D in this area — have there been break-ins, vandalism, or insurance claims at this property in the last 3 years? What carrier currently insures it and at what premium?
- What's the average days-on-market for RENTAL listings here right now (not sales)? A rising rental-DOM trend means longer vacancies and softer asking-rent achievability than the comps imply.
- What's the recent tenant-quality profile in this submarket — average credit score on applications, eviction rate, late-payment / NSF rate, and stable-employment percentage? A property-management company in the area should have these aggregated.
- How much new for-sale + rental construction is in the pipeline within 1–3 miles? Heavy new supply typically softens prices + rents 12–24 months out; constrained supply supports both.
Investment metrics
- 1% rule
- 1.69% ✓
- Cap rate
- 13.99%
- Cash-on-cash
- 27.50%
- DSCR
- 2.22
- GRM
- 4.9
CMA / ARV
- ARV (on-the-fly)
- $53,040
- Comps found
- 1
Show comp detail 1 sale within ~0.75 mi
| Address | Dist | Beds/Ba | Sqft | Sold | Price | $/sf | Match |
|---|---|---|---|---|---|---|---|
| 221 N Chicksaw Ave | 0.13mi | 2/1.0 | 1,002 (-2%) | 23mo | $52,500 | $52 | 72 |
Match score weights: distance 35% · size 25% · config 20% · recency 20%. Top-matched comps best support the ARV.
Projected returns pro-forma
3.0% appreciation · 3.0% rent growth · sell at horizon
- IRR
- 33.5%
- Equity multiple
- 2.89×
- Total profit
- $29,113
- Equity at exit
- $24,730
- IRR
- 33.7%
- Equity multiple
- 5.69×
- Total profit
- $72,172
- Equity at exit
- $38,112
Cash invested: $15,400 (down + closing). Projections, not guarantees.
Landlord ↔ Tenant lean methodology
- Overall (STATE)
- 83 Strongly Landlord-Friendly
- State Oklahoma
- 83 Strongly Landlord-Friendly · R+20
- County
- — inherits STATE
- City
- — inherits STATE
ZIP-level market 73532
- Active inventory
- 6
- Price-to-rent
- 4.9×
Monthly cashflow live
- Estimated rent
- $928 medium interval (Pro) →
- Mortgage (P&I)
- −$288
- Tax est. 1.5%
- −$69 /mo · $825/yr
- Insurance
- −$23
- HOA
- −$0
- Vacancy / Maint / Mgmt
- −$195
- Net cashflow
- $353
Break-even live
UW: 25.0% down · 7.5% · 30yr · 1.5% tax · 5.0% vac · 8.0% maint · 8.0% mgmt
Financing live
Cash to close
- Down payment
- $13,750
- Closing costs
- $1,650
- Reserves months
- —
- Total cash needed
- —
Loan-product check · same deal, 3 products live
Conventional
25% down · 7.5% · 30yr
- Down + closing
- —
- Monthly P&I
- —
- Monthly cashflow
- —
- DSCR
- —
- Eligible?
- —
Personal DTI + credit; lowest rate.
DSCR
20% down · 8.5% · 30yr
- Down + closing
- —
- Monthly P&I
- —
- Monthly cashflow
- —
- DSCR
- —
- Eligible?
- —
No personal income docs; deal must DSCR.
Hard money
10% down · 12.0% · 12mo
- Down + closing
- —
- Monthly P&I
- —
- Monthly cashflow
- —
- DSCR
- —
- Eligible?
- —
Short-term bridge; refi at stabilization.
Listing history 20 events
-
2026-06-18days on market $55,000 Active 24 DOM
-
2026-06-17days on market $55,000 Active 23 DOM
-
2026-06-16days on market $55,000 Active 22 DOM
-
2026-06-15days on market $55,000 Active 21 DOM
-
2026-06-13days on market $55,000 Active 19 DOM
-
2026-06-12days on market $55,000 Active 18 DOM
-
2026-06-09days on market $55,000 Active 15 DOM
-
2026-06-08days on market $55,000 Active 14 DOM
-
2026-06-08days on market $55,000 Active 13 DOM
-
2026-06-05days on market $55,000 Active 11 DOM
-
2026-06-04days on market $55,000 Active 9 DOM
-
2026-06-02days on market $55,000 Active 8 DOM
-
2026-06-01days on market $55,000 Active 7 DOM
-
2026-05-31days on market $55,000 Active 6 DOM
-
2026-05-25$55,000 Active
-
2026-02-23historical
-
2025-08-18$55,000 Active
-
2025-08-01historical
-
2025-06-05price $55,000
-
2025-02-24$60,000 Active
ⓘ Source: listings_history table (triggers on properties + properties_extension) + one-shot
backfill from property_details.listing_events for pre-trigger history.
Climate risk First Street
- Flood 1/10 Low FEMA zone X (unshaded) · 0% chance over 30 yrs
- Wildfire 1/10 Low
- Heat 7/10 Severe 7 d/yr ≥108°F today · 18 d/yr by 30 yrs out
- Wind 2/10 Low 4% chance of damaging wind over 30 yrs
- Air quality 1/10 Low 0 unhealthy d/yr today · 0 by 30 yrs out
Nearby sold comps map
Loading sold comps map…
Walkable amenities ~0.75 mi
Loading nearby amenities…
Taxation est. · year 1
- Rental income
- $11,133
- − Mortgage interest
- −$3,081
- − Property taxes
- −$825
- − Insurance
- −$275
- − Repairs & maintenance
- −$891
- − Management
- −$891
- − Depreciation
- −$1,600
- Taxable income
- $3,571
- Est. tax owed @ 24.0%
- −$857
- After-tax cash flow
- $3,377/yr
For passive investors: Depreciation is non-cash, so a rental often shows a tax loss while cash-flowing — sheltering income. Rental losses are passive: they offset passive income freely, and up to $25,000/yr can offset ordinary (W-2) income if you actively participate and your MAGI is under $100k (phasing out to $0 by $150k); unused losses carry forward. On sale, claimed depreciation is recaptured at up to 25%, and gains may owe capital-gains tax (a 1031 exchange can defer both). Figures are a year-1 estimate at your 24.0% rate — not tax advice; consult a CPA.
Condition & rehab AI · 12 photos
This charming historic home in Duke, OK, requires moderate renovations to improve its condition and value. Key areas for improvement include the kitchen and bathroom, which need new cabinets, appliances, and flooring. Fresh paint and updated fixtures will also enhance the home's curb appeal and functionality.
Repairs flagged
- Moderate kitchen cabinets — dated and worn
- Moderate bathroom cabinets — dated and worn
- Moderate kitchen appliances — dated and worn
- Moderate kitchen flooring — dated and worn
- Moderate bathroom flooring — dated and worn
- Moderate interior paint — peeling in some areas
Value-add opportunities
- Resale paint interior walls — fresh paint enhances curb appeal
- Resale replace kitchen cabinets — new cabinets improve functionality and aesthetics
- Resale replace bathroom cabinets — new cabinets improve functionality and aesthetics
- Resale replace kitchen appliances — new appliances improve functionality and aesthetics
- Resale replace kitchen flooring — new flooring improves functionality and aesthetics
- Resale replace bathroom flooring — new flooring improves functionality and aesthetics
Renovation cost estimate screening
| Repair item | Severity | Est. cost |
|---|---|---|
| kitchen cabinets · dated and worn | Moderate | $3,000–15,000 |
| bathroom cabinets · dated and worn | Moderate | $3,000–15,000 |
| kitchen appliances · dated and worn | Moderate | $3,000–15,000 |
| kitchen flooring · dated and worn | Moderate | $3,000–15,000 |
| bathroom flooring · dated and worn | Moderate | $3,000–15,000 |
| interior paint · peeling in some areas | Moderate | $3,000–15,000 |
| Total estimated repair cost · 6 items | $18,000–90,000 |
Value-add ROI direction
- Resale paint interior walls — fresh paint enhances curb appeal ↑
- Resale replace kitchen cabinets — new cabinets improve functionality and aesthetics ↑
- Resale replace bathroom cabinets — new cabinets improve functionality and aesthetics ↑
- Resale replace kitchen appliances — new appliances improve functionality and aesthetics ↑
- Resale replace kitchen flooring — new flooring improves functionality and aesthetics ↑
- Resale replace bathroom flooring — new flooring improves functionality and aesthetics ↑
ⓘ Cost ranges are severity-bucket heuristics (US national rule-of-thumb). Get contractor quotes + a written scope before underwriting a rehab budget.
Schools (NCES district)
- District
- Duke
- NCES district ID
- 4010260
- Math proficiency
- 25% ▲ 5.00%
- Reading proficiency
- 25% ▼ -10.00%
- Median HH income
- $43,457
- Composite
- 24.47/100
- National rank
- #13083
- State rank
- #336 of 513 in OK
Livability — East Duke
- Score
- 61/100
- State rank
- #273
- US rank
- #17340
Category grades
Schools grade is shown separately in the Schools card above.
Census & demographics
- Census place
- East Duke, OK
- Population (ZIP)
- 421
Population outlook (Jackson County) Hauer SSP2
- Today (2025)
- 24,084 people
- By 2030
- 23,476 · -2.5%
- By 2040
- 22,731 · -5.6%
- By 2050
- 22,586 · -6.2%
- By 2075
- 25,413 · +5.5%
- By 2100
- 31,069 · +29.0%
Race, ethnicity, and origin ACS 2023
- Neighborhood character
- Predominantly White (85%)
- Race & ethnicity
- White 85% Hispanic / Latino 7% Two or more races 6% Native American 3%
- Hispanic origin (detail)
- Mexican 6%
- Common ancestry
- Italian 3% Lithuanian 1% Scottish 1%
- Foreign-born
- 1%
- Languages at home
- 97% English-only · Spanish 1% German/W. Germanic 1%
Political lean MEDSL · Jackson
- 2024 margin
- Solid R (+58.3) · D 19.9% · R 78.2% · Other 1.9%
- 2008→2024 swing
- -8.7pp toward R · 2008: -49.6pp · 2024: -58.3pp
- All cycles
- 2024: R+58.3 2020: R+57.7 2016: R+57.6 2012: R+50.7 2008: R+49.6
Not yet ingested
- Civics
- —
Market trends
- HPI YoY
- —
- Current HPI
- —
- Rent YoY
- —
- Metro
- —
- State GDP YoY
- ▲ 1.55%
- F500 in state
- 6
Industry mix (Fortune 500 HQ in OK)
| Industry | F500 HQs | Revenue |
|---|---|---|
| Energy | 3 | $48B |
|
||
Price history
-8.3% since first listed6 events — show timeline
- 2026-05-25 Listed $55,000 MLSOK
- 2026-02-23 Listing Removed — MLSOK
- 2025-08-18 Listed $55,000 MLSOK
- 2025-08-01 Listing Removed — MLSOK
- 2025-06-05 Price Changed $55,000 MLSOK
- 2025-02-24 Listed $60,000 MLSOK
Cash-flow waterfall
monthlySold comps — $/sqft
last 12 mo · ≤1 miLoading sold comps…