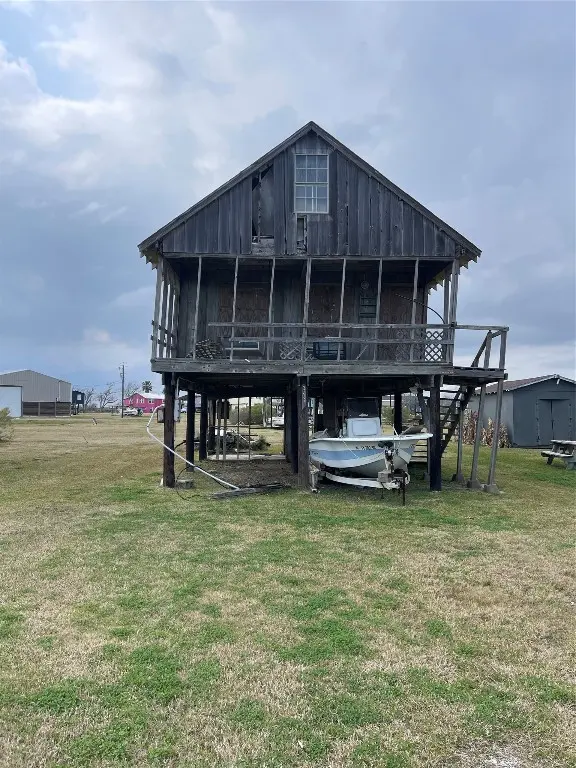
302 Flamingo St · Sargent, TX
Flood risk 10/10 · Severe
- FEMA flood zone
- AE
- Chance of flooding over 30 yrs
- 0.99%
- Est. flood insurance / yr
- $1,737 – $8,500
Fire risk 4/10 · Minor
- Est. fire insurance / yr
- $1,222 – $2,270
Heat risk 10/10 · Severe
- Hot days now (above 116°F)
- 7 days/yr
- Hot days in 30 yrs
- 24 days/yr
Wind risk 10/10 · Severe
- Chance of severe wind over 30 yrs
- 99.0%
Air-quality risk 2/10 · Minimal
- Unhealthy air days now
- 1 days/yr
- Unhealthy air days in 30 yrs
- 1 days/yr
Risk factors via First Street. Map © Google.
Why this score? — see what drove the B- grade
The composite is a weighted blend of 9 inputs, each scored 0–100. Each bar is that input's sub-score; the figure is the points it added to the 100-point composite (weight × sub-score).
- Cash flow +30.0/30.0
- 1% rule +10.0/10.0
- DSCR +10.0/10.0
- ARV discount +7.5/15.0
- Rent growth +3.3/5.0
- Schools +3.1/10.0
- Livability +2.5/5.0
- Condition / age +2.5/5.0
- Appreciation +0.0/10.0
$29,900
🖨 Deal sheet (PDF) 📄 Offer letter ✓ Due diligence
Listing remarks MLS
Located in Bay City, 302 Flamingo Dr. offers an opportunity for investors, builders, or buyers looking for a lot to build new. The existing structure is being sold as-is, where-is, with no repairs to be made by the seller. Property is priced at lot value and presents potential for redevelopment, renovation, or new construction. Conveniently situated near local shopping, dining, schools, and everyday amenities, with easy access to major roadways. Outdoor enthusiasts will appreciate being just a short drive from the Texas Gulf Coast, including nearby beaches such as Matagorda, known for fishing, boating, and coastal recreation. Enjoy the benefit of small-town living while staying close to the water.
Key facts
- Nearby beaches
- Small-town living
- 5,270 sq ft lot
Tags
Neighborhood map
What this means for you Summary
Snapshot
- This is a 1-bed/1.0-bath single-family listed at $30k.
Deal economics
- At list price, monthly cash flow is $-1 ($-12/yr) — negative.
- To cash-flow at today's rent, offer at most $30k (0.5% below list).
- Meets the 1% rule at list price ($804 rent vs $30k).
- Recommended offer: $26k (12.0% below list) — sets the bar for market timing.
Location & tenants
- Location reads: area grade B — affects rentability + tenant quality, not the cash-flow math above.
- Van Vleck ISD (town): math 36% / reading 37% proficiency, ranked #492 of 826 in TX (top 60%) — families likely to look elsewhere, expect single-tenant / working-renter base with shorter leases.
- Zoned schools: Van Vleck El (math 42% / reading 37%, grade F, #1,545 of 4,322 statewide, top 38%, 303 students, 58% FRL); Van Vleck Jr H S (math 29% / reading 38%, grade F, #911 of 1,662 statewide, top 56%, 243 students, 59% FRL); Van Vleck H S (math 57% / reading 42%, grade D, #509 of 1,632 statewide, top 34%, 355 students, 50% FRL) — zoned schools at 55% FRL track the district average.
- Market conditions: Rents rising (+3.3%/yr); 622 active listings in the ZIP; 153 units permitted in Matagorda County in 2024 (0 in 5+ unit buildings).
- This rent is only 16% of the median local income ($59k/yr) — well below the 30% rent-burden line; pricing power to push rent on renewal without tenant pushback.
Forward outlook
- Local home prices are declining (-3.0%/yr); year-one equity from $207 of loan paydown is wiped out by about $897 of value loss. Plan a longer hold.
Negotiation context
- It's been on market 126 days — a 12% lower offer ($26k) is reasonable based on typical stale-listing flexibility.
Risks & watch-outs
- Watch-outs: flood insurance adds $427/mo.
- Climate carrying-cost: in FEMA flood zone AE (mandatory federal flood insurance); severe wind risk, 99% chance of damaging wind over 30y; extreme-heat days projected 7→24/yr by 2055 (HVAC capex compounding) — expect insurance premiums to compound above CPI over the hold.
Questions for the listing agent
- What do current leases actually rent for vs. the listed asking? Can we see a recent rent roll and the last 12 months of T-12 income?
- It's been on market 126 days. Have you received any prior offers? Is the seller open to a 12% concession, seller financing, or rate buy-down credit?
- Built in 1970 — when were the roof, HVAC, electrical panel, plumbing, and water heater last replaced?
- What's the actual annual flood-insurance premium (NFIP or private), and is the property in a SFHA with mandatory coverage?
- What does the HOA fee cover, when was the last increase, and are there any pending special assessments or reserve-fund shortfalls?
- Why hasn't it sold? Are there any deal-killer items the seller is aware of (foundation, flood, title, zoning, code violations)?
- Is there a deadline driving the sale (1031 exchange, divorce, estate, relocation)? That informs how much negotiation room exists.
- What's the average days-on-market for RENTAL listings here right now (not sales)? A rising rental-DOM trend means longer vacancies and softer asking-rent achievability than the comps imply.
- What's the recent tenant-quality profile in this submarket — average credit score on applications, eviction rate, late-payment / NSF rate, and stable-employment percentage? A property-management company in the area should have these aggregated.
- How much new for-sale + rental construction is in the pipeline within 1–3 miles? Heavy new supply typically softens prices + rents 12–24 months out; constrained supply supports both.
Investment metrics
- 1% rule
- 2.69% ✓
- Cap rate
- 23.37%
- Cash-on-cash
- 61.00%
- DSCR
- 3.71
- GRM
- 3.1
CMA / ARV
- ARV (median comp)
- $183,374
- List price
- $29,900
- Delta
- -83.69%
- Verdict
- UNDERPRICED
- Comps
- 9 within 1.0 mi
Projected returns pro-forma
-3.0% appreciation · 3.28% rent growth · sell at horizon
- IRR
- -14.5%
- Equity multiple
- 0.47×
- Total profit
- $-4,405
- Equity at exit
- $4,458
- IRR
- -3.1%
- Equity multiple
- 0.78×
- Total profit
- $-1,859
- Equity at exit
- $2,585
Cash invested: $8,372 (down + closing). Projections, not guarantees.
Landlord ↔ Tenant lean methodology
- Overall (STATE)
- 87 Strongly Landlord-Friendly
- State Texas
- 87 Strongly Landlord-Friendly · R+5
- County
- — inherits STATE
- City
- — inherits STATE
ZIP-level market 77414
- Home prices YoY
- -17.7%
- Rents YoY
- 3.3%
- Active inventory
- 622
- Price-to-rent
- 3.1×
Monthly cashflow live
- Estimated rent
- $804 medium interval (Pro) →
- Mortgage (P&I)
- −$157
- Tax est. 1.5%
- −$37 /mo · $448/yr
- Insurance
- −$12
- Flood insurance flood zone
- −$427 /mo · $5,118/yr
- HOA
- −$3
- Vacancy / Maint / Mgmt
- −$169
- Net cashflow
- $-1
Break-even live
Sensitivity live
| Price | -10% $20 | -5% $9 | +0% $-1 | +5% $-11 | +10% $-22 |
|---|---|---|---|---|---|
| Rent | -10% $-65 | -5% $-33 | +0% $-1 | +5% $31 | +10% $63 |
| Rate | -1.0pp $14 | -0.5pp $7 | base $-1 | +0.5pp $-9 | +1.0pp $-17 |
UW: 25.0% down · 7.5% · 30yr · 1.5% tax · 5.0% vac · 8.0% maint · 8.0% mgmt
Financing live
Cash to close
- Down payment
- $7,475
- Closing costs
- $897
- Reserves months
- —
- Total cash needed
- —
Loan-product check · same deal, 3 products live
Conventional
25% down · 7.5% · 30yr
- Down + closing
- —
- Monthly P&I
- —
- Monthly cashflow
- —
- DSCR
- —
- Eligible?
- —
Personal DTI + credit; lowest rate.
DSCR
20% down · 8.5% · 30yr
- Down + closing
- —
- Monthly P&I
- —
- Monthly cashflow
- —
- DSCR
- —
- Eligible?
- —
No personal income docs; deal must DSCR.
Hard money
10% down · 12.0% · 12mo
- Down + closing
- —
- Monthly P&I
- —
- Monthly cashflow
- —
- DSCR
- —
- Eligible?
- —
Short-term bridge; refi at stabilization.
HOA detail
- Monthly dues
- $3 · $36/yr
- Likely covers
- water
Listing history 17 events
-
2026-06-19days on market $29,900 Active 126 DOM
-
2026-06-18days on market $29,900 Active 125 DOM
-
2026-06-17days on market $29,900 Active 124 DOM
-
2026-06-16days on market $29,900 Active 123 DOM
-
2026-06-15days on market $29,900 Active 122 DOM
-
2026-06-14days on market $29,900 Active 120 DOM
-
2026-06-12days on market $29,900 Active 119 DOM
-
2026-06-09days on market $29,900 Active 116 DOM
-
2026-06-08days on market $29,900 Active 115 DOM
-
2026-06-07days on market $29,900 Active 114 DOM
-
2026-06-07days on market $29,900 Active 113 DOM
-
2026-06-03days on market $29,900 Active 110 DOM
-
2026-06-02days on market $29,900 Active 109 DOM
-
2026-06-01days on market $29,900 Active 108 DOM
-
2026-05-31days on market $29,900 Active 107 DOM
-
2026-05-30days on market $29,900 Active 106 DOM
-
2026-02-13$29,900 Active 706-char remark
Show marketing remark (706 chars)
Located in Bay City, 302 Flamingo Dr. offers an opportunity for investors, builders, or buyers looking for a lot to build new. The existing structure is being sold as-is, where-is, with no repairs to be made by the seller. Property is priced at lot value and presents potential for redevelopment, renovation, or new construction. Conveniently situated near local shopping, dining, schools, and everyday amenities, with easy access to major roadways. Outdoor enthusiasts will appreciate being just a short drive from the Texas Gulf Coast, including nearby beaches such as Matagorda, known for fishing, boating, and coastal recreation. Enjoy the benefit of small-town living while staying close to the water.
ⓘ Source: listings_history table (triggers on properties + properties_extension) + one-shot
backfill from property_details.listing_events for pre-trigger history.
Climate risk First Street
- Flood 10/10 Extreme FEMA zone AE · 99% chance over 30 yrs
- Wildfire 4/10 Moderate
- Heat 10/10 Extreme 7 d/yr ≥116°F today · 24 d/yr by 30 yrs out
- Wind 10/10 Extreme 99% chance of damaging wind over 30 yrs
- Air quality 2/10 Low 1 unhealthy d/yr today · 1 by 30 yrs out
Nearby sold comps map
Loading sold comps map…
Walkable amenities ~0.75 mi
Loading nearby amenities…
Taxation est. · year 1
- Rental income
- $9,648
- − Mortgage interest
- −$1,675
- − Property taxes
- −$448
- − Insurance
- −$5,268
- − Repairs & maintenance
- −$772
- − Management
- −$772
- − HOA
- −$36
- − Depreciation
- −$870
- Taxable loss
- −$193
- Est. tax savings @ 24.0%
- +$46
- After-tax cash flow
- $34/yr
For passive investors: Depreciation is non-cash, so a rental often shows a tax loss while cash-flowing — sheltering income. Rental losses are passive: they offset passive income freely, and up to $25,000/yr can offset ordinary (W-2) income if you actively participate and your MAGI is under $100k (phasing out to $0 by $150k); unused losses carry forward. On sale, claimed depreciation is recaptured at up to 25%, and gains may owe capital-gains tax (a 1031 exchange can defer both). Figures are a year-1 estimate at your 24.0% rate — not tax advice; consult a CPA.
Schools (NCES district)
- District
- Van Vleck ISD
- NCES district ID
- 4843950
- Math proficiency
- 36% ▼ -14.00%
- Reading proficiency
- 37% ▼ -8.00%
- Median HH income
- $43,348
- Composite
- 30.96/100
- National rank
- #6106
- State rank
- #492 of 826 in TX
Livability — Sargent
No livability data for this city. (Only ~50 U.S. cities are tracked.)
Census & demographics
- Census place
- Sargent, TX
- County
- Matagorda County · 24,334 people
- Metro
- Bay City, TX
- Population (ZIP)
- 24,334
- Household income
- $59,128
- Rent vs Own
- Severe rent burden
- 1228.0
Population outlook (Matagorda County) Hauer SSP2
- Today (2025)
- 37,148 people
- By 2030
- 37,082 · -0.2%
- By 2040
- 36,987 · -0.4%
- By 2050
- 36,934 · -0.6%
- By 2075
- 37,178 · +0.1%
- By 2100
- 35,184 · -5.3%
Race, ethnicity, and origin ACS 2023
- Neighborhood character
- Diverse neighborhood (Simpson 0.65)
- Race & ethnicity
- Hispanic / Latino 43% White 39% Black 13% Two or more races 13% Asian 2%
- Hispanic origin (detail)
- Mexican 37% Puerto Rican 1%
- Common ancestry
- Lithuanian 1% Slovak 1% Serbian 1%
- Foreign-born
- 12% · Canada
- Languages at home
- 71% English-only · Spanish 26% Other Indo-European 2% German/W. Germanic 1%
Political lean MEDSL · Matagorda
- 2024 margin
- Solid R (+50.5) · D 24.3% · R 74.8%
- 2008→2024 swing
- -23.1pp toward R · 2008: -27.4pp · 2024: -50.5pp
- All cycles
- 2024: R+50.5 2020: R+44.5 2016: R+40.7 2012: R+33.5 2008: R+27.4
Not yet ingested
- Civics
- —
Market trends
- HPI YoY
- ▼ -36.31%
- Current HPI
- 168.9985
- Rent YoY
- ▲ 3.28%
- Metro
- Bay City, TX
- State GDP YoY
- ▲ 3.95%
- F500 in state
- 110
Industry mix (Fortune 500 HQ in TX)
| Industry | F500 HQs | Revenue |
|---|---|---|
| Energy | 16 | $1,198B |
|
||
| Technology | 5 | $198B |
|
||
| Engineering / Construction | 4 | $72B |
|
||
| Energy Services | 3 | $60B |
|
||
| Utilities | 3 | $41B |
|
||
| Healthcare | 2 | $330B |
|
||
Price history
1 event — show timeline
- 2026-02-13 Listed $29,900 HARMLS
Property tax history
+6.9%/yrLatest (2025): $1,558 · +5.7% YoY. Source: county tax records.
Cash-flow waterfall
monthlySold comps — $/sqft
last 12 mo · ≤1 miLoading sold comps…