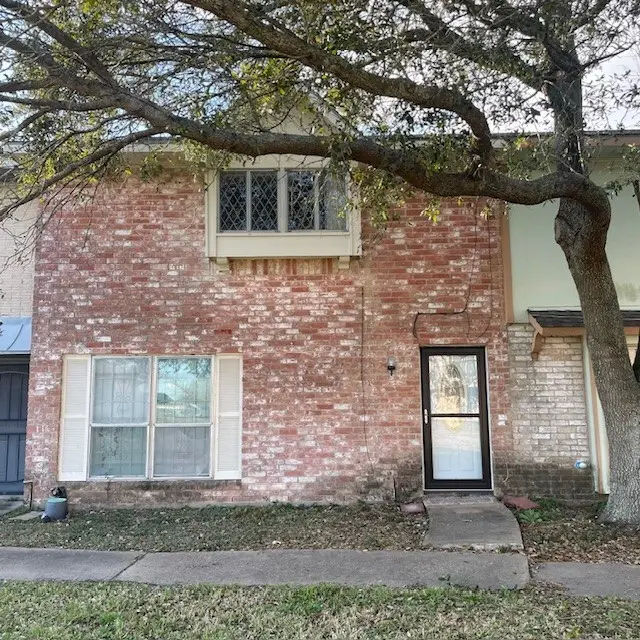
6989 Chasewood Dr · Houston, TX
Flood risk 1/10 · Minimal
- FEMA flood zone
- X (unshaded)
- Chance of flooding over 30 yrs
- 0.0%
- Est. flood insurance / yr
- $507 – $1,088
Fire risk 2/10 · Minimal
- Est. fire insurance / yr
- $1,222 – $2,270
Heat risk 9/10 · Severe
- Hot days now (above 110°F)
- 7 days/yr
- Hot days in 30 yrs
- 23 days/yr
Wind risk 9/10 · Severe
- Chance of severe wind over 30 yrs
- 99.0%
Air-quality risk 3/10 · Minor
- Unhealthy air days now
- 2 days/yr
- Unhealthy air days in 30 yrs
- 3 days/yr
Risk factors via First Street. Map © Google.
Why this score? — see what drove the B grade
The composite is a weighted blend of 9 inputs, each scored 0–100. Each bar is that input's sub-score; the figure is the points it added to the 100-point composite (weight × sub-score).
- Cash flow +29.2/30.0
- 1% rule +10.0/10.0
- DSCR +10.0/10.0
- ARV discount +7.5/15.0
- Appreciation +4.7/10.0
- Schools +4.5/10.0
- Livability +3.7/5.0
- Rent growth +2.6/5.0
- Condition / age +2.5/5.0
$120,000
🖨 Deal sheet 📄 Offer letter ✓ Due diligence
Listing remarks MLS
Spacious two-story brick townhome offering 3 bedrooms and 3 full bathrooms across approximately 1,728 square feet. The home includes a dedicated dining area, generously sized bedrooms, a private patio perfect for outdoor relaxation, and assigned parking. Located in an established community in Missouri City, the property provides easy access to major thoroughfares including Highway 6 and the Fort Bend Parkway Toll Road, with nearby shopping and dining options just minutes away. Offered as-is, this home presents a fantastic opportunity for investors or buyers looking to add personal touches and unlock its full potential.
Key facts
- Private patio
- Assigned parking
- $220 HOA
Tags
Neighborhood map
What this means for you Summary
Snapshot
- This is a 3-bed/3.0-bath single-family listed at $120k.
Deal economics
- At list price, monthly cash flow is $420 ($5k/yr) — positive.
- The deal already cash-flows at list — no discount required.
- Meets the 1% rule at list price ($2k rent vs $120k).
- Recommended offer: $106k (12.0% below list) — sets the bar for market timing.
- Cap rate 10.5% vs local median 3.2% in Houston — top-decile yield for the area; either an underpriced asset or a hidden risk that comps aren't pricing in. Stress-test before assuming the spread holds.
Location & tenants
- Location reads 74/100 on livability (#184 in TX, #4,771 nationally) — a middle-class / working-renter tenant base. Strengths: amenities A+, cost of living A+, housing A+; Watch: schools D, crime F.
- Fort Bend ISD (suburban): math 44% / reading 53% proficiency, ranked #140 of 826 in TX (top 17%) — families likely to look elsewhere, expect single-tenant / working-renter base with shorter leases.
- Market conditions: Rents flat; 186 active listings in the ZIP; 19 comparable units currently listed for rent nearby; rentals at typical pace (median 15d on market — plan ~3-4 weeks tenant-placement turnaround); 12,093 units permitted in Fort Bend County in 2024 (815 in 5+ unit buildings).
- This rent runs 31% of the median local income ($75k/yr) — at the standard rent-burdened threshold; future hikes will face affordability resistance.
Forward outlook
- In year one you build about $169 of equity ($830 loan paydown + $-661 appreciation (-0.6% local appreciation)).
- Fort Bend County population projected at +75% by 2050 — long-run rental-demand tailwind backs the buy-and-hold thesis.
- At projected returns (-0.6% appreciation + 0.3% rent growth), your $34k cash investment doubles in ~7 years — after that, you're playing with house money.
Negotiation context
- It's been on market 124 days — a 12% lower offer ($106k) is reasonable based on typical stale-listing flexibility.
- 2 sale attempts with the ask held roughly flat each time — persistent listings suggest the price (not the market) is what's stuck; bring a comps-based counter.
Risks & watch-outs
- Climate carrying-cost: severe wind risk, 99% chance of damaging wind over 30y; extreme-heat days projected 7→23/yr by 2055 (HVAC capex compounding) — expect insurance premiums to compound above CPI over the hold.
Questions for the listing agent
- It's been on market 124 days. Have you received any prior offers? Is the seller open to a 12% concession, seller financing, or rate buy-down credit?
- Built in 1974 — when were the roof, HVAC, electrical panel, plumbing, and water heater last replaced?
- What does the HOA fee cover, when was the last increase, and are there any pending special assessments or reserve-fund shortfalls?
- Why hasn't it sold? Are there any deal-killer items the seller is aware of (foundation, flood, title, zoning, code violations)?
- Is there a deadline driving the sale (1031 exchange, divorce, estate, relocation)? That informs how much negotiation room exists.
- Schools are D-rated, which usually means shorter tenancies and higher turnover. Who's the typical renter profile here, and what's been the actual vacancy rate?
- Crime grade is F in this area — have there been break-ins, vandalism, or insurance claims at this property in the last 3 years? What carrier currently insures it and at what premium?
- What's the average days-on-market for RENTAL listings here right now (not sales)? A rising rental-DOM trend means longer vacancies and softer asking-rent achievability than the comps imply.
- What's the recent tenant-quality profile in this submarket — average credit score on applications, eviction rate, late-payment / NSF rate, and stable-employment percentage? A property-management company in the area should have these aggregated.
- How much new for-sale + rental construction is in the pipeline within 1–3 miles? Heavy new supply typically softens prices + rents 12–24 months out; constrained supply supports both.
Investment metrics
- 1% rule
- 1.60% ✓
- Cap rate
- 10.49%
- Cash-on-cash
- 15.00%
- DSCR
- 1.67
- GRM
- 5.2
CMA / ARV
- ARV (median comp)
- $119,958
- List price
- $120,000
- Delta
- 0.04%
- Verdict
- FAIR
- Comps
- 20 within 1.0 mi
Show comp detail 12 sales within ~0.75 mi
| Address | Dist | Beds/Ba | Sqft | Sold | Price | $/sf | Match |
|---|---|---|---|---|---|---|---|
| 7612 Goudin Dr | 0.26mi | 3/2.5 | 1,699 (-2%) | 2mo | $165,000 | $97 | 81 |
| 7027 Dickson Way | 0.33mi | 3/2.0 | 1,782 (+3%) | 3mo | $245,000 | $137 | 73 |
| 7018 Roberson Rd | 0.35mi | 3/2.5 | 1,670 (-3%) | 7mo | $220,000 | $132 | 70 |
| 7102 Bahia Ln | 0.26mi | 3/2.0 | 1,837 (+6%) | 7mo | $180,000 | $98 | 68 |
| 15403 Blueridge Rd | 0.35mi | 4/2.0 (+1) | 1,833 (+6%) | 0mo | $249,999 | $136 | 64 |
| 6734 Indian Lake Dr | 0.52mi | 3/2.0 | 1,654 (-4%) | 4mo | $230,000 | $139 | 61 |
| 15043 Four Winds Dr | 0.42mi | 3/2.0 | 1,612 (-7%) | 6mo | $273,000 | $169 | 60 |
| 15206 Ridingwood Dr | 0.28mi | 3/2.0 | 1,980 (+15%) | 3mo | $294,786 | $149 | 56 |
| 7822 Chasecreek Dr | 0.74mi | 3/2.0 | 1,654 (-4%) | 0mo | $225,000 | $136 | 54 |
| 14602 Steeplechase Dr | 0.60mi | 3/2.0 | 1,612 (-7%) | 7mo | $165,000 | $102 | 51 |
| 15818 Galling Dr | 0.72mi | 3/2.0 | 1,662 (-4%) | 8mo | $230,000 | $138 | 49 |
| 15903 Kenbrook Dr | 0.68mi | 3/2.0 | 1,487 (-14%) | 1mo | $245,000 | $165 | 40 |
Match score weights: distance 35% · size 25% · config 20% · recency 20%. Top-matched comps best support the ARV.
Projected returns pro-forma
-0.55% appreciation · 0.34% rent growth · sell at horizon
- IRR
- 10.2%
- Equity multiple
- 1.46×
- Total profit
- $15,348
- Equity at exit
- $31,574
- IRR
- 13.3%
- Equity multiple
- 2.23×
- Total profit
- $41,472
- Equity at exit
- $35,433
Cash invested: $33,600 (down + closing). Projections, not guarantees.
Landlord ↔ Tenant lean methodology
- Overall (STATE)
- 87 Strongly Landlord-Friendly
- State Texas
- 87 Strongly Landlord-Friendly · R+5
- County
- — inherits STATE
- City
- — inherits STATE
ZIP-level market 77489
- Home prices YoY
- -0.2%
- Rents YoY
- 0.3%
- Active inventory
- 186
- Price-to-rent
- 5.2×
Monthly cashflow live
- Estimated rent
- $1,919 high interval (Pro) →
- Mortgage (P&I)
- −$629
- Tax from tax record
- −$197 /mo · $2,364/yr
- Insurance
- −$50
- HOA
- −$220
- Vacancy / Maint / Mgmt
- −$403
- Net cashflow
- $420
Break-even live
UW: 25.0% down · 7.5% · 30yr · 1.5% tax · 5.0% vac · 8.0% maint · 8.0% mgmt
Financing live
Cash to close
- Down payment
- $30,000
- Closing costs
- $3,600
- Reserves months
- —
- Total cash needed
- —
Loan-product check · same deal, 3 products live
Conventional
25% down · 7.5% · 30yr
- Down + closing
- —
- Monthly P&I
- —
- Monthly cashflow
- —
- DSCR
- —
- Eligible?
- —
Personal DTI + credit; lowest rate.
DSCR
20% down · 8.5% · 30yr
- Down + closing
- —
- Monthly P&I
- —
- Monthly cashflow
- —
- DSCR
- —
- Eligible?
- —
No personal income docs; deal must DSCR.
Hard money
10% down · 12.0% · 12mo
- Down + closing
- —
- Monthly P&I
- —
- Monthly cashflow
- —
- DSCR
- —
- Eligible?
- —
Short-term bridge; refi at stabilization.
Rent comps 19 comps
| Address | Beds | Baths | Sqft | Rent | $/sqft | DOM | Units | Dist |
|---|---|---|---|---|---|---|---|---|
| 15703 Baybriar Dr Missouri City, TX | 3.0 | 2.0 | 1252 | $1,615 | $1.29 | 19d | 1 | 0.49mi |
| 15823 Baybriar Dr Missouri City, TX | 3.0 | 2.0 | 1335 | $1,641 | $1.23 | 5d | 1 | 0.65mi |
| 6610 Rowell Ct Missouri City, TX | 3.0 | 2.0 | 1753 | $2,056 | $1.17 | 5d | 1 | 0.70mi |
| 507 Whippoorwill Dr Missouri City, TX | 3.0 | 2.0 | 1970 | $1,925 | $0.98 | 43d | 1 | 0.81mi |
| 6406 Summer Ridge Dr Missouri City, TX | 3.0 | 2.0 | 1624 | $1,958 | $1.21 | 2d | 1 | 0.95mi |
| 712 Beechbend Dr Missouri City, TX | 4.0 | 2.5 | 2245 | $2,250 | $1.00 | 20d | 1 | 1.04mi |
| 13960 Hillcroft St Unit 425 Houston, TX | 2.0 | 2.0 | 1332 | $1,540 | $1.16 | 7d | 1 | 1.11mi |
| 13960 Hillcroft St Unit 2174 Houston, TX | 2.0 | 2.0 | 1332 | $1,532 | $1.15 | 2d | 1 | 1.11mi |
| 13960 Hillcroft St Unit 14017 Houston, TX | 2.0 | 2.0 | 1332 | $1,540 | $1.16 | 15d | 1 | 1.11mi |
| 16211 Corsair Rd Houston, TX | 3.0 | 2.0 | 1139 | $1,813 | $1.59 | 24d | 1 | 1.28mi |
| 13939 Hillcroft Ave Unit 13976 Houston, TX | 2.0 | 2.0 | 1089 | $1,703 | $1.56 | 20d | 1 | 1.30mi |
| 13939 Hillcroft Ave Unit 13972 Houston, TX | 3.0 | 2.0 | 1404 | $2,164 | $1.54 | 20d | 1 | 1.30mi |
| 13939 Hillcroft Ave Houston, TX | 1.0–3.0 | 1.0–2.0 | 985 | $2,254 | $2.29 | 3d | 22 | 1.30mi |
| 16310 Setter Ct Missouri City, TX | 3.0 | 2.0 | 1672 | $1,700 | $1.02 | 43d | 1 | 1.31mi |
| 16322 Petaluma Dr Houston, TX | 3.0 | 2.5 | 1876 | $1,770 | $0.94 | 15d | 1 | 1.32mi |
| 16432 Chimney Rock Rd Unit 16465 Houston, TX | 3.0 | 2.0 | 1349 | $1,524 | $1.13 | 43d | 1 | 1.41mi |
| 16432 Chimney Rock Rd Unit 3112 Houston, TX | 3.0 | 2.0 | 1349 | $1,481 | $1.10 | 2d | 1 | 1.41mi |
| 16432 Chimney Rock Rd Unit 3174 Houston, TX | 3.0 | 2.0 | 1349 | $1,513 | $1.12 | 10d | 1 | 1.41mi |
| 1215 New Tree Ln Missouri City, TX | 3.0 | 2.0 | 1323 | $1,725 | $1.30 | 12d | 1 | 1.46mi |
HOA detail
- Monthly dues
- $220 · $2,640/yr
- Likely covers
- parking
Listing history 20 events
-
2026-06-18days on market $120,000 Active 124 DOM
-
2026-06-17days on market $120,000 Active 123 DOM
-
2026-06-16days on market $120,000 Active 122 DOM
-
2026-06-15days on market $120,000 Active 121 DOM
-
2026-06-13days on market $120,000 Active 119 DOM
-
2026-06-09days on market $120,000 Active 115 DOM
-
2026-06-07days on market $120,000 Active 113 DOM
-
2026-06-04days on market $120,000 Active 110 DOM
-
2026-06-03days on market $120,000 Active 109 DOM
-
2026-06-02days on market $120,000 Active 108 DOM
-
2026-06-01days on market $120,000 Active 107 DOM
-
2026-05-31days on market $120,000 Active 106 DOM
-
2026-02-14$120,000 Active 626-char remark
Show marketing remark (626 chars)
Spacious two-story brick townhome offering 3 bedrooms and 3 full bathrooms across approximately 1,728 square feet. The home includes a dedicated dining area, generously sized bedrooms, a private patio perfect for outdoor relaxation, and assigned parking. Located in an established community in Missouri City, the property provides easy access to major thoroughfares including Highway 6 and the Fort Bend Parkway Toll Road, with nearby shopping and dining options just minutes away. Offered as-is, this home presents a fantastic opportunity for investors or buyers looking to add personal touches and unlock its full potential.
-
2026-01-16historical
-
2026-01-08price $115,000
-
2025-06-29price $125,000
-
2025-06-09price $140,000
-
2025-04-04$150,000 Active
-
2000-01-28soldstatus
-
1998-11-13soldstatus
ⓘ Source: listings_history table (triggers on properties + properties_extension) + one-shot
backfill from property_details.listing_events for pre-trigger history.
Tax reassessment forecast TX · Resets to sale price
- Current annual tax
- $2,364 · $197/mo
- Projected year-2 tax
- $2,364 · $197/mo
- Expected delta
- $0/yr ($0/mo · 0.0%)
ⓘ Screening estimate from a state-policy table — verify with the county assessor before closing.
Climate risk First Street
- Flood 1/10 Low FEMA zone X (unshaded) · 0% chance over 30 yrs
- Wildfire 2/10 Low
- Heat 9/10 Extreme 7 d/yr ≥110°F today · 23 d/yr by 30 yrs out
- Wind 9/10 Extreme 99% chance of damaging wind over 30 yrs
- Air quality 3/10 Moderate 2 unhealthy d/yr today · 3 by 30 yrs out
Nearby sold comps map
Loading sold comps map…
Walkable amenities ~0.75 mi
Loading nearby amenities…
Taxation est. · year 1
- Rental income
- $23,031
- − Mortgage interest
- −$6,722
- − Property taxes
- −$2,364
- − Insurance
- −$600
- − Repairs & maintenance
- −$1,842
- − Management
- −$1,842
- − HOA
- −$2,640
- − Depreciation
- −$3,491
- Taxable income
- $3,529
- Est. tax owed @ 24.0%
- −$847
- After-tax cash flow
- $4,192/yr
For passive investors: Depreciation is non-cash, so a rental often shows a tax loss while cash-flowing — sheltering income. Rental losses are passive: they offset passive income freely, and up to $25,000/yr can offset ordinary (W-2) income if you actively participate and your MAGI is under $100k (phasing out to $0 by $150k); unused losses carry forward. On sale, claimed depreciation is recaptured at up to 25%, and gains may owe capital-gains tax (a 1031 exchange can defer both). Figures are a year-1 estimate at your 24.0% rate — not tax advice; consult a CPA.
Schools (NCES district)
- District
- Fort Bend ISD
- NCES district ID
- 4819650
- Math proficiency
- 44% ▼ -15.00%
- Reading proficiency
- 53% ▼ -4.00%
- Median HH income
- $82,360
- Composite
- 44.61/100
- National rank
- #2779
- State rank
- #140 of 826 in TX
Livability — Houston
- Score
- 74/100
- State rank
- #184
- US rank
- #4771
Category grades
Schools grade is shown separately in the Schools card above.
Census & demographics
- Census place
- Houston, TX
- County
- Fort Bend County · 836,777 people
- City population
- 3,226,434
- Metro
- Houston-The Woodlands-Sugar Land, TX
- Population (ZIP)
- 39,292
- Household income
- $74,689
- Rent vs Own
- Severe rent burden
- 1121.0
Population outlook (Fort Bend County) Hauer SSP2
- Today (2025)
- 1,004,526 people
- By 2030
- 1,153,104 · +14.8%
- By 2040
- 1,453,718 · +44.7%
- By 2050
- 1,753,781 · +74.6%
- By 2075
- 2,455,772 · +144.5%
- By 2100
- 2,930,528 · +191.7%
Race, ethnicity, and origin ACS 2023
- Neighborhood character
- Majority Black (60%)
- Race & ethnicity
- Black 60% Hispanic / Latino 29% Two or more races 13% White 4% Asian 3%
- Hispanic origin (detail)
- Mexican 17%
- Foreign-born
- 16% · Canada, Vietnam
- Languages at home
- 73% English-only · Spanish 22% Vietnamese 1% Other Asian/Pacific 1%
Political lean MEDSL · Fort Bend
- 2024 margin
- Toss-up / Even · D 49.5% · R 47.9% · Other 2.6%
- 2008→2024 swing
- +4.0pp toward D · 2008: -2.4pp · 2024: 1.6pp
- All cycles
- 2024: D+1.6 2020: D+10.6 2016: D+6.6 2012: R+6.8 2008: R+2.4
Not yet ingested
- Civics
- —
Market trends
- HPI YoY
- ▼ -0.55%
- Current HPI
- 288.1306
- Rent YoY
- ▲ 0.34%
- Metro
- Houston-The Woodlands-Sugar Land, TX
- State GDP YoY
- ▲ 3.95%
- F500 in state
- 110
Industry mix (Fortune 500 HQ in TX)
| Industry | F500 HQs | Revenue |
|---|---|---|
| Energy | 16 | $1,198B |
|
||
| Technology | 5 | $198B |
|
||
| Engineering / Construction | 4 | $72B |
|
||
| Energy Services | 3 | $60B |
|
||
| Utilities | 3 | $41B |
|
||
| Healthcare | 2 | $330B |
|
||
Price history
-20.0% since first listed8 events — show timeline
- 2026-02-14 Listed $120,000 HARMLS
- 2026-01-16 Listing Removed — HARMLS
- 2026-01-08 Price Changed $115,000 HARMLS
- 2025-06-29 Price Changed $125,000 HARMLS
- 2025-06-09 Price Changed $140,000 HARMLS
- 2025-04-04 Listed $150,000 HARMLS
- 2000-01-28 Sold (Public Records) — Public Records
- 1998-11-13 Sold (Public Records) — Public Records
Property tax history
+5.3%/yrLatest (2025): $2,364 · +3.5% YoY. Source: county tax records.
Cash-flow waterfall
monthlySold comps — $/sqft
last 12 mo · ≤1 miLoading sold comps…