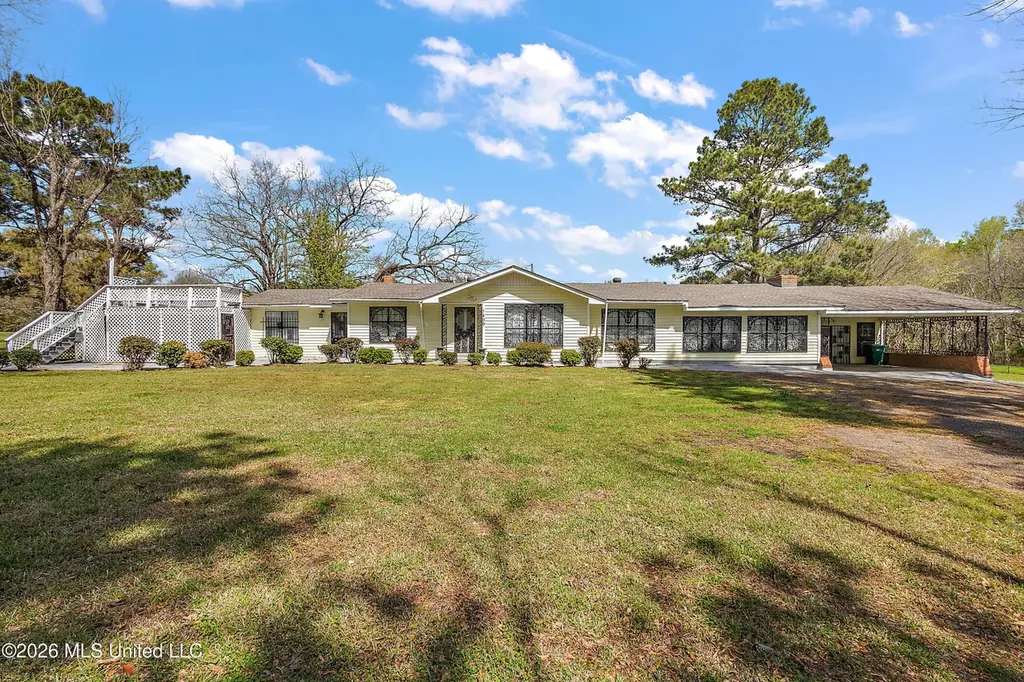
1409 Ross Cir · Clinton, MS
Flood risk 1/10 · Minimal
- FEMA flood zone
- X (unshaded)
- Chance of flooding over 30 yrs
- 0.0%
- Est. flood insurance / yr
- $507 – $1,088
Fire risk 4/10 · Minor
- Est. fire insurance / yr
- $1,241 – $2,305
Heat risk 7/10 · Major
- Hot days now (above 109°F)
- 7 days/yr
- Hot days in 30 yrs
- 20 days/yr
Wind risk 6/10 · Moderate
- Chance of severe wind over 30 yrs
- 76.0%
Air-quality risk 1/10 · Minimal
- Unhealthy air days now
- 0 days/yr
- Unhealthy air days in 30 yrs
- 0 days/yr
Risk factors via First Street. Map © Google.
Why this score? — see what drove the D+ grade
The composite is a weighted blend of 9 inputs, each scored 0–100. Each bar is that input's sub-score; the figure is the points it added to the 100-point composite (weight × sub-score).
- Cash flow +11.0/30.0
- Appreciation +10.0/10.0
- ARV discount +7.5/15.0
- Schools +4.8/10.0
- Livability +3.5/5.0
- DSCR +3.2/10.0
- Rent growth +2.5/5.0
- Condition / age +2.5/5.0
- 1% rule +2.4/10.0
$185,000
🖨 Deal sheet (PDF) 📄 Offer letter ✓ Due diligence
Listing remarks MLS
Tucked away on a full acre in a quiet, established pocket of Jackson, 1409 Ross Circle offers a rare combination of space, privacy, and potential. Featuring 4 bedrooms, 2 bathrooms, and over 2,500 square feet, this home provides the kind of layout and land that's getting harder to find. Whether you're an investor looking for your next project or a buyer ready to customize a home to your vision, this property gives you the foundation to make it happen. Surrounded by a peaceful setting with room to spread out, entertain, or simply enjoy your own space, this home is full of opportunity from the inside out. Being sold as-is, it's priced with potential in mind perfect for those who can see beyond what is and step into what could be. Opportunities like this don't come around often... especially with this much land and square footage.
Key facts
- 1.1 acre lot
- 2 parking spots
- Built 1961
Neighborhood map
What this means for you Summary
Snapshot
- This is a 3-bed/2.0-bath single-family listed at $185k.
Deal economics
- At list price, monthly cash flow is $-78 ($-936/yr) — negative.
- To cash-flow at today's rent, offer at most $171k (7.4% below list).
- To meet the 1% rule (rent ≥ 1% of price), the offer needs to be $138k (25.7% below list).
- Recommended offer: $138k (25.7% below list) — sets the bar for 1% rule.
- Cap rate 5.8% vs local median 4.4% in Clinton — top-decile yield for the area; either an underpriced asset or a hidden risk that comps aren't pricing in. Stress-test before assuming the spread holds.
Location & tenants
- Location reads 69/100 on livability (#49 in MS) — a middle-class / working-renter tenant base. Strengths: crime A+, cost of living A+, housing A+; Watch: amenities F, commute F, health & safety F.
- Clinton Public School District (rural): math 58% / reading 53% proficiency, ranked #4 of 130 in MS (top 3%) — acceptable for families but not a draw, mixed tenant base, ~2y average lease.
- Zoned schools: Northside Elem (math 58% / reading 56%, grade C+, #37 of 375 statewide, top 10%, 728 students, 100% FRL); Clinton Jr Hi School (math 69% / reading 54%, grade B+, #6 of 179 statewide, top 3%, 871 students, 100% FRL); Clinton High School (math 8% / reading 46%, grade F, #107 of 197 statewide, top 54%, 1,226 students, 100% FRL) — zoned schools average 100% FRL vs 38% district-wide (61 pts higher); higher-poverty schools than district average — tighter screening recommended.
- Market conditions: 165 active listings in the ZIP; lower-income renter base — watch delinquency; 167 units permitted in Hinds County in 2024 (0 in 5+ unit buildings).
- At $1,375/mo this rent would consume 45% of the median local household income ($36k/yr) (locally 1627% of renters already pay >50% of income on rent) — very limited rent-growth headroom before tenants either downsize or default.
Forward outlook
- In year one you build about $20k of equity ($1k loan paydown + $18k appreciation (10.0% local appreciation)).
- Hinds County population projected to shrink 6% by 2050 — rents likely to lag national; underwrite the cash flow, not the appreciation.
- At projected returns (10.0% appreciation + 3.0% rent growth), your $52k cash investment doubles in ~3 years — after that, you're playing with house money.
- By year 2, paydown + projected appreciation supports a ~$32k cash-out refi (75% LTV) — recoverable capital for the next deal without selling this one.
Negotiation context
- It's been on market 96 days — a 9% lower offer ($168k) is reasonable based on typical stale-listing flexibility.
Risks & watch-outs
- Climate carrying-cost: major wind risk, 76% chance of damaging wind over 30y; extreme-heat days projected 7→20/yr by 2055 (HVAC capex compounding) — expect insurance premiums to compound above CPI over the hold.
Questions for the listing agent
- What do current leases actually rent for vs. the listed asking? Can we see a recent rent roll and the last 12 months of T-12 income?
- It's been on market 96 days. Have you received any prior offers? Is the seller open to a 26% concession, seller financing, or rate buy-down credit?
- Built in 1961 — when were the roof, HVAC, electrical panel, plumbing, and water heater last replaced?
- Why hasn't it sold? Are there any deal-killer items the seller is aware of (foundation, flood, title, zoning, code violations)?
- Is there a deadline driving the sale (1031 exchange, divorce, estate, relocation)? That informs how much negotiation room exists.
- Schools are B-rated — typically a magnet for longer-tenancy family renters. What's the average tenant stay here, and is there a school-zone premium baked into asking?
- The area grade is low — what's the realistic commute time and amenity access for the typical tenant pool here? Any planned neighborhood developments (good or bad) we should know about?
- What's the average days-on-market for RENTAL listings here right now (not sales)? A rising rental-DOM trend means longer vacancies and softer asking-rent achievability than the comps imply.
- What's the recent tenant-quality profile in this submarket — average credit score on applications, eviction rate, late-payment / NSF rate, and stable-employment percentage? A property-management company in the area should have these aggregated.
- How much new for-sale + rental construction is in the pipeline within 1–3 miles? Heavy new supply typically softens prices + rents 12–24 months out; constrained supply supports both.
Investment metrics
- 1% rule
- 0.74% ✗
- Cap rate
- 5.79%
- Cash-on-cash
- -1.81%
- DSCR
- 0.92
- GRM
- 11.2
CMA / ARV
- ARV (median comp)
- $375,703
- List price
- $185,000
- Delta
- -50.76%
- Verdict
- UNDERPRICED
- Comps
- 6 within 2.0 mi
Projected returns pro-forma
10.0% appreciation · 3.0% rent growth · sell at horizon
- IRR
- 23.0%
- Equity multiple
- 2.85×
- Total profit
- $95,739
- Equity at exit
- $166,663
- IRR
- 20.5%
- Equity multiple
- 6.52×
- Total profit
- $285,743
- Equity at exit
- $359,414
Cash invested: $51,800 (down + closing). Projections, not guarantees.
Landlord ↔ Tenant lean methodology
- Overall (STATE)
- 90 Strongly Landlord-Friendly
- State Mississippi
- 90 Strongly Landlord-Friendly · R+11
- County
- — inherits STATE
- City
- — inherits STATE
ZIP-level market 39209
- Home prices YoY
- 7.7%
- Active inventory
- 165
- Price-to-rent
- 11.2×
Monthly cashflow live
- Estimated rent
- $1,375 medium interval (Pro) →
- Mortgage (P&I)
- −$970
- Tax from tax record
- −$117 /mo · $1,406/yr
- Insurance
- −$77
- HOA
- −$0
- Vacancy / Maint / Mgmt
- −$289
- Net cashflow
- $-78
Break-even live
Sensitivity live
| Price | -10% $27 | -5% $-26 | +0% $-78 | +5% $-130 | +10% $-183 |
|---|---|---|---|---|---|
| Rent | -10% $-187 | -5% $-132 | +0% $-78 | +5% $-24 | +10% $31 |
| Rate | -1.0pp $15 | -0.5pp $-31 | base $-78 | +0.5pp $-126 | +1.0pp $-175 |
UW: 25.0% down · 7.5% · 30yr · 1.5% tax · 5.0% vac · 8.0% maint · 8.0% mgmt
Financing live
Cash to close
- Down payment
- $46,250
- Closing costs
- $5,550
- Reserves months
- —
- Total cash needed
- —
Loan-product check · same deal, 3 products live
Conventional
25% down · 7.5% · 30yr
- Down + closing
- —
- Monthly P&I
- —
- Monthly cashflow
- —
- DSCR
- —
- Eligible?
- —
Personal DTI + credit; lowest rate.
DSCR
20% down · 8.5% · 30yr
- Down + closing
- —
- Monthly P&I
- —
- Monthly cashflow
- —
- DSCR
- —
- Eligible?
- —
No personal income docs; deal must DSCR.
Hard money
10% down · 12.0% · 12mo
- Down + closing
- —
- Monthly P&I
- —
- Monthly cashflow
- —
- DSCR
- —
- Eligible?
- —
Short-term bridge; refi at stabilization.
Listing history 20 events
-
2026-06-21days on market $185,000 Active 96 DOM
-
2026-06-18days on market $185,000 Active 93 DOM
-
2026-06-17days on market $185,000 Active 92 DOM
-
2026-06-16days on market $185,000 Active 91 DOM
-
2026-06-15days on market $185,000 Active 90 DOM
-
2026-06-14days on market $185,000 Active 88 DOM
-
2026-06-13days on market $185,000 Active 87 DOM
-
2026-06-10days on market $185,000 Active 85 DOM
-
2026-06-09days on market $185,000 Active 84 DOM
-
2026-06-08days on market $185,000 Active 83 DOM
-
2026-06-07days on market $185,000 Active 82 DOM
-
2026-06-05days on market $185,000 Active 79 DOM
-
2026-06-03days on market $185,000 Active 78 DOM
-
2026-06-02days on market $185,000 Active 77 DOM
-
2026-06-01days on market $185,000 Active 76 DOM
-
2026-05-31days on market $185,000 Active 75 DOM
-
2026-05-30days on market $185,000 Active 74 DOM
-
2026-03-17$185,000 Active 851-char remark
Show marketing remark (851 chars)
Tucked away on a full acre in a quiet, established pocket of Jackson, 1409 Ross Circle offers a rare combination of space, privacy, and potential. Featuring 4 bedrooms, 2 bathrooms, and over 2,500 square feet, this home provides the kind of layout and land that's getting harder to find. Whether you're an investor looking for your next project or a buyer ready to customize a home to your vision, this property gives you the foundation to make it happen. Surrounded by a peaceful setting with room to spread out, entertain, or simply enjoy your own space, this home is full of opportunity from the inside out. Being sold as-is, it's priced with potential in mind perfect for those who can see beyond what is and step into what could be. Opportunities like this don't come around often... especially with this much land and square footage.
-
2011-12-30soldstatus
-
2009-04-10soldstatus
ⓘ Source: listings_history table (triggers on properties + properties_extension) + one-shot
backfill from property_details.listing_events for pre-trigger history.
Tax reassessment forecast MS · Resets to sale price
- Current annual tax
- $1,406 · $117/mo
- Projected year-2 tax
- $1,462 · $122/mo
- Expected delta
- +$55/yr (+$5/mo · 3.9%)
ⓘ Screening estimate from a state-policy table — verify with the county assessor before closing.
Climate risk First Street
- Flood 1/10 Low FEMA zone X (unshaded) · 0% chance over 30 yrs
- Wildfire 4/10 Moderate
- Heat 7/10 Severe 7 d/yr ≥109°F today · 20 d/yr by 30 yrs out
- Wind 6/10 Major 76% chance of damaging wind over 30 yrs
- Air quality 1/10 Low 0 unhealthy d/yr today · 0 by 30 yrs out
Nearby sold comps map
Loading sold comps map…
Walkable amenities ~0.75 mi
Loading nearby amenities…
Taxation est. · year 1
- Rental income
- $16,503
- − Mortgage interest
- −$10,363
- − Property taxes
- −$1,406
- − Insurance
- −$925
- − Repairs & maintenance
- −$1,320
- − Management
- −$1,320
- − Depreciation
- −$5,382
- Taxable loss
- −$4,214
- Est. tax savings @ 24.0%
- +$1,011
- After-tax cash flow
- $75/yr
For passive investors: Depreciation is non-cash, so a rental often shows a tax loss while cash-flowing — sheltering income. Rental losses are passive: they offset passive income freely, and up to $25,000/yr can offset ordinary (W-2) income if you actively participate and your MAGI is under $100k (phasing out to $0 by $150k); unused losses carry forward. On sale, claimed depreciation is recaptured at up to 25%, and gains may owe capital-gains tax (a 1031 exchange can defer both). Figures are a year-1 estimate at your 24.0% rate — not tax advice; consult a CPA.
Schools (NCES district)
- District
- Clinton Public School District
- NCES district ID
- 2801090
- Math proficiency
- 58% ▼ -9.00%
- Reading proficiency
- 53% ▼ -7.00%
- Median HH income
- $55,993
- Composite
- 47.95/100
- National rank
- #2205
- State rank
- #4 of 130 in MS
Livability — Clinton
- Score
- 69/100
- State rank
- #49
- US rank
- #8341
Category grades
Schools grade is shown separately in the Schools card above.
Census & demographics
- County
- Hinds County · 167,040 people
- City population
- 140,204
- Metro
- Jackson, MS
- Population (ZIP)
- 25,776
- Household income
- $36,344
- Rent vs Own
- Severe rent burden
- 1627.0
Population outlook (Hinds County) Hauer SSP2
- Today (2025)
- 242,528 people
- By 2030
- 241,113 · -0.6%
- By 2040
- 235,557 · -2.9%
- By 2050
- 226,946 · -6.4%
- By 2075
- 199,995 · -17.5%
- By 2100
- 164,165 · -32.3%
Race, ethnicity, and origin ACS 2023
- Neighborhood character
- Predominantly Black (90%)
- Race & ethnicity
- Black 90% White 7% Two or more races 2% Hispanic / Latino 1%
- Foreign-born
- 1% · Canada
- Languages at home
- 98% English-only · Spanish 2%
Political lean MEDSL · Hinds
- 2024 margin
- Solid D (+46.1) · D 72.4% · R 26.3% · Other 1.4%
- 2008→2024 swing
- +7.1pp toward D · 2008: 39.0pp · 2024: 46.1pp
- All cycles
- 2024: D+46.1 2020: D+48.3 2016: D+43.7 2012: D+45.1 2008: D+39.0
Not yet ingested
- Civics
- —
Market trends
- HPI YoY
- ▲ 22.28%
- Current HPI
- 312.6754
- Rent YoY
- —
- Metro
- Jackson, MS
- State GDP YoY
- —
- F500 in state
- 0
Price history
3 events — show timeline
- 2026-03-17 Listed $185,000 MLSU
- 2011-12-30 Sold (Public Records) — Public Records
- 2009-04-10 Sold (Public Records) — Public Records
Property tax history
+123.8%/yrLatest (2025): $1,406 · +3.8% YoY. Source: county tax records.
Cash-flow waterfall
monthlySold comps — $/sqft
last 12 mo · ≤1 miLoading sold comps…