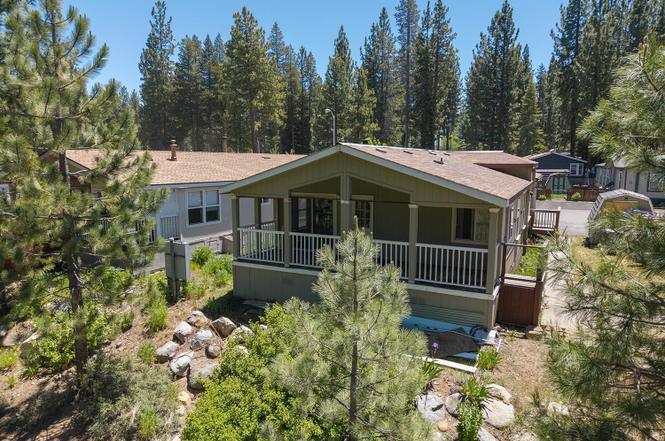
10100 Pioneer Trl #100 · Truckee, CA
Flood risk 1/10 · Minimal
- FEMA flood zone
- X (unshaded)
- Chance of flooding over 30 yrs
- 0.0%
- Est. flood insurance / yr
- $507 – $1,088
Fire risk 7/10 · Major
- Est. fire insurance / yr
- $659 – $1,223
Heat risk 2/10 · Minimal
- Hot days now (above 87°F)
- 9 days/yr
- Hot days in 30 yrs
- 24 days/yr
Wind risk 1/10 · Minimal
- Chance of severe wind over 30 yrs
- —
Air-quality risk 8/10 · Major
- Unhealthy air days now
- 16 days/yr
- Unhealthy air days in 30 yrs
- 18 days/yr
Risk factors via First Street. Map © Google.
Why this score? — see what drove the B+ grade
The composite is a weighted blend of 9 inputs, each scored 0–100. Each bar is that input's sub-score; the figure is the points it added to the 100-point composite (weight × sub-score).
- Cash flow +30.0/30.0
- ARV discount +12.2/15.0
- 1% rule +10.0/10.0
- DSCR +10.0/10.0
- Schools +4.4/10.0
- Rent growth +4.1/5.0
- Livability +2.9/5.0
- Condition / age +2.5/5.0
- Appreciation +0.0/10.0
$280,000
🖨 Deal sheet 📄 Offer letter ✓ Due diligence
Listing remarks MLS
Centrally located in Truckee for easy access to all ski resorts and mountain recreation. Lots of newer upgrades (exterior paint, hot water heater and flooring), built in entertainment center, in floor radiant heat, soaking tub and two sinks in master bath. 4th bedroom may be used for an office as it has double doors and opens into the livingroom. Back porch is enclosed and there is a nice meadow behind this lovely home.
Key facts
- Large deck
- Premium homesite
- Open space
Tags
Property features AI
Finance
- HOA & community: Association amenities include exercise equipment and additional community features; Has an association; Not gated
Exterior
- Parking: Parking pad; No garage
- Utilities: Propane service; Water from utility district; Sewer to utility district
- Home design: Manufactured / Mobile Home; One level; Level topography; Street-front lot; Trees/Woods view; Property described as used and fixer
- Construction: Shake/Shingle roof; Other construction materials
- Exterior features: Outbuilding; Deck
Interior
- Flooring: Vinyl flooring
- Bathrooms: 2 full bathrooms
- Heating & cooling: Electric heating; In-floor heating
- Interior features: Accessible entrance; Family room; Woodstove in the living room
- Laundry & utility: Laundry room; Washer, Dryer
Neighborhood map
What this means for you Summary
Snapshot
- This is a 3-bed/2.0-bath manufactured listed at $280k.
Deal economics
- At list price, monthly cash flow is $3k ($30k/yr) — positive.
- The deal already cash-flows at list — no discount required.
- Meets the 1% rule at list price ($5k rent vs $280k).
- Cap rate 17.1% vs local median 2.0% in Truckee — top-decile yield for the area; either an underpriced asset or a hidden risk that comps aren't pricing in. Stress-test before assuming the spread holds.
Location & tenants
- Location reads 58/100 on livability (#697 in CA) — a working-class tenant base; expect higher turnover. Strengths: employment A+, housing B; Watch: amenities F, commute F, cost of living F.
- Tahoe-Truckee Unified (town): math 44% / reading 56% proficiency, ranked #136 of 517 in CA (top 26%) — acceptable for families but not a draw, mixed tenant base, ~2y average lease.
- Market conditions: Rents rising fast (+6.6%/yr); 375 active listings in the ZIP; 2 comparable units currently listed for rent nearby; high-income renter base; 215 units permitted in Nevada County in 2024 (0 in 5+ unit buildings).
- At $5,304/mo this rent would consume 48% of the median local household income ($132k/yr) (locally 559% of renters already pay >50% of income on rent) — very limited rent-growth headroom before tenants either downsize or default.
Forward outlook
- Local home prices are declining (-3.0%/yr); year-one equity from $2k of loan paydown is wiped out by about $8k of value loss. Plan a longer hold.
- Nevada County population projected at -14% by 2050 — secular population decline; favor cash flow + early exit over multi-decade hold.
- At projected returns (-3.0% appreciation + 6.6% rent growth), your $78k cash investment doubles in ~3 years — after that, you're playing with house money.
Negotiation context
- Only 7 days on market — expect competitive offers; lowballing is unlikely to land.
- 3 sale attempts since 17y ago with the ask held roughly flat each time — persistent listings suggest the price (not the market) is what's stuck; bring a comps-based counter.
- Current owner paid $75k; list at $280k implies a 273% gain — meaningful room to come down on a strong offer.
Risks & watch-outs
- Climate carrying-cost: major wildfire risk — expect insurance premiums to compound above CPI over the hold.
Questions for the listing agent
- Is there a deadline driving the sale (1031 exchange, divorce, estate, relocation)? That informs how much negotiation room exists.
- What's the average days-on-market for RENTAL listings here right now (not sales)? A rising rental-DOM trend means longer vacancies and softer asking-rent achievability than the comps imply.
- What's the recent tenant-quality profile in this submarket — average credit score on applications, eviction rate, late-payment / NSF rate, and stable-employment percentage? A property-management company in the area should have these aggregated.
- How much new for-sale + rental construction is in the pipeline within 1–3 miles? Heavy new supply typically softens prices + rents 12–24 months out; constrained supply supports both.
Investment metrics
- 1% rule
- 1.89% ✓
- Cap rate
- 17.14%
- Cash-on-cash
- 38.72%
- DSCR
- 2.72
- GRM
- 4.4
CMA / ARV
- ARV (on-the-fly)
- $312,654
- Comps found
- 5
Show comp detail 5 sales within ~0.75 mi
| Address | Dist | Beds/Ba | Sqft | Sold | Price | $/sf | Match |
|---|---|---|---|---|---|---|---|
| 10100 Pioneer Trl #101 | 0.01mi | 3/2.0 | 1,350 (-8%) | 1mo | $359,000 | $266 | 86 |
| 10100 Pioneer Trl #1 | 0.10mi | 3/2.0 | 1,404 (-4%) | 8mo | $300,000 | $214 | 82 |
| 10100 Pioneer Trl #42 | 0.07mi | 3/2.0 | 1,560 (+7%) | 10mo | $284,000 | $182 | 77 |
| 10100 Pioneer Trl #13 | 0.12mi | 3/2.0 | 1,328 (-9%) | 17mo | $310,000 | $233 | 65 |
| 10100 Pioneer Trl #52 | 0.07mi | 3/2.0 | 1,258 (-14%) | 15mo | $265,000 | $211 | 61 |
Match score weights: distance 35% · size 25% · config 20% · recency 20%. Top-matched comps best support the ARV.
Projected returns pro-forma
-3.0% appreciation · 6.59% rent growth · sell at horizon
- IRR
- 38.6%
- Equity multiple
- 2.73×
- Total profit
- $135,513
- Equity at exit
- $41,749
- IRR
- 46.8%
- Equity multiple
- 6.27×
- Total profit
- $412,809
- Equity at exit
- $24,209
Cash invested: $78,400 (down + closing). Projections, not guarantees.
Landlord ↔ Tenant lean methodology
- Overall (STATE)
- 18 Strongly Tenant-Friendly
- State California
- 18 Strongly Tenant-Friendly · D+13
- County
- — inherits STATE
- City
- — inherits STATE
ZIP-level market 96161
- Rents YoY
- 6.6%
- Active inventory
- 375
- Price-to-rent
- 4.4×
Monthly cashflow live
- Estimated rent
- $5,304 medium interval (Pro) →
- Mortgage (P&I)
- −$1,468
- Tax from tax record
- −$75 /mo · $899/yr
- Insurance
- −$117
- HOA
- −$0
- Vacancy / Maint / Mgmt
- −$1,114
- Net cashflow
- $2,530
Break-even live
UW: 25.0% down · 7.5% · 30yr · 1.5% tax · 5.0% vac · 8.0% maint · 8.0% mgmt
Financing live
Cash to close
- Down payment
- $70,000
- Closing costs
- $8,400
- Reserves months
- —
- Total cash needed
- —
Loan-product check · same deal, 3 products live
Conventional
25% down · 7.5% · 30yr
- Down + closing
- —
- Monthly P&I
- —
- Monthly cashflow
- —
- DSCR
- —
- Eligible?
- —
Personal DTI + credit; lowest rate.
DSCR
20% down · 8.5% · 30yr
- Down + closing
- —
- Monthly P&I
- —
- Monthly cashflow
- —
- DSCR
- —
- Eligible?
- —
No personal income docs; deal must DSCR.
Hard money
10% down · 12.0% · 12mo
- Down + closing
- —
- Monthly P&I
- —
- Monthly cashflow
- —
- DSCR
- —
- Eligible?
- —
Short-term bridge; refi at stabilization.
Rent comps 2 comps
| Address | Beds | Baths | Sqft | Rent | $/sqft | DOM | Units | Dist |
|---|---|---|---|---|---|---|---|---|
| 10085 Nicolas Dr Unit A Truckee, CA | 3.0 | 2.5 | 1871 | $5,500 | $2.94 | 43d | 1 | 0.94mi |
| 10192 Schaffer Dr Truckee, CA | 3.0 | 2.5 | 1532 | $4,495 | $2.93 | 43d | 1 | 1.06mi |
Listing history 6 events
-
2026-06-18days on market $280,000 Active 7 DOM
-
2026-06-17days on market $280,000 Active 6 DOM
-
2026-06-16days on market $280,000 Active 5 DOM
-
2026-06-15days on market $280,000 Active 4 DOM
-
2026-06-14remarks 699-char remark
-
2026-06-14$280,000 Active 2 DOM
ⓘ Source: listings_history table (triggers on properties + properties_extension) + one-shot
backfill from property_details.listing_events for pre-trigger history.
Tax reassessment forecast CA · Resets to sale price
- Current annual tax
- $899 · $75/mo
- Projected year-2 tax
- $2,128 · $177/mo
- Expected delta
- +$1,229/yr (+$102/mo · 136.8%)
ⓘ Screening estimate from a state-policy table — verify with the county assessor before closing.
Climate risk First Street
- Flood 1/10 Low FEMA zone X (unshaded) · 0% chance over 30 yrs
- Wildfire 7/10 Severe
- Heat 2/10 Low 9 d/yr ≥87°F today · 24 d/yr by 30 yrs out
- Wind 1/10 Low
- Air quality 8/10 Severe 16 unhealthy d/yr today · 18 by 30 yrs out
Nearby sold comps map
Loading sold comps map…
Walkable amenities ~0.75 mi
Loading nearby amenities…
Taxation est. · year 1
- Rental income
- $63,642
- − Mortgage interest
- −$15,684
- − Property taxes
- −$899
- − Insurance
- −$1,400
- − Repairs & maintenance
- −$5,091
- − Management
- −$5,091
- − Depreciation
- −$8,145
- Taxable income
- $27,331
- Est. tax owed @ 24.0%
- −$6,559
- After-tax cash flow
- $23,799/yr
For passive investors: Depreciation is non-cash, so a rental often shows a tax loss while cash-flowing — sheltering income. Rental losses are passive: they offset passive income freely, and up to $25,000/yr can offset ordinary (W-2) income if you actively participate and your MAGI is under $100k (phasing out to $0 by $150k); unused losses carry forward. On sale, claimed depreciation is recaptured at up to 25%, and gains may owe capital-gains tax (a 1031 exchange can defer both). Figures are a year-1 estimate at your 24.0% rate — not tax advice; consult a CPA.
Schools (NCES district)
- District
- Tahoe-Truckee Unified
- NCES district ID
- 0638770
- Math proficiency
- 44% ▼ -9.00%
- Reading proficiency
- 56% ▼ -4.00%
- Median HH income
- $67,136
- Composite
- 44.38/100
- National rank
- #2816
- State rank
- #136 of 517 in CA
Livability — Truckee
- Score
- 58/100
- State rank
- #697
- US rank
- #21110
Category grades
Schools grade is shown separately in the Schools card above.
Census & demographics
- Census place
- Truckee, CA
- County
- Nevada County · 85,339 people
- City population
- 19,634
- Metro
- Truckee-Grass Valley, CA
- Population (ZIP)
- 19,634
- Household income
- $131,702
- Rent vs Own
- Severe rent burden
- 559.0
Population outlook (Nevada County) Hauer SSP2
- Today (2025)
- 98,490 people
- By 2030
- 97,295 · -1.2%
- By 2040
- 92,041 · -6.5%
- By 2050
- 85,164 · -13.5%
- By 2075
- 68,436 · -30.5%
- By 2100
- 49,536 · -49.7%
Race, ethnicity, and origin ACS 2023
- Neighborhood character
- Predominantly White (81%)
- Race & ethnicity
- White 81% Hispanic / Latino 12% Two or more races 11% Asian 2%
- Hispanic origin (detail)
- Mexican 7%
- Common ancestry
- Italian 5% Lithuanian 4% Portuguese 3%
- Foreign-born
- 10% · Canada, Jamaica, Dominican Republic
- Languages at home
- 85% English-only · Spanish 10% French/Haitian/Cajun 1% Other Indo-European 1%
Political lean MEDSL · Nevada
- 2024 margin
- D (+12.2) · D 54.4% · R 42.1% · Other 3.5%
- 2008→2024 swing
- +6.9pp toward D · 2008: 5.3pp · 2024: 12.2pp
- All cycles
- 2024: D+12.2 2020: D+14.8 2016: D+4.5 2012: R+4.7 2008: D+5.3
Not yet ingested
- Civics
- —
Market trends
- HPI YoY
- ▼ -307.87%
- Current HPI
- 336.9632
- Rent YoY
- ▲ 6.59%
- Metro
- Truckee-Grass Valley, CA
- State GDP YoY
- ▲ 3.21%
- F500 in state
- 116
Industry mix (Fortune 500 HQ in CA)
| Industry | F500 HQs | Revenue |
|---|---|---|
| Technology | 27 | $1,492B |
|
||
| Financial Services | 3 | $174B |
|
||
| Retail | 3 | $44B |
|
||
| Insurance | 3 | $26B |
|
||
| Media / Entertainment | 2 | $115B |
|
||
| Pharmaceuticals / Biotech | 2 | $62B |
|
||
Price history
+211.1% since first listed7 events — show timeline
- 2026-06-11 Listed $280,000 TSMLS
- 2018-10-25 Sold (MLS) $75,000 TSMLS
- 2014-01-03 Delisted — TSMLS
- 2013-12-21 Listed $88,000 TSMLS
- 2009-08-03 Sold (MLS) $80,000 TSMLS
- 2009-05-20 Delisted — TSMLS
- 2009-05-20 Listed $90,000 TSMLS
Property tax history
+4.5%/yrLatest (2025): $899 · +4.4% YoY. Source: county tax records.
Cash-flow waterfall
monthlySold comps — $/sqft
last 12 mo · ≤1 miLoading sold comps…