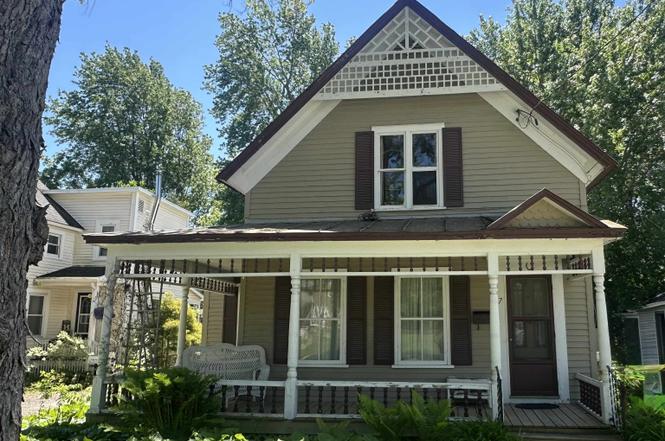
7 Cottage St · Potsdam, NY
Flood risk 1/10 · Minimal
- FEMA flood zone
- X
- Chance of flooding over 30 yrs
- 0.0%
- Est. flood insurance / yr
- $473 – $860
Fire risk 3/10 · Minor
- Est. fire insurance / yr
- $691 – $1,283
Heat risk 2/10 · Minimal
- Hot days now (above 92°F)
- 7 days/yr
- Hot days in 30 yrs
- 15 days/yr
Wind risk 1/10 · Minimal
- Chance of severe wind over 30 yrs
- —
Air-quality risk 1/10 · Minimal
- Unhealthy air days now
- 0 days/yr
- Unhealthy air days in 30 yrs
- 0 days/yr
Risk factors via First Street. Map © Google.
Why this score? — see what drove the D+ grade
The composite is a weighted blend of 9 inputs, each scored 0–100. Each bar is that input's sub-score; the figure is the points it added to the 100-point composite (weight × sub-score).
- Appreciation +10.0/10.0
- Cash flow +8.0/30.0
- ARV discount +8.0/15.0
- Schools +5.0/10.0
- 1% rule +4.5/10.0
- Livability +3.8/5.0
- Rent growth +2.5/5.0
- Condition / age +2.5/5.0
- DSCR +2.0/10.0
$152,000
🖨 Deal sheet 📄 Offer letter ✓ Due diligence
Listing remarks MLS
Four bedroom 2 story village of Potsdam home (or could be a two unit with some modifications). Fenced in large back yard with many perennials. Mostly new windows, new wiring, newer roof (back portion). Spacious living room, maple cabinetry in the kitchen with a pantry, woodstove is also in the kitchen, enclosed back porch, dining room, and full bath complete the first floor. Second floor has 4 bedrooms and a full bath. The current owners have done many updates: Total house rewire, new hardwood floors in two of the bedrooms and the hallway, replaced bathroom vanities, new flooring in upstairs bath, new kitchen appliances, replaced back steps off of porch, new ceiling fans and light fixtures, new faucets, shed in backyard, gutters on back of the house, some new plumbing and additional supports in the basement, and more. Walking distance to school, hospital, post office, library, groceries, etc. Call today for a showing.
Key facts
- Large windows
- Wood stove
- Vaulted ceiling
Tags
Property features AI
Exterior
- Parking: Gravel parking
- Utilities: Public water; Public sewer; Cable available; Natural gas available
- Home design: Residential property; 2 stories
- Construction: Wood siding; Metal roof
- Exterior features: Covered porch/patio; Fenced yard with wood fencing; Irregular-shaped lot
Interior
- Kitchen: Electric cooktop; Refrigerator
- Flooring: Ceramic tile; Tile; Vinyl; Wood
- Bathrooms: 2 full bathrooms
- Heating & cooling: Forced air heating; Natural gas available
- Interior features: Pantry; Vaulted ceilings; Eat-in kitchen
- Laundry & utility: Washer and dryer (main level)
Neighborhood map
What this means for you Summary
Snapshot
- This is a 4-bed/2.0-bath single-family listed at $152k.
Deal economics
- At list price, monthly cash flow is $-158 ($-2k/yr) — negative.
- To cash-flow at today's rent, offer at most $124k (18.3% below list).
- To meet the 1% rule (rent ≥ 1% of price), the offer needs to be $144k (5.3% below list).
- Recommended offer: $124k (18.3% below list) — sets the bar for cash-flow.
Location & tenants
- Location reads 75/100 on livability (#249 in NY, #3,908 nationally) — a middle-class / working-renter tenant base. Strengths: amenities A+, cost of living A+, health & safety A+; Watch: crime F, commute F, employment F.
- Potsdam Central School District (town): math 53% / reading 66% proficiency, ranked #258 of 590 in NY (top 44%) — acceptable for families but not a draw, mixed tenant base, ~2y average lease.
- Market conditions: 117 active listings in the ZIP; 215 units permitted in St. Lawrence County in 2024 (0 in 5+ unit buildings).
Forward outlook
- In year one you build about $16k of equity ($1k loan paydown + $15k appreciation (10.0% local appreciation)).
- St. Lawrence County population projected at -14% by 2050 — secular population decline; favor cash flow + early exit over multi-decade hold.
- By year 3, paydown + projected appreciation supports a ~$41k cash-out refi (75% LTV) — recoverable capital for the next deal without selling this one.
Negotiation context
- Only 3 days on market — expect competitive offers; lowballing is unlikely to land.
- 2 sale attempts since 3y ago with the ask held roughly flat each time — persistent listings suggest the price (not the market) is what's stuck; bring a comps-based counter.
Risks & watch-outs
- Watch-outs: property tax is 3.4% of price; built in 1800 — expect roof / HVAC / electrical / plumbing capex.
Questions for the listing agent
- What do current leases actually rent for vs. the listed asking? Can we see a recent rent roll and the last 12 months of T-12 income?
- Built in 1800 — when were the roof, HVAC, electrical panel, plumbing, and water heater last replaced?
- Property tax is high relative to price — has the assessment been appealed recently, and will the sale trigger a re-assessment?
- Is there a deadline driving the sale (1031 exchange, divorce, estate, relocation)? That informs how much negotiation room exists.
- Schools are A-rated — typically a magnet for longer-tenancy family renters. What's the average tenant stay here, and is there a school-zone premium baked into asking?
- Crime grade is F in this area — have there been break-ins, vandalism, or insurance claims at this property in the last 3 years? What carrier currently insures it and at what premium?
- The area grade is low — what's the realistic commute time and amenity access for the typical tenant pool here? Any planned neighborhood developments (good or bad) we should know about?
- What's the average days-on-market for RENTAL listings here right now (not sales)? A rising rental-DOM trend means longer vacancies and softer asking-rent achievability than the comps imply.
- What's the recent tenant-quality profile in this submarket — average credit score on applications, eviction rate, late-payment / NSF rate, and stable-employment percentage? A property-management company in the area should have these aggregated.
- How much new for-sale + rental construction is in the pipeline within 1–3 miles? Heavy new supply typically softens prices + rents 12–24 months out; constrained supply supports both.
Investment metrics
- 1% rule
- 0.95% ✗
- Cap rate
- 5.05%
- Cash-on-cash
- -4.44%
- DSCR
- 0.80
- GRM
- 8.8
CMA / ARV
- ARV (on-the-fly)
- $153,784
- Comps found
- 10
Show comp detail 10 sales within ~0.75 mi
| Address | Dist | Beds/Ba | Sqft | Sold | Price | $/sf | Match |
|---|---|---|---|---|---|---|---|
| 109 Market St | 0.09mi | 3/2.0 (-1) | 1,790 (+9%) | 2mo | $140,000 | $78 | 74 |
| 14 Broad St | 0.29mi | 3/1.5 (-1) | 1,624 (-1%) | 7mo | $152,000 | $94 | 73 |
| 6 Somerset Rd | 0.23mi | 3/2.0 (-1) | 1,800 (+10%) | 10mo | $238,000 | $132 | 59 |
| 32 Larnard St | 0.30mi | 4/1.0 | 1,472 (-10%) | 12mo | $120,000 | $82 | 55 |
| 7811 Ush 11 | 0.47mi | 3/1.0 (-1) | 1,494 (-9%) | 4mo | $147,000 | $98 | 51 |
| 2 Berkley Dr | 0.27mi | 3/1.0 (-1) | 1,845 (+13%) | 20mo | $150,000 | $81 | 40 |
| 18 Cedar St | 0.72mi | 4/2.0 | 1,825 (+12%) | 11mo | $215,000 | $118 | 38 |
| 9 Mechanic St | 0.59mi | 3/2.0 (-1) | 1,792 (+10%) | 19mo | $240,000 | $134 | 36 |
| 31 Lawrence Ave | 0.50mi | 3/2.0 (-1) | 1,411 (-14%) | 19mo | $84,000 | $60 | 33 |
| 20 Bay St | 0.65mi | 3/2.0 (-1) | 1,859 (+14%) | 22mo | $150,050 | $81 | 24 |
Match score weights: distance 35% · size 25% · config 20% · recency 20%. Top-matched comps best support the ARV.
Projected returns pro-forma
10.0% appreciation · 3.0% rent growth · sell at horizon
- IRR
- 21.2%
- Equity multiple
- 2.71×
- Total profit
- $72,916
- Equity at exit
- $136,934
- IRR
- 19.2%
- Equity multiple
- 6.24×
- Total profit
- $222,962
- Equity at exit
- $295,303
Cash invested: $42,560 (down + closing). Projections, not guarantees.
Landlord ↔ Tenant lean methodology
- Overall (STATE)
- 15 Strongly Tenant-Friendly
- State New York
- 15 Strongly Tenant-Friendly · D+10
- County
- — inherits STATE
- City
- — inherits STATE
ZIP-level market 13676
- Home prices YoY
- 17.7%
- Active inventory
- 117
- Price-to-rent
- 8.8×
Monthly cashflow live
- Estimated rent
- $1,439 medium interval (Pro) →
- Mortgage (P&I)
- −$797
- Tax from tax record
- −$434 /mo · $5,211/yr
- Insurance
- −$63
- HOA
- −$0
- Vacancy / Maint / Mgmt
- −$302
- Net cashflow
- $-158
Break-even live
UW: 25.0% down · 7.5% · 30yr · 1.5% tax · 5.0% vac · 8.0% maint · 8.0% mgmt
Financing live
Cash to close
- Down payment
- $38,000
- Closing costs
- $4,560
- Reserves months
- —
- Total cash needed
- —
Loan-product check · same deal, 3 products live
Conventional
25% down · 7.5% · 30yr
- Down + closing
- —
- Monthly P&I
- —
- Monthly cashflow
- —
- DSCR
- —
- Eligible?
- —
Personal DTI + credit; lowest rate.
DSCR
20% down · 8.5% · 30yr
- Down + closing
- —
- Monthly P&I
- —
- Monthly cashflow
- —
- DSCR
- —
- Eligible?
- —
No personal income docs; deal must DSCR.
Hard money
10% down · 12.0% · 12mo
- Down + closing
- —
- Monthly P&I
- —
- Monthly cashflow
- —
- DSCR
- —
- Eligible?
- —
Short-term bridge; refi at stabilization.
Listing history 4 events
-
2026-06-18days on market $152,000 Active 3 DOM
-
2026-06-17days on market $152,000 Active 2 DOM
-
2026-06-16remarks 699-char remark
-
2026-06-16$152,000 Active 1 DOM
ⓘ Source: listings_history table (triggers on properties + properties_extension) + one-shot
backfill from property_details.listing_events for pre-trigger history.
Tax reassessment forecast NY · Partial reset (capped growth)
- Current annual tax
- $5,211 · $434/mo
- Projected year-2 tax
- $5,211 · $434/mo
- Expected delta
- $0/yr ($0/mo · 0.0%)
ⓘ Screening estimate from a state-policy table — verify with the county assessor before closing.
Climate risk First Street
- Flood 1/10 Low FEMA zone X · 0% chance over 30 yrs
- Wildfire 3/10 Moderate
- Heat 2/10 Low 7 d/yr ≥92°F today · 15 d/yr by 30 yrs out
- Wind 1/10 Low
- Air quality 1/10 Low 0 unhealthy d/yr today · 0 by 30 yrs out
Nearby sold comps map
Loading sold comps map…
Walkable amenities ~0.75 mi
Loading nearby amenities…
Taxation est. · year 1
- Rental income
- $17,272
- − Mortgage interest
- −$8,514
- − Property taxes
- −$5,211
- − Insurance
- −$760
- − Repairs & maintenance
- −$1,382
- − Management
- −$1,382
- − Depreciation
- −$4,422
- Taxable loss
- −$4,399
- Est. tax savings @ 24.0%
- +$1,056
- After-tax cash flow
- $-836/yr
For passive investors: Depreciation is non-cash, so a rental often shows a tax loss while cash-flowing — sheltering income. Rental losses are passive: they offset passive income freely, and up to $25,000/yr can offset ordinary (W-2) income if you actively participate and your MAGI is under $100k (phasing out to $0 by $150k); unused losses carry forward. On sale, claimed depreciation is recaptured at up to 25%, and gains may owe capital-gains tax (a 1031 exchange can defer both). Figures are a year-1 estimate at your 24.0% rate — not tax advice; consult a CPA.
Schools (NCES district)
- District
- Potsdam Central School District
- NCES district ID
- 3623670
- Math proficiency
- 53% ▼ -2.00%
- Reading proficiency
- 66% ▲ 12.00%
- Median HH income
- $44,144
- Composite
- 50.05/100
- National rank
- #1915
- State rank
- #258 of 590 in NY
Livability — Potsdam
- Score
- 75/100
- State rank
- #249
- US rank
- #3908
Category grades
Schools grade is shown separately in the Schools card above.
Census & demographics
- Census place
- Potsdam, NY
- City population
- 2,123
- Population (ZIP)
- 13,408
Population outlook (St. Lawrence County) Hauer SSP2
- Today (2025)
- 110,027 people
- By 2030
- 107,455 · -2.3%
- By 2040
- 100,492 · -8.7%
- By 2050
- 94,254 · -14.3%
- By 2075
- 80,175 · -27.1%
- By 2100
- 63,140 · -42.6%
Race, ethnicity, and origin ACS 2023
- Neighborhood character
- Predominantly White (90%)
- Race & ethnicity
- White 90% Two or more races 4% Asian 3% Hispanic / Latino 2% Black 2%
- Common ancestry
- Lithuanian 6% Romanian 4% Iranian 2%
- Foreign-born
- 7% · Canada, China
- Languages at home
- 94% English-only · Spanish 2% Other Indo-European 1% French/Haitian/Cajun 1%
Political lean MEDSL · St. Lawrence
- 2024 margin
- R (+18.0) · D 41.0% · R 59.0%
- 2008→2024 swing
- -34.3pp toward R · 2008: 16.3pp · 2024: -18.0pp
- All cycles
- 2024: R+18.0 2020: R+11.7 2016: R+10.8 2012: D+16.6 2008: D+16.3
Not yet ingested
- Civics
- —
Market trends
- HPI YoY
- ▲ 48.01%
- Current HPI
- 318.7704
- Rent YoY
- —
- Metro
- —
- State GDP YoY
- ▲ 2.60%
- F500 in state
- 92
Industry mix (Fortune 500 HQ in NY)
| Industry | F500 HQs | Revenue |
|---|---|---|
| Financial Services | 10 | $950B |
|
||
| Consumer Goods | 9 | $162B |
|
||
| Insurance | 4 | $225B |
|
||
| Telecommunications | 2 | $144B |
|
||
| Pharmaceuticals | 2 | $112B |
|
||
| Media / Entertainment | 2 | $69B |
|
||
Price history
+49.0% since first listed9 events — show timeline
- 2026-06-16 Listed $152,000 SLCMLS
- 2024-03-07 Sold (Public Records) $140,000 Public Records
- 2024-03-07 Sold (MLS) $140,000 SLCMLS
- 2024-01-30 Pending — SLCMLS
- 2024-01-22 Price Changed $140,000 SLCMLS
- 2023-10-30 Price Changed $150,000 SLCMLS
- 2023-09-17 Price Changed $155,000 SLCMLS
- 2023-07-24 Listed $162,500 SLCMLS
- 2017-06-06 Sold (Public Records) $102,000 Public Records
Property tax history
+3.7%/yrLatest (2025): $5,211 · +4.2% YoY. Source: county tax records.
Cash-flow waterfall
monthlySold comps — $/sqft
last 12 mo · ≤1 miLoading sold comps…