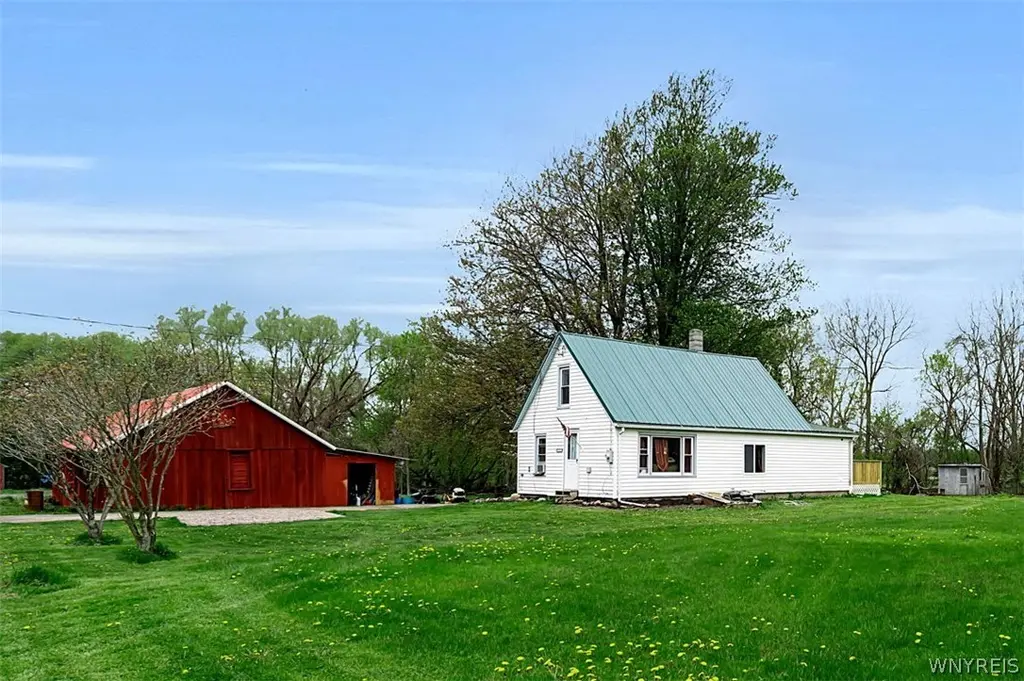
15155 White City Rd · Elba, NY
Flood risk 1/10 · Minimal
- FEMA flood zone
- —
- Chance of flooding over 30 yrs
- 0.0%
- Est. flood insurance / yr
- —
Fire risk 1/10 · Minimal
- Est. fire insurance / yr
- $691 – $1,283
Heat risk 2/10 · Minimal
- Hot days now (above 96°F)
- 7 days/yr
- Hot days in 30 yrs
- 15 days/yr
Wind risk 1/10 · Minimal
- Chance of severe wind over 30 yrs
- —
Air-quality risk 2/10 · Minimal
- Unhealthy air days now
- 1 days/yr
- Unhealthy air days in 30 yrs
- 2 days/yr
Risk factors via First Street. Map © Google.
Why this score? — see what drove the D grade
The composite is a weighted blend of 9 inputs, each scored 0–100. Each bar is that input's sub-score; the figure is the points it added to the 100-point composite (weight × sub-score).
- Cash flow +14.7/30.0
- ARV discount +8.9/15.0
- DSCR +4.5/10.0
- Schools +3.7/10.0
- 1% rule +3.3/10.0
- Livability +3.1/5.0
- Rent growth +2.5/5.0
- Condition / age +2.5/5.0
- Appreciation +0.0/10.0
$184,900
🖨 Deal sheet (PDF) 📄 Offer letter ✓ Due diligence
Listing remarks
Come on in to 15155 White City Road, where modern updates meet peaceful country living. This beautifully remodeled 3-bedroom, 1-bath home has been thoughtfully upgraded from top to bottom, offering move-in ready convenience with stylish finishes throughout. Not a single room has gone untouched, creating a clean, cohesive feel you'll notice the moment you walk in. Major improvements provide peace of mind, including: a * * brand new * * metal roof in 2026, a new water softener system, updated windows throughout, and a newly installed sump pump (2026). The home also features a formal mud room and first-floor laundry, adding everyday functionality and ease. Step outside and enjoy everything
Key facts
- 1.5 acre lot
- Pool
- Built 1898
Property features AI
Exterior
- Parking: No garage
- Utilities: Electricity connected; High-speed internet available; Septic tank; Well water
- Home design: Single-story home; Resale property
- Construction: Metal roof; Aluminum siding; Vinyl siding; Block and stone foundation; Built (existing)
- Exterior features: Deck; Above-ground pool; Gravel driveway; Barn(s); Outbuilding; Poultry coop; Rural, agricultural and irregular lot
Interior
- Kitchen: Electric oven; Electric range; Microwave; Water softener (owned)
- Bedrooms: 2 main-level bedrooms
- Flooring: Laminate; Vinyl; Varies
- Bathrooms: 1 full bathroom (main level)
- Heating & cooling: Oil forced-air heating
- Interior features: Eat-in kitchen; Separate/formal living room; Bedroom on main level; Partial basement
- Laundry & utility: Main-level laundry; Electric water heater
Neighborhood map
What this means for you Summary
Snapshot
- This is a 3-bed/1.0-bath single-family listed at $185k.
Deal economics
- At list price, monthly cash flow is $47 ($560/yr) — positive.
- The deal already cash-flows at list — no discount required.
- To meet the 1% rule (rent ≥ 1% of price), the offer needs to be $154k (16.5% below list).
- Recommended offer: $154k (16.5% below list) — sets the bar for 1% rule.
Location & tenants
- Location reads 61/100 on livability (#901 in NY) — a middle-class / working-renter tenant base. Strengths: housing A+, cost of living A-; Watch: crime F, amenities F, commute F.
- Albion Central School District (town): math 37% / reading 50% proficiency, ranked #479 of 590 in NY (top 81%) — families likely to look elsewhere, expect single-tenant / working-renter base with shorter leases.
- Zoned schools: Ronald L Sodoma Elementary School (math 31% / reading 49%, grade F, #1,415 of 2,108 statewide, top 67%, 820 students, 57% FRL); Carl I Bergerson Middle School (math 19% / reading 44%, grade F, #522 of 729 statewide, top 73%, 403 students, 62% FRL); Charles D'Amico High School (math 98% / reading 87%, grade A+, #158 of 1,100 statewide, top 15%, 514 students, 63% FRL) — zoned schools average 60% FRL vs 45% district-wide (16 pts higher); higher-poverty schools than district average — tighter screening recommended.
- Market conditions: 44 active listings in the ZIP; 28 units permitted in Orleans County in 2024 (0 in 5+ unit buildings).
Forward outlook
- Local home prices are declining (-3.0%/yr); year-one equity from $1k of loan paydown is wiped out by about $6k of value loss. Plan a longer hold.
- Orleans County population projected at -20% by 2050 — secular population decline; favor cash flow + early exit over multi-decade hold.
Negotiation context
- It's been on market 46 days — a 3% lower offer ($179k) is reasonable based on typical stale-listing flexibility.
- Current owner paid $50k; list at $185k implies a 270% gain — meaningful room to come down on a strong offer.
Risks & watch-outs
- Watch-outs: built in 1898 — expect roof / HVAC / electrical / plumbing capex.
Questions for the listing agent
- It's been on market 46 days. Have you received any prior offers? Is the seller open to a 17% concession, seller financing, or rate buy-down credit?
- Built in 1898 — when were the roof, HVAC, electrical panel, plumbing, and water heater last replaced?
- Is there a deadline driving the sale (1031 exchange, divorce, estate, relocation)? That informs how much negotiation room exists.
- Crime grade is F in this area — have there been break-ins, vandalism, or insurance claims at this property in the last 3 years? What carrier currently insures it and at what premium?
- The area grade is low — what's the realistic commute time and amenity access for the typical tenant pool here? Any planned neighborhood developments (good or bad) we should know about?
- What's the average days-on-market for RENTAL listings here right now (not sales)? A rising rental-DOM trend means longer vacancies and softer asking-rent achievability than the comps imply.
- What's the recent tenant-quality profile in this submarket — average credit score on applications, eviction rate, late-payment / NSF rate, and stable-employment percentage? A property-management company in the area should have these aggregated.
- How much new for-sale + rental construction is in the pipeline within 1–3 miles? Heavy new supply typically softens prices + rents 12–24 months out; constrained supply supports both.
Investment metrics
- 1% rule
- 0.83% ✗
- Cap rate
- 6.60%
- Cash-on-cash
- 1.08%
- DSCR
- 1.05
- GRM
- 10.0
CMA / ARV
- ARV (median comp)
- $190,679
- List price
- $184,900
- Delta
- -3.03%
- Verdict
- FAIR
- Comps
- 2 within 2.0 mi
Projected returns pro-forma
-3.0% appreciation · 3.0% rent growth · sell at horizon
- IRR
- -14.6%
- Equity multiple
- 0.48×
- Total profit
- $-27,033
- Equity at exit
- $27,569
- IRR
- -6.0%
- Equity multiple
- 0.62×
- Total profit
- $-19,883
- Equity at exit
- $15,987
Cash invested: $51,772 (down + closing). Projections, not guarantees.
Landlord ↔ Tenant lean methodology
- Overall (STATE)
- 15 Strongly Tenant-Friendly
- State New York
- 15 Strongly Tenant-Friendly · D+10
- County
- — inherits STATE
- City
- — inherits STATE
ZIP-level market 14411
- Home prices YoY
- -11.6%
- Active inventory
- 44
- Price-to-rent
- 10.0×
Monthly cashflow live
- Estimated rent
- $1,543 medium interval (Pro) →
- Mortgage (P&I)
- −$970
- Tax from tax record
- −$126 /mo · $1,510/yr
- Insurance
- −$77
- HOA
- −$0
- Vacancy / Maint / Mgmt
- −$324
- Net cashflow
- $47
Break-even live
Sensitivity live
| Price | -10% $151 | -5% $99 | +0% $47 | +5% $-6 | +10% $-58 |
|---|---|---|---|---|---|
| Rent | -10% $-75 | -5% $-14 | +0% $47 | +5% $108 | +10% $169 |
| Rate | -1.0pp $140 | -0.5pp $94 | base $47 | +0.5pp $-1 | +1.0pp $-50 |
UW: 25.0% down · 7.5% · 30yr · 1.5% tax · 5.0% vac · 8.0% maint · 8.0% mgmt
Financing live
Cash to close
- Down payment
- $46,225
- Closing costs
- $5,547
- Reserves months
- —
- Total cash needed
- —
Loan-product check · same deal, 3 products live
Conventional
25% down · 7.5% · 30yr
- Down + closing
- —
- Monthly P&I
- —
- Monthly cashflow
- —
- DSCR
- —
- Eligible?
- —
Personal DTI + credit; lowest rate.
DSCR
20% down · 8.5% · 30yr
- Down + closing
- —
- Monthly P&I
- —
- Monthly cashflow
- —
- DSCR
- —
- Eligible?
- —
No personal income docs; deal must DSCR.
Hard money
10% down · 12.0% · 12mo
- Down + closing
- —
- Monthly P&I
- —
- Monthly cashflow
- —
- DSCR
- —
- Eligible?
- —
Short-term bridge; refi at stabilization.
Listing history 18 events
-
2026-06-21days on market $184,900 Active 46 DOM
-
2026-06-21days on market $184,900 Active 45 DOM
-
2026-06-18days on market $184,900 Active 43 DOM
-
2026-06-17days on market $184,900 Active 42 DOM
-
2026-06-16days on market $184,900 Active 41 DOM
-
2026-06-15days on market $184,900 Active 40 DOM
-
2026-06-13days on market $184,900 Active 38 DOM
-
2026-06-12days on market $184,900 Active 37 DOM
-
2026-06-09pricedays on market $184,900 Active 34 DOM
-
2026-06-08days on market $194,900 Active 33 DOM
-
2026-06-07days on market $194,900 Active 32 DOM
-
2026-06-07days on market $194,900 Active 31 DOM
-
2026-06-04days on market $194,900 Active 28 DOM
-
2026-06-02days on market $194,900 Active 27 DOM
-
2026-06-01days on market $194,900 Active 26 DOM
-
2026-05-31days on market $194,900 Active 25 DOM
-
2026-05-06$199,900 Active 1449-char remark
-
2024-05-15soldstatus $50,000
ⓘ Source: listings_history table (triggers on properties + properties_extension) + one-shot
backfill from property_details.listing_events for pre-trigger history.
Tax reassessment forecast NY · Partial reset (capped growth)
- Current annual tax
- $1,510 · $126/mo
- Projected year-2 tax
- $2,318 · $193/mo
- Expected delta
- +$807/yr (+$67/mo · 53.5%)
ⓘ Screening estimate from a state-policy table — verify with the county assessor before closing.
Climate risk First Street
- Flood 1/10 Low 0% chance over 30 yrs
- Wildfire 1/10 Low
- Heat 2/10 Low 7 d/yr ≥96°F today · 15 d/yr by 30 yrs out
- Wind 1/10 Low
- Air quality 2/10 Low 1 unhealthy d/yr today · 2 by 30 yrs out
Nearby sold comps map
Loading sold comps map…
Walkable amenities ~0.75 mi
Loading nearby amenities…
Taxation est. · year 1
- Rental income
- $18,519
- − Mortgage interest
- −$10,357
- − Property taxes
- −$1,510
- − Insurance
- −$924
- − Repairs & maintenance
- −$1,482
- − Management
- −$1,482
- − Depreciation
- −$5,379
- Taxable loss
- −$2,615
- Est. tax savings @ 24.0%
- +$628
- After-tax cash flow
- $1,187/yr
For passive investors: Depreciation is non-cash, so a rental often shows a tax loss while cash-flowing — sheltering income. Rental losses are passive: they offset passive income freely, and up to $25,000/yr can offset ordinary (W-2) income if you actively participate and your MAGI is under $100k (phasing out to $0 by $150k); unused losses carry forward. On sale, claimed depreciation is recaptured at up to 25%, and gains may owe capital-gains tax (a 1031 exchange can defer both). Figures are a year-1 estimate at your 24.0% rate — not tax advice; consult a CPA.
Schools (NCES district)
- District
- Albion Central School District
- NCES district ID
- 3602520
- Math proficiency
- 37% ▼ -15.00%
- Reading proficiency
- 50% ▲ 7.00%
- Median HH income
- $45,408
- Composite
- 36.91/100
- National rank
- #4541
- State rank
- #479 of 590 in NY
Livability — Elba
- Score
- 61/100
- State rank
- #901
- US rank
- #17545
Category grades
Schools grade is shown separately in the Schools card above.
Census & demographics
- Population (ZIP)
- 12,479
Population outlook (Orleans County) Hauer SSP2
- Today (2025)
- 39,123 people
- By 2030
- 37,648 · -3.8%
- By 2040
- 34,432 · -12.0%
- By 2050
- 31,487 · -19.5%
- By 2075
- 26,544 · -32.2%
- By 2100
- 22,251 · -43.1%
Race, ethnicity, and origin ACS 2023
- Neighborhood character
- Predominantly White (83%)
- Race & ethnicity
- White 83% Black 9% Hispanic / Latino 5% Two or more races 4%
- Common ancestry
- Romanian 5% Iranian 2% Lithuanian 2%
- Foreign-born
- 2% · Canada, China
- Languages at home
- 95% English-only · Spanish 4% Other Indo-European 1%
Political lean MEDSL · Orleans
- 2024 margin
- Solid R (+40.5) · D 29.8% · R 70.2%
- 2008→2024 swing
- -21.8pp toward R · 2008: -18.7pp · 2024: -40.5pp
- All cycles
- 2024: R+40.5 2020: R+36.0 2016: R+43.4 2012: R+19.4 2008: R+18.7
Not yet ingested
- Civics
- —
Market trends
- HPI YoY
- ▼ -39.68%
- Current HPI
- 302.9236
- Rent YoY
- —
- Metro
- —
- State GDP YoY
- ▲ 2.60%
- F500 in state
- 92
Industry mix (Fortune 500 HQ in NY)
| Industry | F500 HQs | Revenue |
|---|---|---|
| Financial Services | 10 | $950B |
|
||
| Consumer Goods | 9 | $162B |
|
||
| Insurance | 4 | $225B |
|
||
| Telecommunications | 2 | $144B |
|
||
| Pharmaceuticals | 2 | $112B |
|
||
| Media / Entertainment | 2 | $69B |
|
||
Price history
+269.8% since first listed4 events — show timeline
- 2026-06-09 Price Changed $184,900 WNYREIS
- 2026-05-27 Price Changed $194,900 WNYREIS
- 2026-05-06 Listed $199,900 WNYREIS
- 2024-05-15 Sold (Public Records) $50,000 Public Records
Property tax history
+3.7%/yrLatest (2025): $1,510 · +3.7% YoY. Source: county tax records.
Cash-flow waterfall
monthlySold comps — $/sqft
last 12 mo · ≤1 miLoading sold comps…