901 W Cayuga Dr · Athens, TX
Flood risk 1/10 · Minimal
- FEMA flood zone
- X (unshaded)
- Chance of flooding over 30 yrs
- 0.0%
- Est. flood insurance / yr
- $507 – $1,088
Fire risk 4/10 · Minor
- Est. fire insurance / yr
- $1,222 – $2,270
Heat risk 7/10 · Major
- Hot days now (above 110°F)
- 7 days/yr
- Hot days in 30 yrs
- 25 days/yr
Wind risk 6/10 · Moderate
- Chance of severe wind over 30 yrs
- 59.0%
Air-quality risk 2/10 · Minimal
- Unhealthy air days now
- 0 days/yr
- Unhealthy air days in 30 yrs
- 1 days/yr
Risk factors via First Street. Map © Google.
Why this score? — see what drove the B- grade
The composite is a weighted blend of 9 inputs, each scored 0–100. Each bar is that input's sub-score; the figure is the points it added to the 100-point composite (weight × sub-score).
- Cash flow +26.1/30.0
- ARV discount +15.0/15.0
- DSCR +8.8/10.0
- 1% rule +6.7/10.0
- Livability +3.6/5.0
- Schools +2.9/10.0
- Rent growth +2.5/5.0
- Condition / age +2.5/5.0
- Appreciation +0.0/10.0
$105,000
🖨 Deal sheet (PDF) 📄 Offer letter ✓ Due diligence
Listing remarks MLS
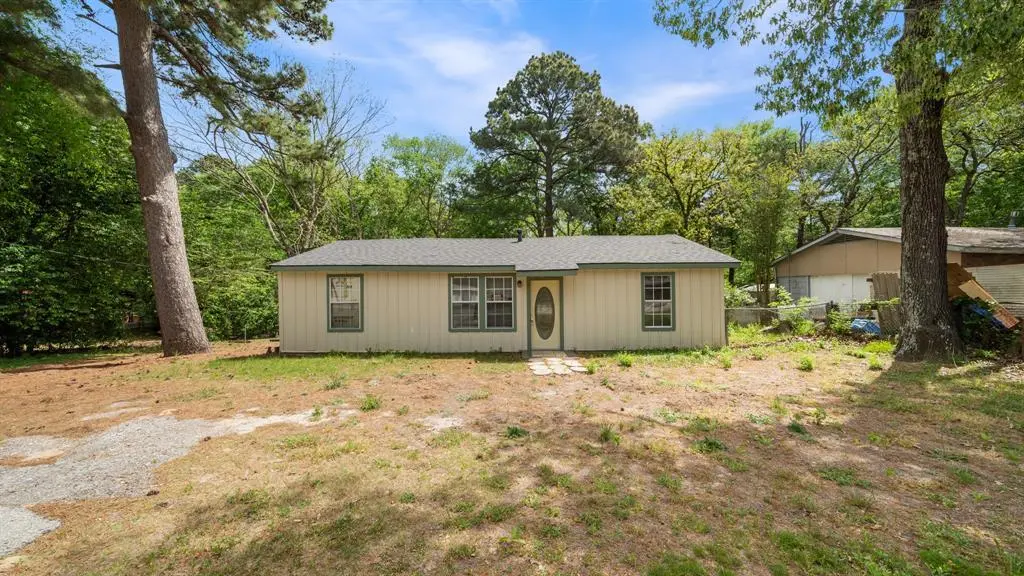
This 3-bedroom, 1-bath home is the perfect opportunity for investors or buyers looking to add value. With a roof installed just last year, a lot of the heavy lifting has already been done. The exterior has been updated, giving it great curb appeal and a solid starting point. Inside, the home is ready for your vision whether you’re planning a full remodel, rental, or flip. With a functional layout and strong bones, this property offers tons of upside for the right buyer. Bring your ideas and make this one your next successful project!
Key facts
- Strong bones
- Exterior updated
- Functional layout
Tags
Neighborhood map
What this means for you Summary
Snapshot
- This is a 3-bed/1.0-bath single-family listed at $105k.
Deal economics
- At list price, monthly cash flow is $265 ($3k/yr) — positive.
- The deal already cash-flows at list — no discount required.
- Meets the 1% rule at list price ($1k rent vs $105k).
- Recommended offer: $99k (6.0% below list) — sets the bar for market timing.
- Cap rate 9.3% vs local median 2.4% in Athens — top-decile yield for the area; either an underpriced asset or a hidden risk that comps aren't pricing in. Stress-test before assuming the spread holds.
Location & tenants
- Location reads 72/100 on livability (#241 in TX) — a middle-class / working-renter tenant base. Strengths: cost of living A+, health & safety A+, housing A; Watch: crime D+, amenities F, commute F.
- Athens ISD (town): math 34% / reading 34% proficiency, ranked #548 of 826 in TX (top 66%) — families likely to look elsewhere, expect single-tenant / working-renter base with shorter leases; 62% free/reduced lunch — lower-income household profile, screen leases tightly.
- Zoned schools: Bel Air El (math 34% / reading 35%, grade F, #1,995 of 4,322 statewide, top 50%, 453 students, 83% FRL); Athens Middle (math 35% / reading 33%, grade F, #892 of 1,662 statewide, top 55%, 682 students, 80% FRL); Athens H S (math 24% / reading 34%, grade F, #1,147 of 1,632 statewide, top 71%, 928 students, 75% FRL) — zoned schools average 80% FRL vs 62% district-wide (18 pts higher); higher-poverty schools than district average — tighter screening recommended.
- Market conditions: 191 active listings in the ZIP; 263 units permitted in Henderson County in 2024 (0 in 5+ unit buildings).
Forward outlook
- Local home prices are declining (-3.0%/yr); year-one equity from $726 of loan paydown is wiped out by about $3k of value loss. Plan a longer hold.
- At projected returns (-3.0% appreciation + 3.0% rent growth), your $29k cash investment doubles in ~10 years — after that, you're playing with house money.
Negotiation context
- It's been on market 79 days — a 6% lower offer ($99k) is reasonable based on typical stale-listing flexibility.
- 2 sale attempts; this cycle's ask has dropped $10k (9%) from the opening price — seller is motivated, your offer sets the floor, not the list.
Risks & watch-outs
- Climate carrying-cost: major wind risk, 59% chance of damaging wind over 30y; extreme-heat days projected 7→25/yr by 2055 (HVAC capex compounding) — expect insurance premiums to compound above CPI over the hold.
Questions for the listing agent
- It's been on market 79 days. Have you received any prior offers? Is the seller open to a 6% concession, seller financing, or rate buy-down credit?
- Why hasn't it sold? Are there any deal-killer items the seller is aware of (foundation, flood, title, zoning, code violations)?
- Is there a deadline driving the sale (1031 exchange, divorce, estate, relocation)? That informs how much negotiation room exists.
- Schools are D-rated, which usually means shorter tenancies and higher turnover. Who's the typical renter profile here, and what's been the actual vacancy rate?
- Crime grade is D in this area — have there been break-ins, vandalism, or insurance claims at this property in the last 3 years? What carrier currently insures it and at what premium?
- What's the average days-on-market for RENTAL listings here right now (not sales)? A rising rental-DOM trend means longer vacancies and softer asking-rent achievability than the comps imply.
- What's the recent tenant-quality profile in this submarket — average credit score on applications, eviction rate, late-payment / NSF rate, and stable-employment percentage? A property-management company in the area should have these aggregated.
- How much new for-sale + rental construction is in the pipeline within 1–3 miles? Heavy new supply typically softens prices + rents 12–24 months out; constrained supply supports both.
Investment metrics
- 1% rule
- 1.17% ✓
- Cap rate
- 9.33%
- Cash-on-cash
- 10.83%
- DSCR
- 1.48
- GRM
- 7.1
CMA / ARV
- ARV (median comp)
- $140,029
- List price
- $105,000
- Delta
- -25.02%
- Verdict
- UNDERPRICED
- Comps
- 2 within 1.0 mi
Projected returns pro-forma
-3.0% appreciation · 3.0% rent growth · sell at horizon
- IRR
- -0.1%
- Equity multiple
- 1.00×
- Total profit
- $-107
- Equity at exit
- $15,656
- IRR
- 9.6%
- Equity multiple
- 1.74×
- Total profit
- $21,694
- Equity at exit
- $9,078
Cash invested: $29,400 (down + closing). Projections, not guarantees.
Landlord ↔ Tenant lean methodology
- Overall (STATE)
- 87 Strongly Landlord-Friendly
- State Texas
- 87 Strongly Landlord-Friendly · R+5
- County
- — inherits STATE
- City
- — inherits STATE
ZIP-level market 75751
- Home prices YoY
- -33.1%
- Active inventory
- 191
- Price-to-rent
- 7.1×
Monthly cashflow live
- Estimated rent
- $1,228 medium interval (Pro) →
- Mortgage (P&I)
- −$551
- Tax from tax record
- −$111 /mo · $1,326/yr
- Insurance
- −$44
- HOA
- −$0
- Vacancy / Maint / Mgmt
- −$258
- Net cashflow
- $265
Break-even live
Sensitivity live
| Price | -10% $325 | -5% $295 | +0% $265 | +5% $236 | +10% $206 |
|---|---|---|---|---|---|
| Rent | -10% $168 | -5% $217 | +0% $265 | +5% $314 | +10% $362 |
| Rate | -1.0pp $318 | -0.5pp $292 | base $265 | +0.5pp $238 | +1.0pp $210 |
UW: 25.0% down · 7.5% · 30yr · 1.5% tax · 5.0% vac · 8.0% maint · 8.0% mgmt
Financing live
Cash to close
- Down payment
- $26,250
- Closing costs
- $3,150
- Reserves months
- —
- Total cash needed
- —
Loan-product check · same deal, 3 products live
Conventional
25% down · 7.5% · 30yr
- Down + closing
- —
- Monthly P&I
- —
- Monthly cashflow
- —
- DSCR
- —
- Eligible?
- —
Personal DTI + credit; lowest rate.
DSCR
20% down · 8.5% · 30yr
- Down + closing
- —
- Monthly P&I
- —
- Monthly cashflow
- —
- DSCR
- —
- Eligible?
- —
No personal income docs; deal must DSCR.
Hard money
10% down · 12.0% · 12mo
- Down + closing
- —
- Monthly P&I
- —
- Monthly cashflow
- —
- DSCR
- —
- Eligible?
- —
Short-term bridge; refi at stabilization.
Listing history 23 events
-
2026-06-21days on market $105,000 Active 79 DOM
-
2026-06-19days on market $105,000 Active 77 DOM
-
2026-06-18days on market $105,000 Active 76 DOM
-
2026-06-17days on market $105,000 Active 75 DOM
-
2026-06-16days on market $105,000 Active 74 DOM
-
2026-06-15days on market $105,000 Active 73 DOM
-
2026-06-14pricedays on market $105,000 Active 71 DOM
-
2026-06-12days on market $115,000 Active 70 DOM
-
2026-06-09days on market $115,000 Active 67 DOM
-
2026-06-08days on market $115,000 Active 66 DOM
-
2026-06-07days on market $115,000 Active 65 DOM
-
2026-06-05days on market $115,000 Active 62 DOM
-
2026-06-03days on market $115,000 Active 61 DOM
-
2026-06-02days on market $115,000 Active 60 DOM
-
2026-06-01days on market $115,000 Active 59 DOM
-
2026-05-31days on market $115,000 Active 58 DOM
-
2026-05-30days on market $115,000 Active 57 DOM
-
2026-04-24status Active 545-char remark
Show marketing remark (545 chars)
This 3-bedroom, 1-bath home is the perfect opportunity for investors or buyers looking to add value. With a roof installed just last year, a lot of the heavy lifting has already been done. The exterior has been updated, giving it great curb appeal and a solid starting point. Inside, the home is ready for your vision whether you’re planning a full remodel, rental, or flip. With a functional layout and strong bones, this property offers tons of upside for the right buyer. Bring your ideas and make this one your next successful project!
-
2026-04-19historical Active Option Contract 545-char remark
Show marketing remark (545 chars)
This 3-bedroom, 1-bath home is the perfect opportunity for investors or buyers looking to add value. With a roof installed just last year, a lot of the heavy lifting has already been done. The exterior has been updated, giving it great curb appeal and a solid starting point. Inside, the home is ready for your vision whether you’re planning a full remodel, rental, or flip. With a functional layout and strong bones, this property offers tons of upside for the right buyer. Bring your ideas and make this one your next successful project!
-
2026-04-03$115,000 Active 545-char remark
Show marketing remark (545 chars)
This 3-bedroom, 1-bath home is the perfect opportunity for investors or buyers looking to add value. With a roof installed just last year, a lot of the heavy lifting has already been done. The exterior has been updated, giving it great curb appeal and a solid starting point. Inside, the home is ready for your vision whether you’re planning a full remodel, rental, or flip. With a functional layout and strong bones, this property offers tons of upside for the right buyer. Bring your ideas and make this one your next successful project!
-
2008-06-26soldstatus
-
2008-06-26soldstatus
-
1988-09-01soldstatus
ⓘ Source: listings_history table (triggers on properties + properties_extension) + one-shot
backfill from property_details.listing_events for pre-trigger history.
Tax reassessment forecast TX · Resets to sale price
- Current annual tax
- $1,326 · $111/mo
- Projected year-2 tax
- $1,922 · $160/mo
- Expected delta
- +$595/yr (+$50/mo · 44.9%)
ⓘ Screening estimate from a state-policy table — verify with the county assessor before closing.
Climate risk First Street
- Flood 1/10 Low FEMA zone X (unshaded) · 0% chance over 30 yrs
- Wildfire 4/10 Moderate
- Heat 7/10 Severe 7 d/yr ≥110°F today · 25 d/yr by 30 yrs out
- Wind 6/10 Major 59% chance of damaging wind over 30 yrs
- Air quality 2/10 Low 0 unhealthy d/yr today · 1 by 30 yrs out
Nearby sold comps map
Loading sold comps map…
Walkable amenities ~0.75 mi
Loading nearby amenities…
Taxation est. · year 1
- Rental income
- $14,738
- − Mortgage interest
- −$5,882
- − Property taxes
- −$1,326
- − Insurance
- −$525
- − Repairs & maintenance
- −$1,179
- − Management
- −$1,179
- − Depreciation
- −$3,055
- Taxable income
- $1,593
- Est. tax owed @ 24.0%
- −$382
- After-tax cash flow
- $2,802/yr
For passive investors: Depreciation is non-cash, so a rental often shows a tax loss while cash-flowing — sheltering income. Rental losses are passive: they offset passive income freely, and up to $25,000/yr can offset ordinary (W-2) income if you actively participate and your MAGI is under $100k (phasing out to $0 by $150k); unused losses carry forward. On sale, claimed depreciation is recaptured at up to 25%, and gains may owe capital-gains tax (a 1031 exchange can defer both). Figures are a year-1 estimate at your 24.0% rate — not tax advice; consult a CPA.
Schools (NCES district)
- District
- Athens ISD
- NCES district ID
- 4808870
- Math proficiency
- 34% ▼ -9.00%
- Reading proficiency
- 34% ▼ -4.00%
- Median HH income
- $41,617
- Composite
- 28.73/100
- National rank
- #6680
- State rank
- #548 of 826 in TX
Livability — Athens
- Score
- 72/100
- State rank
- #241
- US rank
- #5796
Category grades
Schools grade is shown separately in the Schools card above.
Census & demographics
- Census place
- Athens, TX
- County
- Henderson County · 34,977 people
- City population
- 18,644
- Metro
- Athens, TX
- Population (ZIP)
- 18,644
- Household income
- $70,620
- Rent vs Own
- Severe rent burden
- 535.0
Population outlook (Henderson County) Hauer SSP2
- Today (2025)
- 80,471 people
- By 2030
- 80,608 · +0.2%
- By 2040
- 80,087 · -0.5%
- By 2050
- 78,208 · -2.8%
- By 2075
- 72,423 · -10.0%
- By 2100
- 61,012 · -24.2%
Race, ethnicity, and origin ACS 2023
- Neighborhood character
- Diverse neighborhood (Simpson 0.56)
- Race & ethnicity
- White 60% Hispanic / Latino 24% Two or more races 18% Black 10% Asian 2%
- Hispanic origin (detail)
- Mexican 22%
- Common ancestry
- Slovak 2% Romanian 1% Italian 1%
- Foreign-born
- 8% · Canada
- Languages at home
- 79% English-only · Spanish 19% Other Asian/Pacific 1%
Political lean MEDSL · Henderson
- 2024 margin
- Solid R (+63.5) · D 18.0% · R 81.4%
- 2008→2024 swing
- -18.8pp toward R · 2008: -44.6pp · 2024: -63.5pp
- All cycles
- 2024: R+63.5 2020: R+60.2 2016: R+60.0 2012: R+54.8 2008: R+44.6
Not yet ingested
- Civics
- —
Market trends
- HPI YoY
- ▼ -95.19%
- Current HPI
- 192.3973
- Rent YoY
- —
- Metro
- Athens, TX
- State GDP YoY
- ▲ 3.95%
- F500 in state
- 110
Industry mix (Fortune 500 HQ in TX)
| Industry | F500 HQs | Revenue |
|---|---|---|
| Energy | 16 | $1,198B |
|
||
| Technology | 5 | $198B |
|
||
| Engineering / Construction | 4 | $72B |
|
||
| Energy Services | 3 | $60B |
|
||
| Utilities | 3 | $41B |
|
||
| Healthcare | 2 | $330B |
|
||
Price history
6 events — show timeline
- 2026-04-24 Relisted — NTREIS
- 2026-04-19 Contingent — NTREIS
- 2026-04-03 Listed $115,000 NTREIS
- 2008-06-26 Sold (Public Records) — Public Records
- 2008-06-26 Sold (Public Records) — Public Records
- 1988-09-01 Sold (Public Records) — Public Records
Property tax history
+3.7%/yrLatest (2025): $1,326 · +0.2% YoY. Source: county tax records.
Cash-flow waterfall
monthlySold comps — $/sqft
last 12 mo · ≤1 miLoading sold comps…