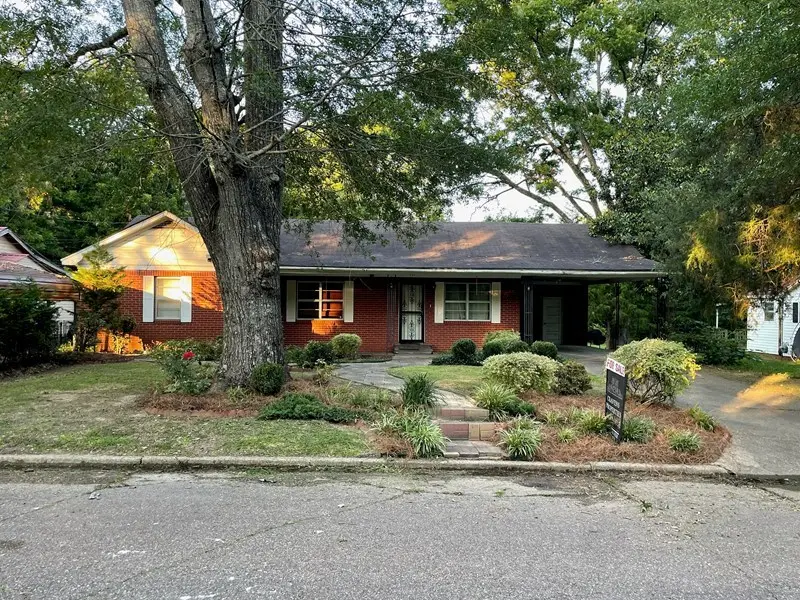
None · Winona, MS
Flood risk 1/10 · Minimal
- FEMA flood zone
- X (unshaded)
- Chance of flooding over 30 yrs
- 0.0%
- Est. flood insurance / yr
- $507 – $1,088
Fire risk 3/10 · Minor
- Est. fire insurance / yr
- $1,241 – $2,305
Heat risk 7/10 · Major
- Hot days now (above 108°F)
- 7 days/yr
- Hot days in 30 yrs
- 21 days/yr
Wind risk 6/10 · Moderate
- Chance of severe wind over 30 yrs
- 27.0%
Air-quality risk 1/10 · Minimal
- Unhealthy air days now
- 0 days/yr
- Unhealthy air days in 30 yrs
- 0 days/yr
Risk factors via First Street. Map © Google.
Why this score? — see what drove the C grade
The composite is a weighted blend of 9 inputs, each scored 0–100. Each bar is that input's sub-score; the figure is the points it added to the 100-point composite (weight × sub-score).
- Cash flow +15.1/30.0
- ARV discount +15.0/15.0
- Appreciation +7.0/10.0
- Schools +5.0/10.0
- DSCR +4.6/10.0
- 1% rule +4.2/10.0
- Livability +3.4/5.0
- Rent growth +2.5/5.0
- Condition / age +2.5/5.0
$125,000
🖨 Deal sheet 📄 Offer letter ✓ Due diligence
Key facts
- 0.31 acre lot
- Built 1960
- Listed 908 days
Property features AI
Exterior
- Utilities: Public water; Public sewer
- Home design: Single-story residential property; Zoned for single family
- Construction: Brick construction; Slab foundation
- Exterior features: Composition roof
Interior
- Flooring: Carpet; Hardwood; Vinyl
- Heating & cooling: Central heating; Space heater; Window unit cooling
- Interior features: Gas water heater; 6 total rooms
Neighborhood map
What this means for you Summary
Snapshot
- This is a 3-bed/2.0-bath single-family listed at $125k.
Deal economics
- At list price, monthly cash flow is $41 ($493/yr) — positive.
- The deal already cash-flows at list — no discount required.
- To meet the 1% rule (rent ≥ 1% of price), the offer needs to be $115k (8.4% below list).
- Recommended offer: $110k (12.0% below list) — sets the bar for market timing.
Location & tenants
- Location reads 68/100 on livability (#61 in MS) — a middle-class / working-renter tenant base. Strengths: cost of living A+, housing A+, health & safety A+; Watch: schools F, amenities F, commute F.
- Market conditions: 40 active listings in the ZIP; 92 units permitted in Montgomery County in 2024 (82 in 5+ unit buildings).
Forward outlook
- In year one you build about $6k of equity ($864 loan paydown + $5k appreciation (4.0% local appreciation)).
- Montgomery County population projected at -35% by 2050 — secular population decline; favor cash flow + early exit over multi-decade hold.
- At projected returns (4.0% appreciation + 3.0% rent growth), your $35k cash investment doubles in ~5 years — after that, you're playing with house money.
- By year 6, paydown + projected appreciation supports a ~$31k cash-out refi (75% LTV) — recoverable capital for the next deal without selling this one.
Negotiation context
- It's been on market 908 days — a 12% lower offer ($110k) is reasonable based on typical stale-listing flexibility.
- 3 sale attempts since 3y ago; this cycle's ask has dropped $24k (16%) from the opening price — seller is motivated, your offer sets the floor, not the list.
Risks & watch-outs
- Climate carrying-cost: major wind risk, 27% chance of damaging wind over 30y; extreme-heat days projected 7→21/yr by 2055 (HVAC capex compounding) — expect insurance premiums to compound above CPI over the hold.
Questions for the listing agent
- It's been on market 908 days. Have you received any prior offers? Is the seller open to a 12% concession, seller financing, or rate buy-down credit?
- Built in 1960 — when were the roof, HVAC, electrical panel, plumbing, and water heater last replaced?
- Why hasn't it sold? Are there any deal-killer items the seller is aware of (foundation, flood, title, zoning, code violations)?
- Is there a deadline driving the sale (1031 exchange, divorce, estate, relocation)? That informs how much negotiation room exists.
- Schools are F-rated, which usually means shorter tenancies and higher turnover. Who's the typical renter profile here, and what's been the actual vacancy rate?
- What's the average days-on-market for RENTAL listings here right now (not sales)? A rising rental-DOM trend means longer vacancies and softer asking-rent achievability than the comps imply.
- What's the recent tenant-quality profile in this submarket — average credit score on applications, eviction rate, late-payment / NSF rate, and stable-employment percentage? A property-management company in the area should have these aggregated.
- How much new for-sale + rental construction is in the pipeline within 1–3 miles? Heavy new supply typically softens prices + rents 12–24 months out; constrained supply supports both.
Investment metrics
- 1% rule
- 0.92% ✗
- Cap rate
- 6.69%
- Cash-on-cash
- 1.41%
- DSCR
- 1.06
- GRM
- 9.1
CMA / ARV
- ARV (on-the-fly)
- $172,408
- Comps found
- 3
Show comp detail 3 sales within ~0.75 mi
| Address | Dist | Beds/Ba | Sqft | Sold | Price | $/sf | Match |
|---|---|---|---|---|---|---|---|
| 226 N Quitman St | 0.52mi | 3/1.0 | 1,824 (-3%) | 1mo | $39,000 | $21 | 66 |
| 202 Vista Dr | 0.28mi | 3/2.0 | 2,060 (+10%) | 22mo | $189,000 | $92 | 52 |
| 400 Oak Dr | 0.43mi | 4/2.0 (+1) | 2,070 (+10%) | 8mo | $375,000 | $181 | 51 |
Match score weights: distance 35% · size 25% · config 20% · recency 20%. Top-matched comps best support the ARV.
Projected returns pro-forma
4.01% appreciation · 3.0% rent growth · sell at horizon
- IRR
- 11.6%
- Equity multiple
- 1.70×
- Total profit
- $24,527
- Equity at exit
- $63,476
- IRR
- 13.1%
- Equity multiple
- 3.16×
- Total profit
- $75,602
- Equity at exit
- $103,901
Cash invested: $35,000 (down + closing). Projections, not guarantees.
Landlord ↔ Tenant lean methodology
- Overall (STATE)
- 90 Strongly Landlord-Friendly
- State Mississippi
- 90 Strongly Landlord-Friendly · R+11
- County
- — inherits STATE
- City
- — inherits STATE
ZIP-level market 38967
- Home prices YoY
- 3.2%
- Active inventory
- 40
- Price-to-rent
- 9.1×
Monthly cashflow live
- Estimated rent
- $1,145 medium interval (Pro) →
- Mortgage (P&I)
- −$656
- Tax est. 1.5%
- −$156 /mo · $1,875/yr
- Insurance
- −$52
- HOA
- −$0
- Vacancy / Maint / Mgmt
- −$241
- Net cashflow
- $41
Break-even live
UW: 25.0% down · 7.5% · 30yr · 1.5% tax · 5.0% vac · 8.0% maint · 8.0% mgmt
Financing live
Cash to close
- Down payment
- $31,250
- Closing costs
- $3,750
- Reserves months
- —
- Total cash needed
- —
Loan-product check · same deal, 3 products live
Conventional
25% down · 7.5% · 30yr
- Down + closing
- —
- Monthly P&I
- —
- Monthly cashflow
- —
- DSCR
- —
- Eligible?
- —
Personal DTI + credit; lowest rate.
DSCR
20% down · 8.5% · 30yr
- Down + closing
- —
- Monthly P&I
- —
- Monthly cashflow
- —
- DSCR
- —
- Eligible?
- —
No personal income docs; deal must DSCR.
Hard money
10% down · 12.0% · 12mo
- Down + closing
- —
- Monthly P&I
- —
- Monthly cashflow
- —
- DSCR
- —
- Eligible?
- —
Short-term bridge; refi at stabilization.
Listing history 20 events
-
2026-06-18days on market $125,000 Active 908 DOM
-
2026-06-17days on market $125,000 Active 907 DOM
-
2026-06-16days on market $125,000 Active 906 DOM
-
2026-06-15days on market $125,000 Active 905 DOM
-
2026-06-13days on market $125,000 Active 903 DOM
-
2026-06-12days on market $125,000 Active 902 DOM
-
2026-06-09days on market $125,000 Active 899 DOM
-
2026-06-08days on market $125,000 Active 898 DOM
-
2026-06-07days on market $125,000 Active 897 DOM
-
2026-06-07days on market $125,000 Active 896 DOM
-
2026-06-04days on market $125,000 Active 893 DOM
-
2026-06-02days on market $125,000 Active 892 DOM
-
2026-06-01days on market $125,000 Active 891 DOM
-
2026-05-31days on market $125,000 Active 890 DOM
-
2024-12-31historical
-
2024-06-19status Active
-
2024-06-19price $125,000
-
2024-05-08price $139,000
-
2023-11-27$125,000 Active
-
2023-11-27$149,500 Active
ⓘ Source: listings_history table (triggers on properties + properties_extension) + one-shot
backfill from property_details.listing_events for pre-trigger history.
Climate risk First Street
- Flood 1/10 Low FEMA zone X (unshaded) · 0% chance over 30 yrs
- Wildfire 3/10 Moderate
- Heat 7/10 Severe 7 d/yr ≥108°F today · 21 d/yr by 30 yrs out
- Wind 6/10 Major 27% chance of damaging wind over 30 yrs
- Air quality 1/10 Low 0 unhealthy d/yr today · 0 by 30 yrs out
Nearby sold comps map
Loading sold comps map…
Walkable amenities ~0.75 mi
Loading nearby amenities…
Taxation est. · year 1
- Rental income
- $13,746
- − Mortgage interest
- −$7,002
- − Property taxes
- −$1,875
- − Insurance
- −$625
- − Repairs & maintenance
- −$1,100
- − Management
- −$1,100
- − Depreciation
- −$3,636
- Taxable loss
- −$1,592
- Est. tax savings @ 24.0%
- +$382
- After-tax cash flow
- $875/yr
For passive investors: Depreciation is non-cash, so a rental often shows a tax loss while cash-flowing — sheltering income. Rental losses are passive: they offset passive income freely, and up to $25,000/yr can offset ordinary (W-2) income if you actively participate and your MAGI is under $100k (phasing out to $0 by $150k); unused losses carry forward. On sale, claimed depreciation is recaptured at up to 25%, and gains may owe capital-gains tax (a 1031 exchange can defer both). Figures are a year-1 estimate at your 24.0% rate — not tax advice; consult a CPA.
Schools (NCES district)
No district data.
Livability — Winona
- Score
- 68/100
- State rank
- #61
- US rank
- #9387
Category grades
Schools grade is shown separately in the Schools card above.
Census & demographics
- Census place
- Winona, MS
- City population
- 7,048
- Population (ZIP)
- 7,048
Population outlook (Montgomery County) Hauer SSP2
- Today (2025)
- 8,904 people
- By 2030
- 8,221 · -7.7%
- By 2040
- 6,907 · -22.4%
- By 2050
- 5,780 · -35.1%
- By 2075
- 3,902 · -56.2%
- By 2100
- 2,975 · -66.6%
Race, ethnicity, and origin ACS 2023
- Neighborhood character
- Majority White (53%)
- Race & ethnicity
- White 53% Black 46%
- Common ancestry
- Serbian 2% Slovak 1% Italian 1%
- Foreign-born
- 0% · Canada
- Languages at home
- 99% English-only · French/Haitian/Cajun 1% Other Indo-European 1%
Political lean MEDSL · Montgomery
- 2024 margin
- Strong R (+20.8) · D 39.3% · R 60.1%
- 2008→2024 swing
- -12.7pp toward R · 2008: -8.1pp · 2024: -20.8pp
- All cycles
- 2024: R+20.8 2020: R+15.7 2016: R+13.4 2012: R+6.2 2008: R+8.1
Not yet ingested
- Civics
- —
Market trends
- HPI YoY
- ▲ 4.01%
- Current HPI
- 129.6366
- Rent YoY
- —
- Metro
- —
- State GDP YoY
- —
- F500 in state
- 0
Price history
+0.0% since first listed6 events — show timeline
- 2024-12-31 Listing Removed — MLSU
- 2024-06-19 Relisted — GBOR
- 2024-06-19 Price Changed $125,000 GBOR
- 2024-05-08 Price Changed $139,000 GBOR
- 2023-11-27 Listed $149,500 GBOR
- 2023-11-27 Listed $125,000 MLSU
Cash-flow waterfall
monthlySold comps — $/sqft
last 12 mo · ≤1 miLoading sold comps…