1635 SW Auburn Rd · Topeka, KS
Flood risk 1/10 · Minimal
- FEMA flood zone
- X (unshaded)
- Chance of flooding over 30 yrs
- 0.0%
- Est. flood insurance / yr
- $473 – $860
Fire risk 6/10 · Moderate
- Est. fire insurance / yr
- $1,154 – $2,142
Heat risk 5/10 · Moderate
- Hot days now (above 107°F)
- 7 days/yr
- Hot days in 30 yrs
- 17 days/yr
Wind risk 2/10 · Minimal
- Chance of severe wind over 30 yrs
- —
Air-quality risk 3/10 · Minor
- Unhealthy air days now
- 3 days/yr
- Unhealthy air days in 30 yrs
- 3 days/yr
Risk factors via First Street. Map © Google.
Why this score? — see what drove the D grade
The composite is a weighted blend of 9 inputs, each scored 0–100. Each bar is that input's sub-score; the figure is the points it added to the 100-point composite (weight × sub-score).
- Cash flow +14.6/30.0
- ARV discount +7.5/15.0
- DSCR +4.5/10.0
- 1% rule +3.7/10.0
- Schools +3.5/10.0
- Livability +3.5/5.0
- Rent growth +2.5/5.0
- Condition / age +2.5/5.0
- Appreciation +0.0/10.0
$255,000
🖨 Deal sheet (PDF) 📄 Offer letter ✓ Due diligence
Listing remarks
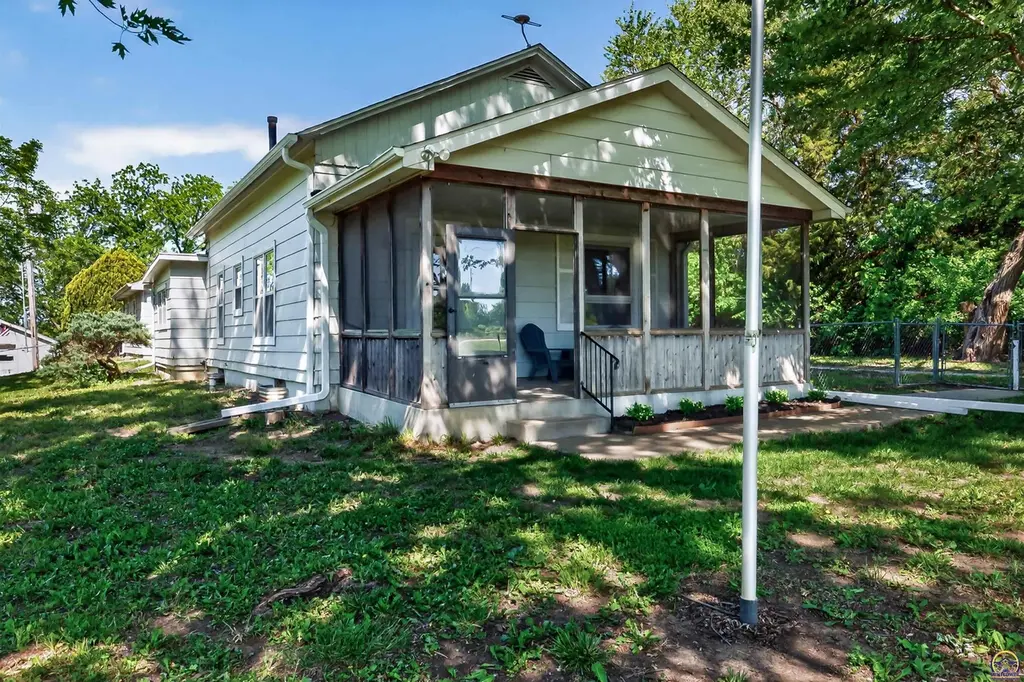
Located on just under 3 acres in the Washburn Rural district, this bungalow offers the space and privacy of country living while still being conveniently close to town. With mature trees surrounding the home, you’ll enjoy peaceful shade by day and star-filled skies by night, all while being tucked away from the noise of the city. The home features zero-step entry and has been updated with a nicely remodeled kitchen and bathrooms, newer windows, newer HVAC, and a newer roof. A large screened-in porch creates additional living space and opens directly to a fenced area that spans the length of one side of the home, making it ideal for pets, outdoor entertaining, or everyday convenience.
Key facts
- Screened-in porch
- Newer roof
- Zero-step entry
Tags
Property features AI
Finance
- Other: Property sits on approximately 2.73 acres
Exterior
- Parking: Attached garage with 4 spaces
- Utilities: Septic tank
- Home design: Single-family residence; Residential property
- Construction: Frame construction
- Exterior features: Patio; Screened porch; Outbuilding
Interior
- Kitchen: Gas cooktop; Range hood; Dishwasher; Refrigerator; Garbage disposal
- Flooring: Laminate flooring; Carpet
- Bathrooms: 2 full bathrooms
- Heating & cooling: Propane heating; Central air conditioning
- Interior features: Gas cooktop, range hood, dishwasher, refrigerator, and garbage disposal; Basement with block construction
- Laundry & utility: Main level laundry
Neighborhood map
What this means for you Summary
Snapshot
- This is a 3-bed/2.0-bath single-family listed at $255k.
Deal economics
- At list price, monthly cash flow is $61 ($735/yr) — positive.
- The deal already cash-flows at list — no discount required.
- To meet the 1% rule (rent ≥ 1% of price), the offer needs to be $223k (12.7% below list).
- Recommended offer: $223k (12.7% below list) — sets the bar for 1% rule.
- Cap rate 6.6% vs local median 4.3% in Topeka — top-decile yield for the area; either an underpriced asset or a hidden risk that comps aren't pricing in. Stress-test before assuming the spread holds.
Location & tenants
- Location reads 69/100 on livability (#195 in KS) — a middle-class / working-renter tenant base. Strengths: cost of living A+, housing A+, health & safety A+; Watch: employment C-, crime F, commute F.
- Auburn Washburn (rural): math 34% / reading 42% proficiency, ranked #29 of 169 in KS (top 17%) — families likely to look elsewhere, expect single-tenant / working-renter base with shorter leases.
- Zoned schools: Wanamaker Elem (math 37% / reading 53%, grade D-, #225 of 684 statewide, top 33%, 484 students, 38% FRL); Washburn Rural Middle School (math 28% / reading 31%, grade F, #72 of 219 statewide, top 38%, 943 students, 36% FRL); Washburn Rural High (math 25% / reading 30%, grade F, #83 of 327 statewide, top 25%, 1,884 students, 31% FRL).
- Market conditions: 18 active listings in the ZIP; solid renter incomes; 219 units permitted in Shawnee County in 2024 (25 in 5+ unit buildings).
Forward outlook
- Local home prices are declining (-3.0%/yr); year-one equity from $2k of loan paydown is wiped out by about $8k of value loss. Plan a longer hold.
- Shawnee County population projected to shrink 7% by 2050 — rents likely to lag national; underwrite the cash flow, not the appreciation.
Negotiation context
- It's been on market 21 days — a 2% lower offer ($251k) is reasonable based on typical stale-listing flexibility.
- Current owner paid $58k; list at $255k implies a 340% gain — meaningful room to come down on a strong offer.
Risks & watch-outs
- Watch-outs: built in 1950 — expect roof / HVAC / electrical / plumbing capex.
- Climate carrying-cost: major wildfire risk; extreme-heat days projected 7→17/yr by 2055 (HVAC capex compounding) — expect insurance premiums to compound above CPI over the hold.
Questions for the listing agent
- Built in 1950 — when were the roof, HVAC, electrical panel, plumbing, and water heater last replaced?
- Is there a deadline driving the sale (1031 exchange, divorce, estate, relocation)? That informs how much negotiation room exists.
- Schools are D-rated, which usually means shorter tenancies and higher turnover. Who's the typical renter profile here, and what's been the actual vacancy rate?
- Crime grade is F in this area — have there been break-ins, vandalism, or insurance claims at this property in the last 3 years? What carrier currently insures it and at what premium?
- The area grade is low — what's the realistic commute time and amenity access for the typical tenant pool here? Any planned neighborhood developments (good or bad) we should know about?
- What's the average days-on-market for RENTAL listings here right now (not sales)? A rising rental-DOM trend means longer vacancies and softer asking-rent achievability than the comps imply.
- What's the recent tenant-quality profile in this submarket — average credit score on applications, eviction rate, late-payment / NSF rate, and stable-employment percentage? A property-management company in the area should have these aggregated.
- How much new for-sale + rental construction is in the pipeline within 1–3 miles? Heavy new supply typically softens prices + rents 12–24 months out; constrained supply supports both.
Investment metrics
- 1% rule
- 0.87% ✗
- Cap rate
- 6.58%
- Cash-on-cash
- 1.03%
- DSCR
- 1.05
- GRM
- 9.5
CMA / ARV
No comps found within radius.
Projected returns pro-forma
-3.0% appreciation · 3.0% rent growth · sell at horizon
- IRR
- -14.7%
- Equity multiple
- 0.48×
- Total profit
- $-37,426
- Equity at exit
- $38,021
- IRR
- -6.0%
- Equity multiple
- 0.61×
- Total profit
- $-27,592
- Equity at exit
- $22,048
Cash invested: $71,400 (down + closing). Projections, not guarantees.
Landlord ↔ Tenant lean methodology
- Overall (STATE)
- 83 Strongly Landlord-Friendly
- State Kansas
- 83 Strongly Landlord-Friendly · R+10
- County
- — inherits STATE
- City
- — inherits STATE
ZIP-level market 66615
- Home prices YoY
- -12.3%
- Active inventory
- 18
- Price-to-rent
- 9.5×
Monthly cashflow live
- Estimated rent
- $2,226 medium interval (Pro) →
- Mortgage (P&I)
- −$1,337
- Tax from tax record
- −$254 /mo · $3,043/yr
- Insurance
- −$106
- HOA
- −$0
- Vacancy / Maint / Mgmt
- −$467
- Net cashflow
- $61
Break-even live
Sensitivity live
| Price | -10% $206 | -5% $133 | +0% $61 | +5% $-11 | +10% $-83 |
|---|---|---|---|---|---|
| Rent | -10% $-115 | -5% $-27 | +0% $61 | +5% $149 | +10% $237 |
| Rate | -1.0pp $190 | -0.5pp $126 | base $61 | +0.5pp $-5 | +1.0pp $-72 |
UW: 25.0% down · 7.5% · 30yr · 1.5% tax · 5.0% vac · 8.0% maint · 8.0% mgmt
Financing live
Cash to close
- Down payment
- $63,750
- Closing costs
- $7,650
- Reserves months
- —
- Total cash needed
- —
Loan-product check · same deal, 3 products live
Conventional
25% down · 7.5% · 30yr
- Down + closing
- —
- Monthly P&I
- —
- Monthly cashflow
- —
- DSCR
- —
- Eligible?
- —
Personal DTI + credit; lowest rate.
DSCR
20% down · 8.5% · 30yr
- Down + closing
- —
- Monthly P&I
- —
- Monthly cashflow
- —
- DSCR
- —
- Eligible?
- —
No personal income docs; deal must DSCR.
Hard money
10% down · 12.0% · 12mo
- Down + closing
- —
- Monthly P&I
- —
- Monthly cashflow
- —
- DSCR
- —
- Eligible?
- —
Short-term bridge; refi at stabilization.
Listing history 9 events
-
2026-06-07statusdays on market $255,000 Pending 21 DOM
-
2026-06-03days on market $255,000 Active Under Contract 20 DOM
-
2026-06-02days on market $255,000 Active Under Contract 19 DOM
-
2026-06-01days on market $255,000 Active Under Contract 18 DOM
-
2026-05-31days on market $255,000 Active Under Contract 17 DOM
-
2026-05-30days on market $255,000 Active Under Contract 16 DOM
-
2026-05-14$255,000 Active
-
2010-03-16soldstatus
-
1985-09-01soldstatus $58,000
ⓘ Source: listings_history table (triggers on properties + properties_extension) + one-shot
backfill from property_details.listing_events for pre-trigger history.
Tax reassessment forecast KS · Resets to sale price
- Current annual tax
- $3,043 · $254/mo
- Projected year-2 tax
- $3,596 · $300/mo
- Expected delta
- +$553/yr (+$46/mo · 18.2%)
ⓘ Screening estimate from a state-policy table — verify with the county assessor before closing.
Climate risk First Street
- Flood 1/10 Low FEMA zone X (unshaded) · 0% chance over 30 yrs
- Wildfire 6/10 Major
- Heat 5/10 Major 7 d/yr ≥107°F today · 17 d/yr by 30 yrs out
- Wind 2/10 Low
- Air quality 3/10 Moderate 3 unhealthy d/yr today · 3 by 30 yrs out
Nearby sold comps map
Loading sold comps map…
Walkable amenities ~0.75 mi
Loading nearby amenities…
Taxation est. · year 1
- Rental income
- $26,709
- − Mortgage interest
- −$14,284
- − Property taxes
- −$3,043
- − Insurance
- −$1,275
- − Repairs & maintenance
- −$2,137
- − Management
- −$2,137
- − Depreciation
- −$7,418
- Taxable loss
- −$3,585
- Est. tax savings @ 24.0%
- +$860
- After-tax cash flow
- $1,595/yr
For passive investors: Depreciation is non-cash, so a rental often shows a tax loss while cash-flowing — sheltering income. Rental losses are passive: they offset passive income freely, and up to $25,000/yr can offset ordinary (W-2) income if you actively participate and your MAGI is under $100k (phasing out to $0 by $150k); unused losses carry forward. On sale, claimed depreciation is recaptured at up to 25%, and gains may owe capital-gains tax (a 1031 exchange can defer both). Figures are a year-1 estimate at your 24.0% rate — not tax advice; consult a CPA.
Schools (NCES district)
- District
- Auburn Washburn
- NCES district ID
- 2003200
- Math proficiency
- 34% ▼ -8.00%
- Reading proficiency
- 42% ▼ -5.00%
- Median HH income
- $71,903
- Composite
- 34.91/100
- National rank
- #5073
- State rank
- #29 of 169 in KS
Livability — Topeka
- Score
- 69/100
- State rank
- #195
- US rank
- #8848
Category grades
Schools grade is shown separately in the Schools card above.
Census & demographics
- County
- Shawnee County · 118,130 people
- City population
- 118,130
- Metro
- Topeka, KS
- Population (ZIP)
- 2,943
- Household income
- $107,656
- Rent vs Own
- Severe rent burden
- 77.0
Population outlook (Shawnee County) Hauer SSP2
- Today (2025)
- 179,277 people
- By 2030
- 177,762 · -0.8%
- By 2040
- 172,341 · -3.9%
- By 2050
- 166,330 · -7.2%
- By 2075
- 152,417 · -15.0%
- By 2100
- 134,782 · -24.8%
Race, ethnicity, and origin ACS 2023
- Neighborhood character
- Predominantly White (88%)
- Race & ethnicity
- White 88% Two or more races 9% Hispanic / Latino 5%
- Common ancestry
- Lithuanian 4% Iranian 4% Portuguese 3%
- Foreign-born
- 1%
- Languages at home
- 98% English-only · Spanish 1% German/W. Germanic 1%
Political lean MEDSL · Shawnee
- 2024 margin
- Toss-up / Even · D 49.3% · R 48.8% · Other 2.0%
- 2008→2024 swing
- +0.8pp no change · 2008: -0.3pp · 2024: 0.5pp
- All cycles
- 2024: D+0.5 2020: D+3.0 2016: R+2.8 2012: R+1.7 2008: R+0.3
Not yet ingested
- Civics
- —
Market trends
- HPI YoY
- ▼ -33.55%
- Current HPI
- 238.2642
- Rent YoY
- —
- Metro
- Topeka, KS
- State GDP YoY
- —
- F500 in state
- 0
Price history
+339.7% since first listed3 events — show timeline
- 2026-05-14 Listed $255,000 Sunflower MLS as distributed by MLS GRID
- 2010-03-16 Sold (Public Records) — Public Records
- 1985-09-01 Sold (Public Records) $58,000 Public Records
Property tax history
+4.7%/yrLatest (2025): $3,043 · +5.4% YoY. Source: county tax records.
Cash-flow waterfall
monthlySold comps — $/sqft
last 12 mo · ≤1 miLoading sold comps…