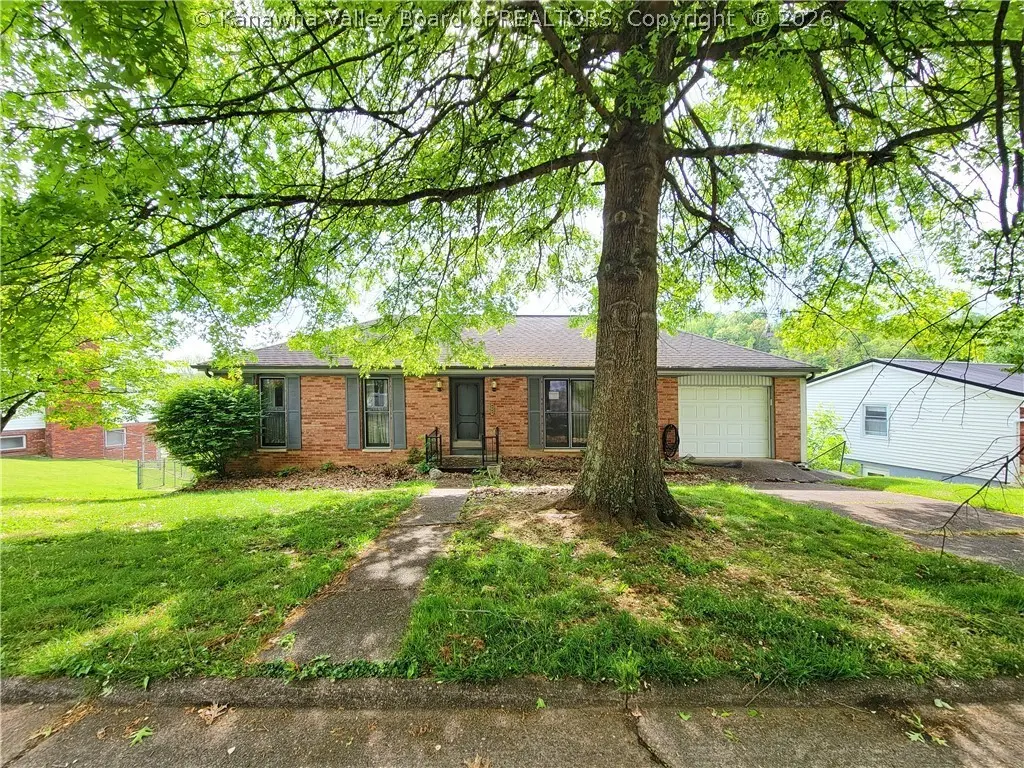
6907 Heritage Dr · Sissonville, WV
Flood risk 1/10 · Minimal
- FEMA flood zone
- X (unshaded)
- Chance of flooding over 30 yrs
- 0.0%
- Est. flood insurance / yr
- $473 – $860
Fire risk 6/10 · Moderate
- Est. fire insurance / yr
- $787 – $1,461
Heat risk 5/10 · Moderate
- Hot days now (above 100°F)
- 7 days/yr
- Hot days in 30 yrs
- 20 days/yr
Wind risk 2/10 · Minimal
- Chance of severe wind over 30 yrs
- 1.0%
Air-quality risk 2/10 · Minimal
- Unhealthy air days now
- 0 days/yr
- Unhealthy air days in 30 yrs
- 1 days/yr
Risk factors via First Street. Map © Google.
Why this score? — see what drove the C- grade
The composite is a weighted blend of 9 inputs, each scored 0–100. Each bar is that input's sub-score; the figure is the points it added to the 100-point composite (weight × sub-score).
- Cash flow +18.0/30.0
- ARV discount +7.5/15.0
- 1% rule +5.9/10.0
- DSCR +5.7/10.0
- Appreciation +4.5/10.0
- Livability +3.1/5.0
- Schools +2.9/10.0
- Rent growth +2.5/5.0
- Condition / age +2.5/5.0
$98,000
🖨 Deal sheet (PDF) 📄 Offer letter ✓ Due diligence
Key facts
- Covered patio
- Cozy fireplace
- One level living
Tags
Property features AI
Finance
- HOA & community: Homeowners association with an annual fee of $260 (about $21.67/month)
Exterior
- Parking: Attached garage (1 car)
- Utilities: Public water; Public sewer
- Home design: Ranch-style residential; Single-story
- Construction: Brick, frame and plaster construction; Composition shingle roof
- Exterior features: Patio
Interior
- Flooring: Carpet; Vinyl
- Bathrooms: 2 full bathrooms; 1 half bathroom
- Heating & cooling: Heat pump heating; Heat pump cooling
- Interior features: Storm windows; Full basement
Neighborhood map
What this means for you Summary
Snapshot
- This is a 2-bed/1.5-bath single-family listed at $98k.
Deal economics
- At list price, monthly cash flow is $85 ($1k/yr) — positive.
- The deal already cash-flows at list — no discount required.
- Meets the 1% rule at list price ($1k rent vs $98k).
- Cap rate 7.3% vs local median 4.1% in Sissonville — top-decile yield for the area; either an underpriced asset or a hidden risk that comps aren't pricing in. Stress-test before assuming the spread holds.
Location & tenants
- Location reads 62/100 on livability (#183 in WV) — a middle-class / working-renter tenant base. Strengths: crime A+, cost of living A+, housing A-; Watch: employment D+, amenities F, commute F.
- Kanawha County Schools (suburban): math 29% / reading 40% proficiency, ranked #17 of 55 in WV (top 31%) — families likely to look elsewhere, expect single-tenant / working-renter base with shorter leases.
- Zoned schools: Flinn Elementary School (math 32% / reading 32%, grade F, #191 of 377 statewide, top 56%, 439 students, 0% FRL); Sissonville Middle School (math 33% / reading 45%, grade F, #21 of 109 statewide, top 19%, 541 students, 0% FRL); Sissonville High School (math 17% / reading 42%, grade F, #69 of 110 statewide, top 71%, 563 students, 0% FRL) — zoned schools average 0% FRL vs 46% district-wide (46 pts lower); this property's tenant base skews higher-income than the district average.
- Market conditions: 40 active listings in the ZIP; 103 units permitted in Kanawha County in 2024 (0 in 5+ unit buildings).
Forward outlook
- Local home prices are declining (-1.0%/yr); year-one equity from $678 of loan paydown is wiped out by about $1k of value loss. Plan a longer hold.
- Kanawha County population projected at -17% by 2050 — secular population decline; favor cash flow + early exit over multi-decade hold.
Negotiation context
- Only 14 days on market — expect competitive offers; lowballing is unlikely to land.
- 3 sale attempts since 7y ago with the ask held roughly flat each time — persistent listings suggest the price (not the market) is what's stuck; bring a comps-based counter.
Risks & watch-outs
- Climate carrying-cost: major wildfire risk; extreme-heat days projected 7→20/yr by 2055 (HVAC capex compounding) — expect insurance premiums to compound above CPI over the hold.
Questions for the listing agent
- Built in 1969 — when were the roof, HVAC, electrical panel, plumbing, and water heater last replaced?
- What does the HOA fee cover, when was the last increase, and are there any pending special assessments or reserve-fund shortfalls?
- Is there a deadline driving the sale (1031 exchange, divorce, estate, relocation)? That informs how much negotiation room exists.
- Schools are F-rated, which usually means shorter tenancies and higher turnover. Who's the typical renter profile here, and what's been the actual vacancy rate?
- What's the average days-on-market for RENTAL listings here right now (not sales)? A rising rental-DOM trend means longer vacancies and softer asking-rent achievability than the comps imply.
- What's the recent tenant-quality profile in this submarket — average credit score on applications, eviction rate, late-payment / NSF rate, and stable-employment percentage? A property-management company in the area should have these aggregated.
- How much new for-sale + rental construction is in the pipeline within 1–3 miles? Heavy new supply typically softens prices + rents 12–24 months out; constrained supply supports both.
Investment metrics
- 1% rule
- 1.09% ✓
- Cap rate
- 7.33%
- Cash-on-cash
- 3.71%
- DSCR
- 1.17
- GRM
- 7.6
CMA / ARV
- ARV (on-the-fly)
- $262,080
- Comps found
- 3
Show comp detail 3 sales within ~0.75 mi
| Address | Dist | Beds/Ba | Sqft | Sold | Price | $/sf | Match |
|---|---|---|---|---|---|---|---|
| 7003 Valley Brook Dr | 0.11mi | 3/2.5 (+1) | 2,246 (+3%) | 7mo | $269,405 | $120 | 75 |
| 2015 Cloverfield Ln | 0.07mi | 3/1.5 (+1) | 2,012 (-8%) | 22mo | $272,500 | $135 | 60 |
| 7018 Kanawha Farm Cir | 0.19mi | 3/2.5 (+1) | 1,925 (-12%) | 8mo | $197,000 | $102 | 55 |
Match score weights: distance 35% · size 25% · config 20% · recency 20%. Top-matched comps best support the ARV.
Projected returns pro-forma
-1.04% appreciation · 3.0% rent growth · sell at horizon
- IRR
- -1.7%
- Equity multiple
- 0.92×
- Total profit
- $-2,082
- Equity at exit
- $23,464
- IRR
- 5.1%
- Equity multiple
- 1.48×
- Total profit
- $13,224
- Equity at exit
- $24,476
Cash invested: $27,440 (down + closing). Projections, not guarantees.
Landlord ↔ Tenant lean methodology
- Overall (STATE)
- 83 Strongly Landlord-Friendly
- State West Virginia
- 83 Strongly Landlord-Friendly · R+22
- County
- — inherits STATE
- City
- — inherits STATE
ZIP-level market 25312
- Home prices YoY
- -0.5%
- Active inventory
- 40
- Price-to-rent
- 7.6×
Monthly cashflow live
- Estimated rent
- $1,070 medium interval (Pro) →
- Mortgage (P&I)
- −$514
- Tax from tax record
- −$184 /mo · $2,206/yr
- Insurance
- −$41
- HOA
- −$22
- Vacancy / Maint / Mgmt
- −$225
- Net cashflow
- $85
Break-even live
Sensitivity live
| Price | -10% $140 | -5% $113 | +0% $85 | +5% $57 | +10% $29 |
|---|---|---|---|---|---|
| Rent | -10% $0 | -5% $43 | +0% $85 | +5% $127 | +10% $169 |
| Rate | -1.0pp $134 | -0.5pp $110 | base $85 | +0.5pp $60 | +1.0pp $34 |
UW: 25.0% down · 7.5% · 30yr · 1.5% tax · 5.0% vac · 8.0% maint · 8.0% mgmt
Financing live
Cash to close
- Down payment
- $24,500
- Closing costs
- $2,940
- Reserves months
- —
- Total cash needed
- —
Loan-product check · same deal, 3 products live
Conventional
25% down · 7.5% · 30yr
- Down + closing
- —
- Monthly P&I
- —
- Monthly cashflow
- —
- DSCR
- —
- Eligible?
- —
Personal DTI + credit; lowest rate.
DSCR
20% down · 8.5% · 30yr
- Down + closing
- —
- Monthly P&I
- —
- Monthly cashflow
- —
- DSCR
- —
- Eligible?
- —
No personal income docs; deal must DSCR.
Hard money
10% down · 12.0% · 12mo
- Down + closing
- —
- Monthly P&I
- —
- Monthly cashflow
- —
- DSCR
- —
- Eligible?
- —
Short-term bridge; refi at stabilization.
HOA detail
- Monthly dues
- $22 · $264/yr
Listing history 4 events
-
2026-05-12status Pending
-
2026-04-24$98,000 Active
-
2021-05-18$147,000
-
2019-09-21$138,900
ⓘ Source: listings_history table (triggers on properties + properties_extension) + one-shot
backfill from property_details.listing_events for pre-trigger history.
Tax reassessment forecast WV · Resets to sale price
- Current annual tax
- $2,206 · $184/mo
- Projected year-2 tax
- $2,206 · $184/mo
- Expected delta
- $0/yr ($0/mo · 0.0%)
ⓘ Screening estimate from a state-policy table — verify with the county assessor before closing.
Climate risk First Street
- Flood 1/10 Low FEMA zone X (unshaded) · 0% chance over 30 yrs
- Wildfire 6/10 Major
- Heat 5/10 Major 7 d/yr ≥100°F today · 20 d/yr by 30 yrs out
- Wind 2/10 Low 100% chance of damaging wind over 30 yrs
- Air quality 2/10 Low 0 unhealthy d/yr today · 1 by 30 yrs out
Nearby sold comps map
Loading sold comps map…
Walkable amenities ~0.75 mi
Loading nearby amenities…
Taxation est. · year 1
- Rental income
- $12,843
- − Mortgage interest
- −$5,490
- − Property taxes
- −$2,206
- − Insurance
- −$490
- − Repairs & maintenance
- −$1,027
- − Management
- −$1,027
- − HOA
- −$264
- − Depreciation
- −$2,851
- Taxable loss
- −$512
- Est. tax savings @ 24.0%
- +$123
- After-tax cash flow
- $1,142/yr
For passive investors: Depreciation is non-cash, so a rental often shows a tax loss while cash-flowing — sheltering income. Rental losses are passive: they offset passive income freely, and up to $25,000/yr can offset ordinary (W-2) income if you actively participate and your MAGI is under $100k (phasing out to $0 by $150k); unused losses carry forward. On sale, claimed depreciation is recaptured at up to 25%, and gains may owe capital-gains tax (a 1031 exchange can defer both). Figures are a year-1 estimate at your 24.0% rate — not tax advice; consult a CPA.
Schools (NCES district)
- District
- Kanawha County Schools
- NCES district ID
- 5400600
- Math proficiency
- 29% ▼ -13.00%
- Reading proficiency
- 40% ▼ -7.00%
- Median HH income
- $44,329
- Composite
- 29.35/100
- National rank
- #6540
- State rank
- #17 of 55 in WV
Livability — Sissonville
- Score
- 62/100
- State rank
- #183
- US rank
- #16829
Category grades
Schools grade is shown separately in the Schools card above.
Census & demographics
- Census place
- Sissonville, WV
- Population (ZIP)
- 10,089
Population outlook (Kanawha County) Hauer SSP2
- Today (2025)
- 178,946 people
- By 2030
- 172,906 · -3.4%
- By 2040
- 159,874 · -10.7%
- By 2050
- 148,148 · -17.2%
- By 2075
- 123,257 · -31.1%
- By 2100
- 96,454 · -46.1%
Race, ethnicity, and origin ACS 2023
- Neighborhood character
- Predominantly White (96%)
- Race & ethnicity
- White 96% Two or more races 1%
- Common ancestry
- Slovak 2% Iranian 1% Serbian 1%
Political lean MEDSL · Kanawha
- 2024 margin
- R (+17.4) · D 40.2% · R 57.6% · Other 2.2%
- 2008→2024 swing
- -17.0pp toward R · 2008: -0.4pp · 2024: -17.4pp
- All cycles
- 2024: R+17.4 2020: R+14.7 2016: R+20.6 2012: R+11.9 2008: R+0.4
Not yet ingested
- Civics
- —
Market trends
- HPI YoY
- ▼ -1.04%
- Current HPI
- 205.2853
- Rent YoY
- —
- Metro
- —
- State GDP YoY
- —
- F500 in state
- 0
Price history
-29.4% since first listed4 events — show timeline
- 2026-05-12 Pending — KVBOR
- 2026-04-24 Listed $98,000 KVBOR
- 2021-05-18 Listed $147,000 KVBOR
- 2019-09-21 Listed $138,900 KVBOR
Property tax history
+8.4%/yrLatest (2025): $2,206 · -1.2% YoY. Source: county tax records.
Cash-flow waterfall
monthlySold comps — $/sqft
last 12 mo · ≤1 miLoading sold comps…