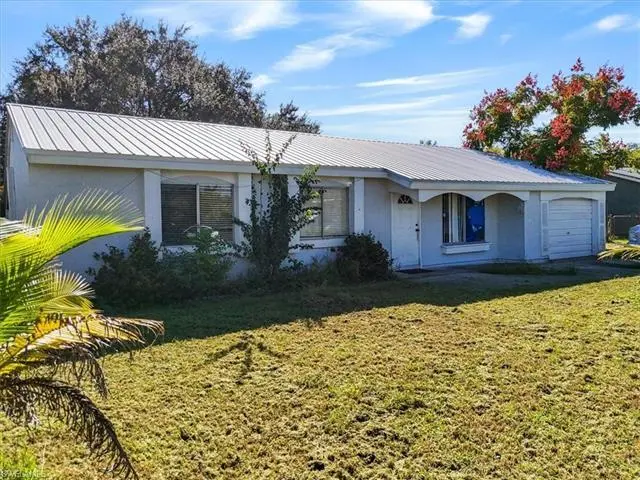
4077 S Edgewater Cir · Port LaBelle, FL
Flood risk 4/10 · Minor
- FEMA flood zone
- X (unshaded)
- Chance of flooding over 30 yrs
- 0.21%
- Est. flood insurance / yr
- $507 – $1,088
Fire risk 4/10 · Minor
- Est. fire insurance / yr
- $947 – $1,759
Heat risk 9/10 · Severe
- Hot days now (above 108°F)
- 7 days/yr
- Hot days in 30 yrs
- 25 days/yr
Wind risk 10/10 · Severe
- Chance of severe wind over 30 yrs
- 99.0%
Air-quality risk 2/10 · Minimal
- Unhealthy air days now
- 2 days/yr
- Unhealthy air days in 30 yrs
- 2 days/yr
Risk factors via First Street. Map © Google.
Why this score? — see what drove the A- grade
The composite is a weighted blend of 9 inputs, each scored 0–100. Each bar is that input's sub-score; the figure is the points it added to the 100-point composite (weight × sub-score).
- Cash flow +26.8/30.0
- ARV discount +15.0/15.0
- Appreciation +10.0/10.0
- DSCR +9.2/10.0
- 1% rule +7.9/10.0
- Schools +3.1/10.0
- Livability +3.1/5.0
- Rent growth +2.5/5.0
- Condition / age +2.5/5.0
$175,000
🖨 Deal sheet 📄 Offer letter ✓ Due diligence
Listing remarks
This property is currently being offered below market value - and is anticipated to be a short sale transaction! The approval process with the bank has started, and we anticipate a bank approved list price SOON. In the meantime, PLEASE submit all reasonable offers for this lovely and well cared for home. The oversized yard offers tranquil, mature landscaping. Your metal roof is less than four years old, and all major systems are functional, making this a perfect home to live in as you make it your own. Schedule your tour today!
Key facts
- Metal roof
- Oversized yard
- Mature landscaping
Tags
Property features AI
Finance
- Other: Lot is approximately 0.23 acres; Lot is regular shaped with frontage and back ~87' and sides ~125'; City-maintained road access; Irrigation: central
- HOA & community: No HOA maintenance; Community park; Streetlights; Non-gated community
Exterior
- Parking: Attached 2-car garage; Paved driveway
- Security: Smoke detectors (interior)
- Utilities: Central water; Central sewer; Cable available
- Home design: Single-family residence; 1 story / ranch; Rear exposure facing east; Residential property in Port LaBelle
- Construction: Wood frame construction; Metal roof; Built in 1980
- Exterior features: Patio; Room for a pool; Stucco exterior; Single-hung windows; Storm protection (see remarks); Wooded area view
Interior
- Kitchen: Range; Microwave; Refrigerator; Eat-in kitchen
- Bedrooms: 3 bedrooms plus a den
- Flooring: Tile
- Bathrooms: 2 full bathrooms; Master bathroom with combination tub and shower
- Heating & cooling: Central electric heat; Central electric air conditioning; Ceiling fans
- Interior features: Smoke detectors; Great room floor plan; Eat-in kitchen; Den / study
- Laundry & utility: Washer/dryer hookup; Auto garage door opener
Neighborhood map
What this means for you Summary
Snapshot
- This is a 3-bed/2.0-bath single-family listed at $175k.
Deal economics
- At list price, monthly cash flow is $478 ($6k/yr) — positive.
- The deal already cash-flows at list — no discount required.
- Meets the 1% rule at list price ($2k rent vs $175k).
- Recommended offer: $170k (3.0% below list) — sets the bar for market timing.
- Cap rate 9.6% vs local median 5.1% in Port LaBelle — top-decile yield for the area; either an underpriced asset or a hidden risk that comps aren't pricing in. Stress-test before assuming the spread holds.
Location & tenants
- Location reads 62/100 on livability (#750 in FL) — a middle-class / working-renter tenant base. Strengths: cost of living A+, housing A+; Watch: schools F, amenities F, commute F.
- Hendry (town): math 35% / reading 40% proficiency, ranked #65 of 73 in FL (top 89%) — families likely to look elsewhere, expect single-tenant / working-renter base with shorter leases; 75% free/reduced lunch — lower-income household profile, screen leases tightly.
- Market conditions: 942 active listings in the ZIP; 5 comparable units currently listed for rent nearby; rentals at typical pace (median 24d on market — plan ~3-4 weeks tenant-placement turnaround); 557 units permitted in Hendry County in 2024 (45 in 5+ unit buildings).
- At $2,265/mo this rent would consume 48% of the median local household income ($57k/yr) (locally 498% of renters already pay >50% of income on rent) — very limited rent-growth headroom before tenants either downsize or default.
Forward outlook
- In year one you build about $19k of equity ($1k loan paydown + $18k appreciation (10.0% local appreciation)).
- Hendry County population projected to shrink 7% by 2050 — rents likely to lag national; underwrite the cash flow, not the appreciation.
- At projected returns (10.0% appreciation + 3.0% rent growth), your $49k cash investment doubles in ~2 years — after that, you're playing with house money.
- By year 2, paydown + projected appreciation supports a ~$30k cash-out refi (75% LTV) — recoverable capital for the next deal without selling this one.
Negotiation context
- It's been on market 35 days — a 3% lower offer ($170k) is reasonable based on typical stale-listing flexibility.
- 5 sale attempts since 12y ago with the ask held roughly flat each time — persistent listings suggest the price (not the market) is what's stuck; bring a comps-based counter.
Risks & watch-outs
- Climate carrying-cost: severe wind risk, 99% chance of damaging wind over 30y; extreme-heat days projected 7→25/yr by 2055 (HVAC capex compounding) — expect insurance premiums to compound above CPI over the hold.
Questions for the listing agent
- It's been on market 35 days. Have you received any prior offers? Is the seller open to a 3% concession, seller financing, or rate buy-down credit?
- Is there a deadline driving the sale (1031 exchange, divorce, estate, relocation)? That informs how much negotiation room exists.
- Schools are F-rated, which usually means shorter tenancies and higher turnover. Who's the typical renter profile here, and what's been the actual vacancy rate?
- What's the average days-on-market for RENTAL listings here right now (not sales)? A rising rental-DOM trend means longer vacancies and softer asking-rent achievability than the comps imply.
- What's the recent tenant-quality profile in this submarket — average credit score on applications, eviction rate, late-payment / NSF rate, and stable-employment percentage? A property-management company in the area should have these aggregated.
- How much new for-sale + rental construction is in the pipeline within 1–3 miles? Heavy new supply typically softens prices + rents 12–24 months out; constrained supply supports both.
Investment metrics
- 1% rule
- 1.29% ✓
- Cap rate
- 9.57%
- Cash-on-cash
- 11.71%
- DSCR
- 1.52
- GRM
- 6.4
CMA / ARV
- ARV (on-the-fly)
- $240,240
- Comps found
- 12
Show comp detail 12 sales within ~0.75 mi
| Address | Dist | Beds/Ba | Sqft | Sold | Price | $/sf | Match |
|---|---|---|---|---|---|---|---|
| 4002 Cascade Ln | 0.12mi | 3/2.0 | 1,344 (+2%) | 3mo | $280,000 | $208 | 89 |
| 4018 Caloosa Loop | 0.31mi | 3/2.0 | 1,404 (+6%) | 2mo | $214,000 | $152 | 73 |
| 2006 Inglewood Cir | 0.30mi | 3/2.0 | 1,246 (-6%) | 13mo | $265,990 | $213 | 66 |
| 2001 Jeronimo Rd | 0.57mi | 3/2.0 | 1,356 (+3%) | 5mo | $295,000 | $218 | 65 |
| 4038 Rainbow Cir | 0.39mi | 3/2.0 | 1,377 (+4%) | 12mo | $225,000 | $163 | 64 |
| 2040 S Montana Cir | 0.60mi | 3/2.0 | 1,392 (+6%) | 0mo | $230,000 | $165 | 63 |
| 2010 S Montana Cir | 0.43mi | 3/2.0 | 1,389 (+5%) | 13mo | $255,000 | $184 | 60 |
| 4049 Rainbow Cir | 0.39mi | 2/2.0 (-1) | 1,262 (-4%) | 12mo | $230,000 | $182 | 59 |
| 4002 S Edgewater Cir | 0.28mi | 3/2.0 | 1,456 (+10%) | 13mo | $217,000 | $149 | 59 |
| 2029 Jeronimo Rd | 0.62mi | 3/2.0 | 1,292 (-2%) | 11mo | $299,900 | $232 | 58 |
| 4033 School Cir | 0.70mi | 3/2.0 | 1,476 (+12%) | 0mo | $262,500 | $178 | 48 |
| 4005 School Cir | 0.53mi | 3/2.0 | 1,510 (+14%) | 13mo | $228,800 | $152 | 40 |
Match score weights: distance 35% · size 25% · config 20% · recency 20%. Top-matched comps best support the ARV.
Projected returns pro-forma
10.0% appreciation · 3.0% rent growth · sell at horizon
- IRR
- 32.9%
- Equity multiple
- 3.57×
- Total profit
- $125,850
- Equity at exit
- $157,654
- IRR
- 28.4%
- Equity multiple
- 8.08×
- Total profit
- $346,860
- Equity at exit
- $339,987
Cash invested: $49,000 (down + closing). Projections, not guarantees.
Landlord ↔ Tenant lean methodology
- Overall (STATE)
- 87 Strongly Landlord-Friendly
- State Florida
- 87 Strongly Landlord-Friendly · R+3
- County
- — inherits STATE
- City
- — inherits STATE
ZIP-level market 33935
- Home prices YoY
- 16.3%
- Active inventory
- 942
- Price-to-rent
- 6.4×
Monthly cashflow live
- Estimated rent
- $2,265 high interval (Pro) →
- Mortgage (P&I)
- −$918
- Tax from tax record
- −$321 /mo · $3,850/yr
- Insurance
- −$73
- HOA
- −$0
- Vacancy / Maint / Mgmt
- −$476
- Net cashflow
- $478
Break-even live
UW: 25.0% down · 7.5% · 30yr · 1.5% tax · 5.0% vac · 8.0% maint · 8.0% mgmt
Financing live
Cash to close
- Down payment
- $43,750
- Closing costs
- $5,250
- Reserves months
- —
- Total cash needed
- —
Loan-product check · same deal, 3 products live
Conventional
25% down · 7.5% · 30yr
- Down + closing
- —
- Monthly P&I
- —
- Monthly cashflow
- —
- DSCR
- —
- Eligible?
- —
Personal DTI + credit; lowest rate.
DSCR
20% down · 8.5% · 30yr
- Down + closing
- —
- Monthly P&I
- —
- Monthly cashflow
- —
- DSCR
- —
- Eligible?
- —
No personal income docs; deal must DSCR.
Hard money
10% down · 12.0% · 12mo
- Down + closing
- —
- Monthly P&I
- —
- Monthly cashflow
- —
- DSCR
- —
- Eligible?
- —
Short-term bridge; refi at stabilization.
Rent comps 5 comps
| Address | Beds | Baths | Sqft | Rent | $/sqft | DOM | Units | Dist |
|---|---|---|---|---|---|---|---|---|
| 5029 S Rosebud Cir Labelle, FL | 3.0 | 2.0 | 1389 | $1,780 | $1.28 | 23d | 1 | 0.88mi |
| 3020 N Lakewood Rd Labelle, FL | 4.0 | 2.0 | 1499 | $1,950 | $1.30 | 23d | 1 | 1.09mi |
| 5012 Gunn Pl Labelle, FL | 3.0 | 2.5 | 1783 | $2,500 | $1.40 | 2d | 1 | 1.38mi |
| 3051 NW Beechwood Cir Labelle, FL | 4.0 | 2.0 | 1499 | $2,200 | $1.47 | 23d | 1 | 1.38mi |
| 5029 W Hummingbird Dr Labelle, FL | 3.0 | 2.0 | 1212 | $2,450 | $2.02 | 3d | 1 | 1.39mi |
Listing history 32 events
-
2026-06-18days on market $175,000 Active 35 DOM
-
2026-06-17days on market $175,000 Active 34 DOM
-
2026-06-16days on market $175,000 Active 33 DOM
-
2026-06-15days on market $175,000 Active 32 DOM
-
2026-06-13days on market $175,000 Active 30 DOM
-
2026-06-13days on market $175,000 Active 29 DOM
-
2026-06-10days on market $175,000 Active 27 DOM
-
2026-06-09days on market $175,000 Active 26 DOM
-
2026-06-08days on market $175,000 Active 25 DOM
-
2026-06-07days on market $175,000 Active 24 DOM
-
2026-06-03days on market $175,000 Active 20 DOM
-
2026-06-02days on market $175,000 Active 19 DOM
-
2026-06-01days on market $175,000 Active 18 DOM
-
2026-05-31days on market $175,000 Active 17 DOM
-
2026-05-14$175,000 Active
-
2026-01-12$225,000 Active
-
2026-01-12historical
-
2026-01-07price $225,000
-
2025-12-16price $244,000
-
2025-10-23price $246,000
-
2025-10-16$264,000 Active
-
2023-06-23soldstatus $227,000
-
2023-06-16soldstatus $227,000 Closed
-
2023-03-22status Pending
-
2022-10-31price $237,000
-
2022-10-28$23,700 Active
-
2014-07-25price $35,900
-
2014-07-24soldstatus $36,000
-
2014-06-09$36,000
-
2013-09-17price $77,900
-
2003-10-15soldstatus $78,500
-
2003-10-09soldstatus $78,500
ⓘ Source: listings_history table (triggers on properties + properties_extension) + one-shot
backfill from property_details.listing_events for pre-trigger history.
Tax reassessment forecast FL · Resets to sale price
- Current annual tax
- $3,850 · $321/mo
- Projected year-2 tax
- $3,850 · $321/mo
- Expected delta
- $0/yr ($0/mo · 0.0%)
ⓘ Screening estimate from a state-policy table — verify with the county assessor before closing.
Climate risk First Street
- Flood 4/10 Moderate FEMA zone X (unshaded) · 21% chance over 30 yrs
- Wildfire 4/10 Moderate
- Heat 9/10 Extreme 7 d/yr ≥108°F today · 25 d/yr by 30 yrs out
- Wind 10/10 Extreme 99% chance of damaging wind over 30 yrs
- Air quality 2/10 Low 2 unhealthy d/yr today · 2 by 30 yrs out
Nearby sold comps map
Loading sold comps map…
Walkable amenities ~0.75 mi
Loading nearby amenities…
Taxation est. · year 1
- Rental income
- $27,182
- − Mortgage interest
- −$9,803
- − Property taxes
- −$3,850
- − Insurance
- −$875
- − Repairs & maintenance
- −$2,175
- − Management
- −$2,175
- − Depreciation
- −$5,091
- Taxable income
- $3,214
- Est. tax owed @ 24.0%
- −$771
- After-tax cash flow
- $4,965/yr
For passive investors: Depreciation is non-cash, so a rental often shows a tax loss while cash-flowing — sheltering income. Rental losses are passive: they offset passive income freely, and up to $25,000/yr can offset ordinary (W-2) income if you actively participate and your MAGI is under $100k (phasing out to $0 by $150k); unused losses carry forward. On sale, claimed depreciation is recaptured at up to 25%, and gains may owe capital-gains tax (a 1031 exchange can defer both). Figures are a year-1 estimate at your 24.0% rate — not tax advice; consult a CPA.
Schools (NCES district)
- District
- Hendry
- NCES district ID
- 1200780
- Math proficiency
- 35% ▼ -11.00%
- Reading proficiency
- 40% ▼ -4.00%
- Median HH income
- $37,043
- Composite
- 31.16/100
- National rank
- #6054
- State rank
- #65 of 73 in FL
Livability — Port LaBelle
- Score
- 62/100
- State rank
- #750
- US rank
- #16264
Category grades
Schools grade is shown separately in the Schools card above.
Census & demographics
- Census place
- Port LaBelle, FL
- County
- Hendry County · 23,186 people
- Metro
- Clewiston, FL
- Population (ZIP)
- 23,186
- Household income
- $57,009
- Rent vs Own
- Severe rent burden
- 498.0
Population outlook (Hendry County) Hauer SSP2
- Today (2025)
- 38,866 people
- By 2030
- 38,558 · -0.8%
- By 2040
- 37,743 · -2.9%
- By 2050
- 36,117 · -7.1%
- By 2075
- 30,070 · -22.6%
- By 2100
- 21,966 · -43.5%
Race, ethnicity, and origin ACS 2023
- Neighborhood character
- Majority Hispanic (56%)
- Race & ethnicity
- Hispanic / Latino 56% White 39% Two or more races 21% Black 2% Native American 2%
- Hispanic origin (detail)
- Mexican 40% Puerto Rican 3% Cuban 5%
- Common ancestry
- Lithuanian 2% Serbian 2% Slovak 1%
- Foreign-born
- 27% · Canada, Jamaica
- Languages at home
- 50% English-only · Spanish 50%
Political lean MEDSL · Hendry
- 2024 margin
- Solid R (+38.3) · D 30.4% · R 68.7%
- 2008→2024 swing
- -31.1pp toward R · 2008: -7.2pp · 2024: -38.3pp
- All cycles
- 2024: R+38.3 2020: R+23.0 2016: R+14.2 2012: R+5.9 2008: R+7.2
Not yet ingested
- Civics
- —
Market trends
- HPI YoY
- ▲ 75.20%
- Current HPI
- 537.4928
- Rent YoY
- —
- Metro
- Clewiston, FL
- State GDP YoY
- ▲ 3.28%
- F500 in state
- 36
Industry mix (Fortune 500 HQ in FL)
| Industry | F500 HQs | Revenue |
|---|---|---|
| Industrial Technology | 2 | $29B |
|
||
| Insurance | 2 | $17B |
|
||
| Retail | 1 | $60B |
|
||
| Technology Distribution | 1 | $58B |
|
||
| Homebuilding | 1 | $35B |
|
||
| Technology Manufacturing | 1 | $35B |
|
||
Price history
+122.9% since first listed18 events — show timeline
- 2026-05-14 Listed $175,000 BEARMLS
- 2026-01-12 Listing Removed — FORTMLS
- 2026-01-12 Listed $225,000 BEARMLS
- 2026-01-07 Price Changed $225,000 FORTMLS
- 2025-12-16 Price Changed $244,000 FORTMLS
- 2025-10-23 Price Changed $246,000 FORTMLS
- 2025-10-16 Listed $264,000 FORTMLS
- 2023-06-23 Sold (Public Records) $227,000 Public Records
- 2023-06-16 Sold (MLS) $227,000 FORTMLS
- 2023-03-22 Pending — FORTMLS
- 2022-10-31 Price Changed $237,000 FORTMLS
- 2022-10-28 Listed $23,700 FORTMLS
- 2014-07-25 Price Changed $35,900 FORTMLS
- 2014-07-24 Sold (MLS) $36,000 FORTMLS
- 2014-06-09 Listed $36,000 FORTMLS
- 2013-09-17 Price Changed $77,900 FORTMLS
- 2003-10-15 Sold (Public Records) $78,500 Public Records
- 2003-10-09 Sold (MLS) $78,500 FORTMLS
Property tax history
+11.8%/yrLatest (2025): $3,850 · +9.8% YoY. Source: county tax records.
Cash-flow waterfall
monthlySold comps — $/sqft
last 12 mo · ≤1 miLoading sold comps…