15009 Canary St St · Lakeshore Resort, IN
Flood risk 1/10 · Minimal
- FEMA flood zone
- X (unshaded)
- Chance of flooding over 30 yrs
- 0.0%
- Est. flood insurance / yr
- $507 – $1,088
Fire risk 1/10 · Minimal
- Est. fire insurance / yr
- $717 – $1,331
Heat risk 3/10 · Minor
- Hot days now (above 102°F)
- 7 days/yr
- Hot days in 30 yrs
- 19 days/yr
Wind risk 2/10 · Minimal
- Chance of severe wind over 30 yrs
- 1.0%
Air-quality risk 2/10 · Minimal
- Unhealthy air days now
- 0 days/yr
- Unhealthy air days in 30 yrs
- 1 days/yr
Risk factors via First Street. Map © Google.
Why this score? — see what drove the C grade
The composite is a weighted blend of 9 inputs, each scored 0–100. Each bar is that input's sub-score; the figure is the points it added to the 100-point composite (weight × sub-score).
- Cash flow +25.5/30.0
- DSCR +8.4/10.0
- ARV discount +7.5/15.0
- 1% rule +5.8/10.0
- Schools +5.0/10.0
- Rent growth +2.5/5.0
- Livability +2.5/5.0
- Condition / age +2.5/5.0
- Appreciation +0.0/10.0
$120,000
🖨 Deal sheet 📄 Offer letter ✓ Due diligence
Listing remarks MLS
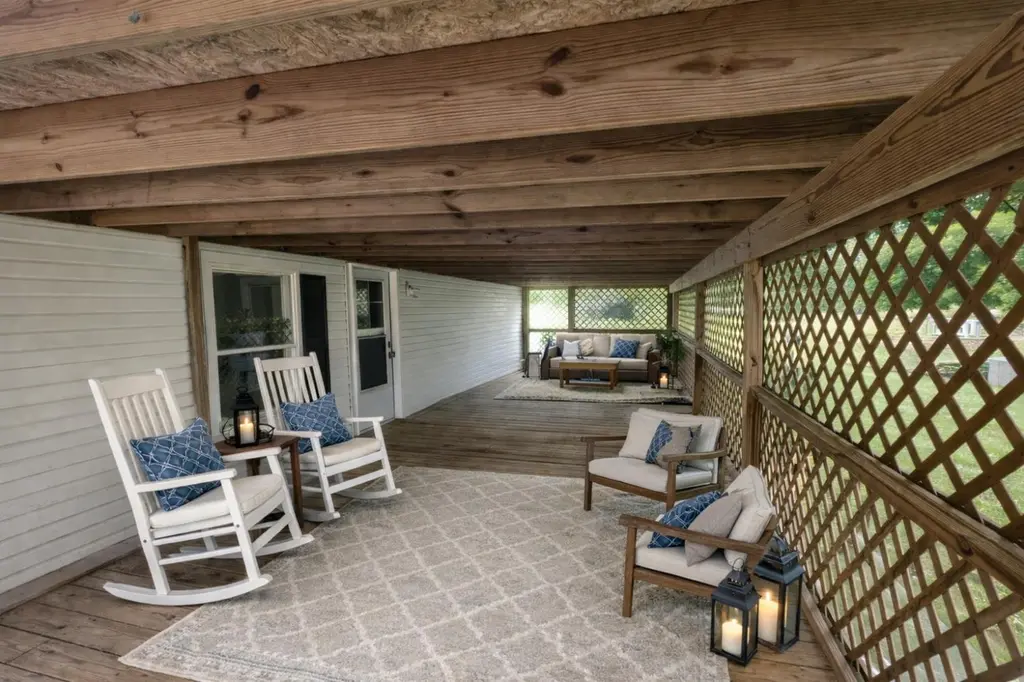
When you think of family trips, room to enjoy them, imagine this home, 4 or 5 bed, 2 bath, dining, living, walk out family room, deck and covered front porch, space is not an issue inside or out on this triple lot! Located in Beautiful Lakeshore Resort, next-door to 5260 acre Brookville Lake! If you love being out on the boat, skiing, fishing and just all-around water fun then this place is for you. And the outdoor entertainment doesn't stop there, 13,500 acres of woods, hiking trails, beaches, bike trails, canoeing, you name it! This is one of the most Beautiful hidden Gems and largest outdoor playgrounds in the Tri-state. And only 45 minutes from downtown Cincinnati, Hamilton, Richmond an hour from Indy. Bring the boat, the golf cart, the kids and family and make memories. No need to pull the boat or towns back and forth, no more storage fees. One of the few campgrounds that you own it lock stock and barrel come and go year round. Roof 2 years old , completely remodeled 2022/23
Key facts
- Brookville lake
- Bike trails
- Lakeshore resort
Tags
Neighborhood map
What this means for you Summary
Snapshot
- This is a 4-bed/2.0-bath single-family listed at $120k.
Deal economics
- At list price, monthly cash flow is $279 ($3k/yr) — positive.
- The deal already cash-flows at list — no discount required.
- Meets the 1% rule at list price ($1k rent vs $120k).
- Recommended offer: $109k (9.0% below list) — sets the bar for market timing.
Location & tenants
- Location reads: area grade C — affects rentability + tenant quality, not the cash-flow math above.
- Market conditions: 4 active listings in the ZIP; 58 units permitted in Franklin County in 2024 (0 in 5+ unit buildings).
Forward outlook
- Local home prices are declining (-3.0%/yr); year-one equity from $830 of loan paydown is wiped out by about $4k of value loss. Plan a longer hold.
- Franklin County population projected to shrink 10% by 2050 — rents likely to lag national; underwrite the cash flow, not the appreciation.
Negotiation context
- It's been on market 91 days — a 9% lower offer ($109k) is reasonable based on typical stale-listing flexibility.
- 4 sale attempts since 2y ago with the ask held roughly flat each time — persistent listings suggest the price (not the market) is what's stuck; bring a comps-based counter.
Questions for the listing agent
- It's been on market 91 days. Have you received any prior offers? Is the seller open to a 9% concession, seller financing, or rate buy-down credit?
- Why hasn't it sold? Are there any deal-killer items the seller is aware of (foundation, flood, title, zoning, code violations)?
- Is there a deadline driving the sale (1031 exchange, divorce, estate, relocation)? That informs how much negotiation room exists.
- What's the average days-on-market for RENTAL listings here right now (not sales)? A rising rental-DOM trend means longer vacancies and softer asking-rent achievability than the comps imply.
- What's the recent tenant-quality profile in this submarket — average credit score on applications, eviction rate, late-payment / NSF rate, and stable-employment percentage? A property-management company in the area should have these aggregated.
- How much new for-sale + rental construction is in the pipeline within 1–3 miles? Heavy new supply typically softens prices + rents 12–24 months out; constrained supply supports both.
Investment metrics
- 1% rule
- 1.08% ✓
- Cap rate
- 9.08%
- Cash-on-cash
- 9.96%
- DSCR
- 1.44
- GRM
- 7.7
CMA / ARV
- ARV (median comp)
- $253,722
- List price
- $120,000
- Delta
- -52.70%
- Verdict
- UNDERPRICED
- Comps
- 4 within 1.0 mi
Show comp detail 1 sale within ~0.75 mi
| Address | Dist | Beds/Ba | Sqft | Sold | Price | $/sf | Match |
|---|---|---|---|---|---|---|---|
| 15069 Eagle Nest Dr | 0.58mi | 3/2.0 (-1) | 1,923 (-11%) | 20mo | $240,000 | $125 | 33 |
Match score weights: distance 35% · size 25% · config 20% · recency 20%. Top-matched comps best support the ARV.
Projected returns pro-forma
-3.0% appreciation · 3.0% rent growth · sell at horizon
- IRR
- -1.3%
- Equity multiple
- 0.95×
- Total profit
- $-1,708
- Equity at exit
- $17,892
- IRR
- 8.3%
- Equity multiple
- 1.63×
- Total profit
- $21,264
- Equity at exit
- $10,375
Cash invested: $33,600 (down + closing). Projections, not guarantees.
Landlord ↔ Tenant lean methodology
- Overall (STATE)
- 90 Strongly Landlord-Friendly
- State Indiana
- 90 Strongly Landlord-Friendly · R+11
- County
- — inherits STATE
- City
- — inherits STATE
ZIP-level market 47012
- Home prices YoY
- -27.1%
- Active inventory
- 4
- Price-to-rent
- 7.7×
Monthly cashflow live
- Estimated rent
- $1,298 medium interval (Pro) →
- Mortgage (P&I)
- −$629
- Tax from tax record
- −$67 /mo · $804/yr
- Insurance
- −$50
- HOA
- −$0
- Vacancy / Maint / Mgmt
- −$273
- Net cashflow
- $279
Break-even live
UW: 25.0% down · 7.5% · 30yr · 1.5% tax · 5.0% vac · 8.0% maint · 8.0% mgmt
Financing live
Cash to close
- Down payment
- $30,000
- Closing costs
- $3,600
- Reserves months
- —
- Total cash needed
- —
Loan-product check · same deal, 3 products live
Conventional
25% down · 7.5% · 30yr
- Down + closing
- —
- Monthly P&I
- —
- Monthly cashflow
- —
- DSCR
- —
- Eligible?
- —
Personal DTI + credit; lowest rate.
DSCR
20% down · 8.5% · 30yr
- Down + closing
- —
- Monthly P&I
- —
- Monthly cashflow
- —
- DSCR
- —
- Eligible?
- —
No personal income docs; deal must DSCR.
Hard money
10% down · 12.0% · 12mo
- Down + closing
- —
- Monthly P&I
- —
- Monthly cashflow
- —
- DSCR
- —
- Eligible?
- —
Short-term bridge; refi at stabilization.
Listing history 21 events
-
2026-06-18days on market $120,000 Active 91 DOM
-
2026-06-17days on market $120,000 Active 90 DOM
-
2026-06-16days on market $120,000 Active 89 DOM
-
2026-06-15days on market $120,000 Active 88 DOM
-
2026-06-13days on market $120,000 Active 86 DOM
-
2026-06-13days on market $120,000 Active 85 DOM
-
2026-06-09days on market $120,000 Active 82 DOM
-
2026-06-08days on market $120,000 Active 81 DOM
-
2026-06-07days on market $120,000 Active 80 DOM
-
2026-06-04days on market $120,000 Active 77 DOM
-
2026-06-03days on market $120,000 Active 76 DOM
-
2026-06-02days on market $120,000 Active 75 DOM
-
2026-06-01days on market $120,000 Active 74 DOM
-
2026-05-31days on market $120,000 Active 73 DOM
-
2026-03-20$120,000 Active 994-char remark
Show marketing remark (994 chars)
When you think of family trips, room to enjoy them, imagine this home, 4 or 5 bed, 2 bath, dining, living, walk out family room, deck and covered front porch, space is not an issue inside or out on this triple lot! Located in Beautiful Lakeshore Resort, next-door to 5260 acre Brookville Lake! If you love being out on the boat, skiing, fishing and just all-around water fun then this place is for you. And the outdoor entertainment doesn't stop there, 13,500 acres of woods, hiking trails, beaches, bike trails, canoeing, you name it! This is one of the most Beautiful hidden Gems and largest outdoor playgrounds in the Tri-state. And only 45 minutes from downtown Cincinnati, Hamilton, Richmond an hour from Indy. Bring the boat, the golf cart, the kids and family and make memories. No need to pull the boat or towns back and forth, no more storage fees. One of the few campgrounds that you own it lock stock and barrel come and go year round. Roof 2 years old , completely remodeled 2022/23
-
2025-09-11status Pending
-
2025-07-29status Active
-
2025-07-28status Pending
-
2025-07-03price $120,000
-
2025-05-25$139,000 Active
-
2024-05-25$149,000 Active
ⓘ Source: listings_history table (triggers on properties + properties_extension) + one-shot
backfill from property_details.listing_events for pre-trigger history.
Tax reassessment forecast IN · Partial reset (capped growth)
- Current annual tax
- $804 · $67/mo
- Projected year-2 tax
- $912 · $76/mo
- Expected delta
- +$108/yr (+$9/mo · 13.5%)
ⓘ Screening estimate from a state-policy table — verify with the county assessor before closing.
Climate risk First Street
- Flood 1/10 Low FEMA zone X (unshaded) · 0% chance over 30 yrs
- Wildfire 1/10 Low
- Heat 3/10 Moderate 7 d/yr ≥102°F today · 19 d/yr by 30 yrs out
- Wind 2/10 Low 100% chance of damaging wind over 30 yrs
- Air quality 2/10 Low 0 unhealthy d/yr today · 1 by 30 yrs out
Nearby sold comps map
Loading sold comps map…
Walkable amenities ~0.75 mi
Loading nearby amenities…
Taxation est. · year 1
- Rental income
- $15,573
- − Mortgage interest
- −$6,722
- − Property taxes
- −$804
- − Insurance
- −$600
- − Repairs & maintenance
- −$1,246
- − Management
- −$1,246
- − Depreciation
- −$3,491
- Taxable income
- $1,465
- Est. tax owed @ 24.0%
- −$352
- After-tax cash flow
- $2,996/yr
For passive investors: Depreciation is non-cash, so a rental often shows a tax loss while cash-flowing — sheltering income. Rental losses are passive: they offset passive income freely, and up to $25,000/yr can offset ordinary (W-2) income if you actively participate and your MAGI is under $100k (phasing out to $0 by $150k); unused losses carry forward. On sale, claimed depreciation is recaptured at up to 25%, and gains may owe capital-gains tax (a 1031 exchange can defer both). Figures are a year-1 estimate at your 24.0% rate — not tax advice; consult a CPA.
Schools (NCES district)
No district data.
Livability — Lakeshore Resort
No livability data for this city. (Only ~50 U.S. cities are tracked.)
Census & demographics
- Census place
- Lakeshore Resort, IN
- Population (ZIP)
- 10,891
Population outlook (Franklin County) Hauer SSP2
- Today (2025)
- 22,796 people
- By 2030
- 22,556 · -1.1%
- By 2040
- 21,762 · -4.5%
- By 2050
- 20,575 · -9.7%
- By 2075
- 17,810 · -21.9%
- By 2100
- 13,698 · -39.9%
Race, ethnicity, and origin ACS 2023
- Neighborhood character
- Predominantly White (96%)
- Race & ethnicity
- White 96% Two or more races 2% Hispanic / Latino 2%
- Common ancestry
- Slovak 2% Italian 1% Romanian 1%
- Foreign-born
- 2% · Vietnam, Canada
- Languages at home
- 96% English-only · Korean 2% Vietnamese 1% Russian/Polish/Slavic 1%
Political lean MEDSL · Franklin
- 2024 margin
- Solid R (+64.4) · D 17.1% · R 81.5% · Other 1.3%
- 2008→2024 swing
- -30.3pp toward R · 2008: -34.1pp · 2024: -64.4pp
- All cycles
- 2024: R+64.4 2020: R+63.0 2016: R+60.9 2012: R+42.8 2008: R+34.1
Not yet ingested
- Civics
- —
Market trends
- HPI YoY
- ▼ -82.81%
- Current HPI
- 223.2183
- Rent YoY
- —
- Metro
- —
- State GDP YoY
- ▲ 2.90%
- F500 in state
- 18
Industry mix (Fortune 500 HQ in IN)
| Industry | F500 HQs | Revenue |
|---|---|---|
| Industrial Machinery | 2 | $37B |
|
||
| Healthcare | 1 | $177B |
|
||
| Pharmaceuticals | 1 | $45B |
|
||
| Metals / Steel | 1 | $18B |
|
||
| Agriculture | 1 | $17B |
|
||
| Packaging | 1 | $12B |
|
||
Price history
-19.5% since first listed7 events — show timeline
- 2026-03-20 Listed $120,000 SEIBR
- 2025-09-11 Pending — SEIBR
- 2025-07-29 Relisted — SEIBR
- 2025-07-28 Pending — SEIBR
- 2025-07-03 Price Changed $120,000 SEIBR
- 2025-05-25 Listed $139,000 SEIBR
- 2024-05-25 Listed $149,000 SEIBR
Property tax history
+7.5%/yrLatest (2024): $804 · -1.7% YoY. Source: county tax records.
Cash-flow waterfall
monthlySold comps — $/sqft
last 12 mo · ≤1 miLoading sold comps…