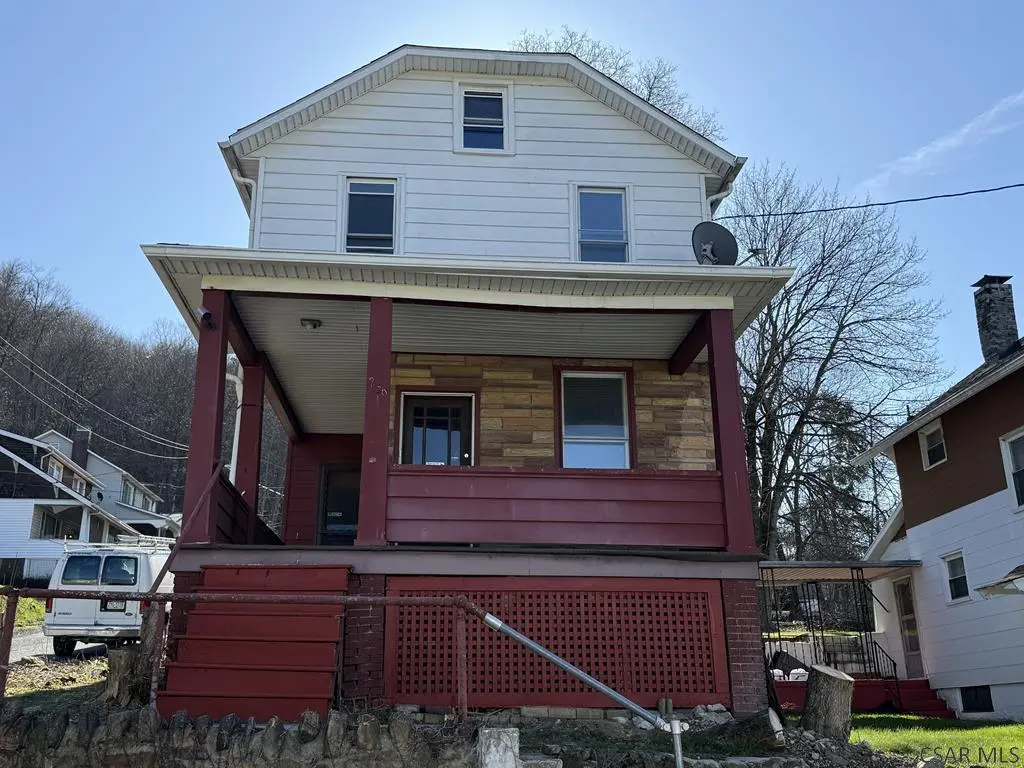
256 Cypress Ave · Johnstown, PA
Flood risk 1/10 · Minimal
- FEMA flood zone
- X (unshaded)
- Chance of flooding over 30 yrs
- 0.0%
- Est. flood insurance / yr
- $473 – $860
Fire risk 1/10 · Minimal
- Est. fire insurance / yr
- $511 – $949
Heat risk 3/10 · Minor
- Hot days now (above 93°F)
- 7 days/yr
- Hot days in 30 yrs
- 18 days/yr
Wind risk 2/10 · Minimal
- Chance of severe wind over 30 yrs
- —
Air-quality risk 2/10 · Minimal
- Unhealthy air days now
- 1 days/yr
- Unhealthy air days in 30 yrs
- 2 days/yr
Risk factors via First Street. Map © Google.
Why this score? — see what drove the B+ grade
The composite is a weighted blend of 9 inputs, each scored 0–100. Each bar is that input's sub-score; the figure is the points it added to the 100-point composite (weight × sub-score).
- Cash flow +30.0/30.0
- ARV discount +15.0/15.0
- 1% rule +10.0/10.0
- DSCR +10.0/10.0
- Livability +3.9/5.0
- Rent growth +2.5/5.0
- Condition / age +2.5/5.0
- Schools +1.3/10.0
- Appreciation +0.0/10.0
$42,900
🖨 Deal sheet (PDF) 📄 Offer letter ✓ Due diligence
Listing remarks MLS
WHY PAY RENT WHEN YOU CAN OWN. .. this nicely maintained 3 bedroom home in the City of Johnstown's 17th Ward is ready for a new owner. The main floor includes living room with WW carpet and panelled walls; dining room with open staircase, WW carpet, gas fireplace, and panelled walls: and updated kitchen with pantry, laminate floor plus range/oven and microwave. The upstairs provides 3 bedrooms and full bath with vanity, tub, and laminate floor. Gas hot water heat, updated 100 amp electrical, new hot water tank, and plenty of storage in basement. Covered porch, corner lot, and so much more. Don't wait - call today for all the details, to receive your tour packet, and to schedule your personal tour!
Key facts
- Covered porch
- Plenty of storage
- Gas fireplace
Tags
Neighborhood map
What this means for you Summary
Snapshot
- This is a 3-bed/1.0-bath single-family listed at $43k.
Deal economics
- At list price, monthly cash flow is $446 ($5k/yr) — positive.
- The deal already cash-flows at list — no discount required.
- Meets the 1% rule at list price ($979 rent vs $43k).
- Recommended offer: $40k (6.0% below list) — sets the bar for market timing.
- Cap rate 18.8% vs local median 15.0% in Johnstown — meaningfully above typical; check what's discounted (condition, days-on-market, listing class) to confirm the premium yield is real.
Location & tenants
- Location reads 77/100 on livability (#363 in PA, #3,168 nationally) — a middle-class / working-renter tenant base. Strengths: amenities A+, commute A+, cost of living A+; Watch: schools D+, crime F, employment F.
- Greater Johnstown SD (urban): math 9% / reading 25% proficiency, ranked #509 of 539 in PA (top 94%) — low school quality limits family demand, transient renter base, plan for 1-2y turnover; 80% free/reduced lunch — lower-income household profile, screen leases tightly.
- Market conditions: 64 active listings in the ZIP; 8 comparable units currently listed for rent nearby; rentals lingering (median 45d on market — plan ~5-8 weeks vacancy on turnover, expect pricing pressure); 88% of comp listings sitting > 30 days — soft ceiling on asking rent; lower-income renter base — watch delinquency; 64 units permitted in Cambria County in 2024 (0 in 5+ unit buildings).
Forward outlook
- Local home prices are declining (-3.0%/yr); year-one equity from $297 of loan paydown is wiped out by about $1k of value loss. Plan a longer hold.
- Cambria County population projected at -28% by 2050 — secular population decline; favor cash flow + early exit over multi-decade hold.
- At projected returns (-3.0% appreciation + 3.0% rent growth), your $12k cash investment doubles in ~3 years — after that, you're playing with house money.
Negotiation context
- It's been on market 88 days — a 6% lower offer ($40k) is reasonable based on typical stale-listing flexibility.
- 2 sale attempts since 27y ago; this cycle's ask has dropped $7k (14%) from the opening price — seller is motivated, your offer sets the floor, not the list.
- Current owner paid $26k; list at $43k implies a 62% gain — meaningful room to come down on a strong offer.
Questions for the listing agent
- It's been on market 88 days. Have you received any prior offers? Is the seller open to a 6% concession, seller financing, or rate buy-down credit?
- Why hasn't it sold? Are there any deal-killer items the seller is aware of (foundation, flood, title, zoning, code violations)?
- Is there a deadline driving the sale (1031 exchange, divorce, estate, relocation)? That informs how much negotiation room exists.
- Schools are D-rated, which usually means shorter tenancies and higher turnover. Who's the typical renter profile here, and what's been the actual vacancy rate?
- Crime grade is F in this area — have there been break-ins, vandalism, or insurance claims at this property in the last 3 years? What carrier currently insures it and at what premium?
- What's the average days-on-market for RENTAL listings here right now (not sales)? A rising rental-DOM trend means longer vacancies and softer asking-rent achievability than the comps imply.
- What's the recent tenant-quality profile in this submarket — average credit score on applications, eviction rate, late-payment / NSF rate, and stable-employment percentage? A property-management company in the area should have these aggregated.
- How much new for-sale + rental construction is in the pipeline within 1–3 miles? Heavy new supply typically softens prices + rents 12–24 months out; constrained supply supports both.
Investment metrics
- 1% rule
- 2.28% ✓
- Cap rate
- 18.78%
- Cash-on-cash
- 44.59%
- DSCR
- 2.98
- GRM
- 3.7
CMA / ARV
- ARV (median comp)
- $52,508
- List price
- $42,900
- Delta
- -18.30%
- Verdict
- UNDERPRICED
- Comps
- 20 within 1.0 mi
Show comp detail 12 sales within ~0.75 mi
| Address | Dist | Beds/Ba | Sqft | Sold | Price | $/sf | Match |
|---|---|---|---|---|---|---|---|
| 550 Linden Ave | 0.36mi | 3/1.0 | 1,248 (+4%) | 11mo | $68,000 | $54 | 68 |
| 157 Lohr Pl | 0.53mi | 4/1.0 (+1) | 1,183 (-2%) | 1mo | $54,250 | $46 | 66 |
| 394 Ohio St | 0.47mi | 3/2.0 | 1,176 (-2%) | 7mo | $39,000 | $33 | 64 |
| 551 Russell Ave | 0.38mi | 2/1.0 (-1) | 1,308 (+9%) | 1mo | $52,500 | $40 | 62 |
| 652 Russell Ave | 0.52mi | 3/1.0 | 1,312 (+9%) | 0mo | $70,000 | $53 | 60 |
| 525 Woodland Ave | 0.40mi | 3/1.0 | 1,324 (+10%) | 6mo | $15,500 | $12 | 60 |
| 926 Bloom St | 0.50mi | 2/1.0 (-1) | 1,148 (-5%) | 5mo | $30,000 | $26 | 60 |
| 180 David St | 0.72mi | 3/1.0 | 1,300 (+8%) | 7mo | $40,000 | $31 | 47 |
| 108 Woodruff St | 0.65mi | 2/1.0 (-1) | 1,120 (-7%) | 8mo | $25,000 | $22 | 46 |
| 209 Blue Diamond St | 0.65mi | 3/1.5 | 1,364 (+13%) | 4mo | $78,900 | $58 | 42 |
| 100 Donna Dr | 0.72mi | 4/2.0 (+1) | 1,312 (+9%) | 1mo | $115,000 | $88 | 41 |
| 800 Highland Ave | 0.69mi | 4/1.0 (+1) | 1,320 (+10%) | 7mo | $45,000 | $34 | 41 |
Match score weights: distance 35% · size 25% · config 20% · recency 20%. Top-matched comps best support the ARV.
Projected returns pro-forma
-3.0% appreciation · 3.0% rent growth · sell at horizon
- IRR
- 41.7%
- Equity multiple
- 2.79×
- Total profit
- $21,512
- Equity at exit
- $6,397
- IRR
- 47.9%
- Equity multiple
- 5.62×
- Total profit
- $55,476
- Equity at exit
- $3,709
Cash invested: $12,012 (down + closing). Projections, not guarantees.
Landlord ↔ Tenant lean methodology
- Overall (STATE)
- 62 Landlord-Friendly
- State Pennsylvania
- 62 Landlord-Friendly · EVEN
- County
- — inherits STATE
- City
- — inherits STATE
ZIP-level market 15902
- Home prices YoY
- -28.8%
- Active inventory
- 64
- Price-to-rent
- 3.7×
Monthly cashflow live
- Estimated rent
- $979 high interval (Pro) →
- Mortgage (P&I)
- −$225
- Tax from tax record
- −$84 /mo · $1,008/yr
- Insurance
- −$18
- HOA
- −$0
- Vacancy / Maint / Mgmt
- −$206
- Net cashflow
- $446
Break-even live
Sensitivity live
| Price | -10% $471 | -5% $459 | +0% $446 | +5% $434 | +10% $422 |
|---|---|---|---|---|---|
| Rent | -10% $369 | -5% $408 | +0% $446 | +5% $485 | +10% $524 |
| Rate | -1.0pp $468 | -0.5pp $457 | base $446 | +0.5pp $435 | +1.0pp $424 |
UW: 25.0% down · 7.5% · 30yr · 1.5% tax · 5.0% vac · 8.0% maint · 8.0% mgmt
Financing live
Cash to close
- Down payment
- $10,725
- Closing costs
- $1,287
- Reserves months
- —
- Total cash needed
- —
Loan-product check · same deal, 3 products live
Conventional
25% down · 7.5% · 30yr
- Down + closing
- —
- Monthly P&I
- —
- Monthly cashflow
- —
- DSCR
- —
- Eligible?
- —
Personal DTI + credit; lowest rate.
DSCR
20% down · 8.5% · 30yr
- Down + closing
- —
- Monthly P&I
- —
- Monthly cashflow
- —
- DSCR
- —
- Eligible?
- —
No personal income docs; deal must DSCR.
Hard money
10% down · 12.0% · 12mo
- Down + closing
- —
- Monthly P&I
- —
- Monthly cashflow
- —
- DSCR
- —
- Eligible?
- —
Short-term bridge; refi at stabilization.
Rent comps 8 comps
| Address | Beds | Baths | Sqft | Rent | $/sqft | DOM | Units | Dist |
|---|---|---|---|---|---|---|---|---|
| 619 Grove Ave Johnstown, PA | 2.0 | 2.0 | 1100 | $1,050 | $0.95 | 44d | 1 | 0.42mi |
| 906 Lemon St Johnstown, PA | 3.0 | 1.0 | 1128 | $750 | $0.66 | 44d | 1 | 0.61mi |
| 1201 Heeney Ave Johnstown, PA | 1.0–3.0 | 1.0 | 750 | $1,050 | $1.40 | 5d | 1 | 0.73mi |
| 412 Oak St Unit 1 Johnstown, PA | 2.0 | 1.0 | 1100 | $900 | $0.82 | 44d | 1 | 0.90mi |
| 129-131 Plainfield Ave Johnstown, PA | 3.0 | 1.0 | 1300 | $850 | $0.65 | 44d | 1 | 0.95mi |
| 550 Ferndale Ave Johnstown, PA | 3.0 | 1.0 | 1300 | $1,100 | $0.85 | 44d | 1 | 0.97mi |
| 553 Vickroy Ave #555 Johnstown, PA | 3.0 | 1.0 | 1300 | $985 | $0.76 | 44d | 1 | 1.00mi |
| 522 Vickroy Ave Johnstown, PA | 3.0 | 1.0 | 1125 | $850 | $0.76 | 44d | 1 | 1.02mi |
Listing history 20 events
-
2026-06-19days on market $42,900 Active 88 DOM
-
2026-06-18days on market $42,900 Active 87 DOM
-
2026-06-17days on market $42,900 Active 86 DOM
-
2026-06-17price $42,900 Active 85 DOM
-
2026-06-16days on market $47,500 Active 85 DOM
-
2026-06-15days on market $47,500 Active 84 DOM
-
2026-06-14days on market $47,500 Active 82 DOM
-
2026-06-12days on market $47,500 Active 81 DOM
-
2026-06-09days on market $47,500 Active 78 DOM
-
2026-06-08days on market $47,500 Active 77 DOM
-
2026-06-07days on market $47,500 Active 76 DOM
-
2026-06-05days on market $47,500 Active 73 DOM
-
2026-06-02days on market $47,500 Active 71 DOM
-
2026-06-01days on market $47,500 Active 70 DOM
-
2026-05-31days on market $47,500 Active 69 DOM
-
2026-05-30days on market $47,500 Active 68 DOM
-
2026-03-23$49,900 Active 706-char remark
Show marketing remark (706 chars)
WHY PAY RENT WHEN YOU CAN OWN. .. this nicely maintained 3 bedroom home in the City of Johnstown's 17th Ward is ready for a new owner. The main floor includes living room with WW carpet and panelled walls; dining room with open staircase, WW carpet, gas fireplace, and panelled walls: and updated kitchen with pantry, laminate floor plus range/oven and microwave. The upstairs provides 3 bedrooms and full bath with vanity, tub, and laminate floor. Gas hot water heat, updated 100 amp electrical, new hot water tank, and plenty of storage in basement. Covered porch, corner lot, and so much more. Don't wait - call today for all the details, to receive your tour packet, and to schedule your personal tour!
-
1999-10-25soldstatus $26,500
-
1999-10-23soldstatus $26,500
-
1999-08-16$29,900
ⓘ Source: listings_history table (triggers on properties + properties_extension) + one-shot
backfill from property_details.listing_events for pre-trigger history.
Tax reassessment forecast PA · Partial reset (capped growth)
- Current annual tax
- $1,008 · $84/mo
- Projected year-2 tax
- $1,008 · $84/mo
- Expected delta
- $0/yr ($0/mo · 0.0%)
ⓘ Screening estimate from a state-policy table — verify with the county assessor before closing.
Climate risk First Street
- Flood 1/10 Low FEMA zone X (unshaded) · 0% chance over 30 yrs
- Wildfire 1/10 Low
- Heat 3/10 Moderate 7 d/yr ≥93°F today · 18 d/yr by 30 yrs out
- Wind 2/10 Low
- Air quality 2/10 Low 1 unhealthy d/yr today · 2 by 30 yrs out
Nearby sold comps map
Loading sold comps map…
Walkable amenities ~0.75 mi
Loading nearby amenities…
Taxation est. · year 1
- Rental income
- $11,745
- − Mortgage interest
- −$2,403
- − Property taxes
- −$1,008
- − Insurance
- −$214
- − Repairs & maintenance
- −$940
- − Management
- −$940
- − Depreciation
- −$1,248
- Taxable income
- $4,992
- Est. tax owed @ 24.0%
- −$1,198
- After-tax cash flow
- $4,158/yr
For passive investors: Depreciation is non-cash, so a rental often shows a tax loss while cash-flowing — sheltering income. Rental losses are passive: they offset passive income freely, and up to $25,000/yr can offset ordinary (W-2) income if you actively participate and your MAGI is under $100k (phasing out to $0 by $150k); unused losses carry forward. On sale, claimed depreciation is recaptured at up to 25%, and gains may owe capital-gains tax (a 1031 exchange can defer both). Figures are a year-1 estimate at your 24.0% rate — not tax advice; consult a CPA.
Schools (NCES district)
- District
- Greater Johnstown SD
- NCES district ID
- 4210950
- Math proficiency
- 9% ▼ -6.00%
- Reading proficiency
- 25% ▼ -6.00%
- Median HH income
- $27,890
- Composite
- 13.25/100
- National rank
- #9550
- State rank
- #509 of 539 in PA
Livability — Johnstown
- Score
- 77/100
- State rank
- #363
- US rank
- #3168
Category grades
Schools grade is shown separately in the Schools card above.
Census & demographics
- Census place
- Johnstown, PA
- County
- Cambria County · 30,791 people
- City population
- 30,791
- Metro
- Johnstown, PA
- Population (ZIP)
- 11,462
- Household income
- $44,215
- Rent vs Own
- Severe rent burden
- 266.0
Population outlook (Cambria County) Hauer SSP2
- Today (2025)
- 122,754 people
- By 2030
- 115,827 · -5.6%
- By 2040
- 101,309 · -17.5%
- By 2050
- 88,379 · -28.0%
- By 2075
- 65,237 · -46.9%
- By 2100
- 46,909 · -61.8%
Race, ethnicity, and origin ACS 2023
- Neighborhood character
- Predominantly White (75%)
- Race & ethnicity
- White 75% Two or more races 14% Black 8% Hispanic / Latino 3%
- Common ancestry
- Romanian 7% Slovak 2% Hungarian 2%
- Foreign-born
- 2% · Canada
- Languages at home
- 97% English-only · Spanish 2%
Political lean MEDSL · Cambria
- 2024 margin
- Solid R (+39.7) · D 29.8% · R 69.5%
- 2008→2024 swing
- -40.4pp toward R · 2008: 0.7pp · 2024: -39.7pp
- All cycles
- 2024: R+39.7 2020: R+37.3 2016: R+37.8 2012: R+17.8 2008: D+0.7
Not yet ingested
- Civics
- —
Market trends
- HPI YoY
- ▼ -43.86%
- Current HPI
- 108.2198
- Rent YoY
- —
- Metro
- Johnstown, PA
- State GDP YoY
- ▲ 1.68%
- F500 in state
- 34
Industry mix (Fortune 500 HQ in PA)
| Industry | F500 HQs | Revenue |
|---|---|---|
| Healthcare | 2 | $309B |
|
||
| Insurance | 2 | $27B |
|
||
| Telecommunications / Media | 1 | $124B |
|
||
| Industrial Distribution | 1 | $22B |
|
||
| Financial Services | 1 | $20B |
|
||
| Chemicals / Materials | 1 | $18B |
|
||
Price history
+66.9% since first listed4 events — show timeline
- 2026-03-23 Listed $49,900 CSMLS
- 1999-10-25 Sold (MLS) $26,500 CSMLS
- 1999-10-23 Sold (Public Records) $26,500 Public Records
- 1999-08-16 Listed $29,900 CSMLS
Property tax history
+0.2%/yrLatest (2026): $1,008 · +0.0% YoY. Source: county tax records.
Cash-flow waterfall
monthlySold comps — $/sqft
last 12 mo · ≤1 miLoading sold comps…