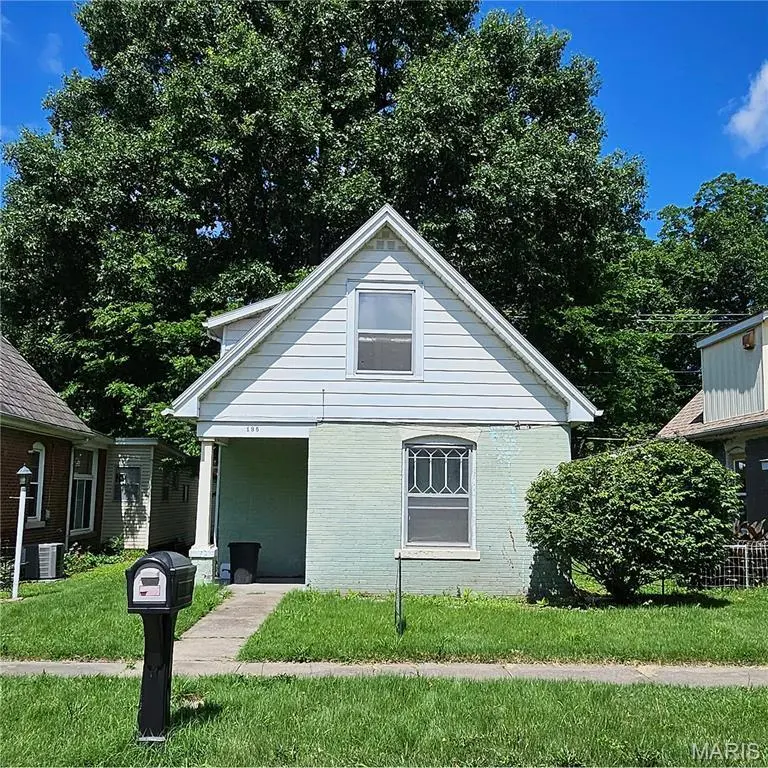
135 S Park St · Cape Girardeau, MO
Flood risk 4/10 · Minor
- FEMA flood zone
- X (unshaded)
- Chance of flooding over 30 yrs
- 0.2%
- Est. flood insurance / yr
- $507 – $1,088
Fire risk 1/10 · Minimal
- Est. fire insurance / yr
- $1,054 – $1,958
Heat risk 6/10 · Moderate
- Hot days now (above 108°F)
- 7 days/yr
- Hot days in 30 yrs
- 21 days/yr
Wind risk 2/10 · Minimal
- Chance of severe wind over 30 yrs
- 3.0%
Air-quality risk 2/10 · Minimal
- Unhealthy air days now
- 0 days/yr
- Unhealthy air days in 30 yrs
- 2 days/yr
Risk factors via First Street. Map © Google.
Why this score? — see what drove the B- grade
The composite is a weighted blend of 9 inputs, each scored 0–100. Each bar is that input's sub-score; the figure is the points it added to the 100-point composite (weight × sub-score).
- Cash flow +30.0/30.0
- 1% rule +10.0/10.0
- DSCR +10.0/10.0
- ARV discount +7.5/15.0
- Livability +3.2/5.0
- Schools +3.1/10.0
- Rent growth +2.5/5.0
- Condition / age +2.5/5.0
- Appreciation +0.0/10.0
$39,900
🖨 Deal sheet 📄 Offer letter ✓ Due diligence
Key facts
- 3,615 sq ft lot
- Built 1920
Property features AI
Finance
- Other: Above-grade finished area reported as 1,062 (public records); Lot dimensions approximately 35 x 100 (0.083 acre)
- Financial info: Lease not considered; No second mortgage indicated
Exterior
- Utilities: Public water; Public sewer; Electric service (Ameren); Cable available, phone available, electricity connected, natural gas connected, water connected, sewer connected
- Home design: Single-family residence (house); Two levels; Private ownership; Property listed as fixer
- Construction: Brick, frame, and vinyl siding construction; Asphalt roof
- Exterior features: Back yard, front yard; City lot; Asphalt road frontage on a city street
Interior
- Kitchen: Kitchen on main level
- Bedrooms: Two bedrooms located on the upper level
- Flooring: Carpet; Ceramic tile; Vinyl
- Bathrooms: One full bathroom; One half bathroom (main level)
- Heating & cooling: Forced air heating (natural gas); Window AC units
- Interior features: Carpet, ceramic tile, and vinyl flooring; 8 total rooms
- Laundry & utility: Main-level laundry room
Neighborhood map
What this means for you Summary
Snapshot
- This is a 2-bed/1.5-bath single-family listed at $40k.
Deal economics
- At list price, monthly cash flow is $478 ($6k/yr) — positive.
- The deal already cash-flows at list — no discount required.
- Meets the 1% rule at list price ($949 rent vs $40k).
- Cap rate 20.7% vs local median 3.9% in Cape Girardeau — top-decile yield for the area; either an underpriced asset or a hidden risk that comps aren't pricing in. Stress-test before assuming the spread holds.
Location & tenants
- Location reads 64/100 on livability (#297 in MO) — a middle-class / working-renter tenant base. Strengths: cost of living A+, housing A+; Watch: employment D+, crime F, amenities F.
- Cape Girardeau 63 (urban): math 33% / reading 42% proficiency, ranked #188 of 324 in MO (top 58%) — families likely to look elsewhere, expect single-tenant / working-renter base with shorter leases; 60% free/reduced lunch — lower-income household profile, screen leases tightly.
- Zoned schools: Franklin Elem. (math 32% / reading 37%, grade F, #676 of 1,115 statewide, top 66%, 217 students, 0% FRL); Central High (math 36% / reading 47%, grade F, #234 of 521 statewide, top 45%, 1,341 students, 0% FRL) — zoned schools average 0% FRL vs 60% district-wide (60 pts lower); this property's tenant base skews higher-income than the district average.
- Market conditions: 41 active listings in the ZIP; 1 comparable units currently listed for rent nearby; lower-income renter base — watch delinquency; 81 units permitted in Cape Girardeau County in 2024 (0 in 5+ unit buildings).
Forward outlook
- Local home prices are declining (-3.0%/yr); year-one equity from $276 of loan paydown is wiped out by about $1k of value loss. Plan a longer hold.
- Cape Girardeau County population projected at +17% by 2050 — long-run rental-demand tailwind backs the buy-and-hold thesis.
- At projected returns (-3.0% appreciation + 3.0% rent growth), your $11k cash investment doubles in ~3 years — after that, you're playing with house money.
Negotiation context
- Only 1 days on market — expect competitive offers; lowballing is unlikely to land.
Risks & watch-outs
- Watch-outs: built in 1920 — expect roof / HVAC / electrical / plumbing capex.
- Climate carrying-cost: extreme-heat days projected 7→21/yr by 2055 (HVAC capex compounding) — expect insurance premiums to compound above CPI over the hold.
Questions for the listing agent
- Built in 1920 — when were the roof, HVAC, electrical panel, plumbing, and water heater last replaced?
- Is there a deadline driving the sale (1031 exchange, divorce, estate, relocation)? That informs how much negotiation room exists.
- Crime grade is F in this area — have there been break-ins, vandalism, or insurance claims at this property in the last 3 years? What carrier currently insures it and at what premium?
- What's the average days-on-market for RENTAL listings here right now (not sales)? A rising rental-DOM trend means longer vacancies and softer asking-rent achievability than the comps imply.
- What's the recent tenant-quality profile in this submarket — average credit score on applications, eviction rate, late-payment / NSF rate, and stable-employment percentage? A property-management company in the area should have these aggregated.
- How much new for-sale + rental construction is in the pipeline within 1–3 miles? Heavy new supply typically softens prices + rents 12–24 months out; constrained supply supports both.
Investment metrics
- 1% rule
- 2.38% ✓
- Cap rate
- 20.68%
- Cash-on-cash
- 51.38%
- DSCR
- 3.29
- GRM
- 3.5
CMA / ARV
- ARV (on-the-fly)
- $121,068
- Comps found
- 12
Show comp detail 12 sales within ~0.75 mi
| Address | Dist | Beds/Ba | Sqft | Sold | Price | $/sf | Match |
|---|---|---|---|---|---|---|---|
| 107 S Park St | 0.05mi | 2/2.0 | 1,034 (-3%) | 2mo | $55,000 | $53 | 90 |
| 217 S Ellis St | 0.37mi | 2/1.0 | 1,058 (-0%) | 0mo | $84,900 | $80 | 80 |
| 1536 Whitener St | 0.37mi | 2/2.0 | 1,008 (-5%) | 1mo | $109,900 | $109 | 71 |
| 1548 Whitener St | 0.38mi | 2/1.0 | 996 (-6%) | 2mo | $139,900 | $140 | 69 |
| 1522 Independence St | 0.31mi | 2/1.0 | 967 (-9%) | 3mo | $79,900 | $83 | 67 |
| 421 Koch Ave | 0.53mi | 3/1.0 (+1) | 1,065 (+0%) | 2mo | $154,900 | $145 | 66 |
| 1525 Good Hope St | 0.23mi | 2/1.0 | 950 (-10%) | 4mo | $109,900 | $116 | 66 |
| 114 S Pacific St | 0.31mi | 3/1.0 (+1) | 1,200 (+13%) | 0mo | $105,000 | $88 | 57 |
| 329 Albert St | 0.58mi | 1/1.0 (-1) | 1,008 (-5%) | 4mo | $114,900 | $114 | 54 |
| 1727 Whitener St | 0.54mi | 3/1.5 (+1) | 1,175 (+11%) | 1mo | $235,000 | $200 | 51 |
| 313 S Spring St | 0.71mi | 3/1.0 (+1) | 1,120 (+6%) | 3mo | $150,000 | $134 | 48 |
| 409 Albert St | 0.60mi | 3/1.0 (+1) | 1,216 (+14%) | 3mo | $115,000 | $95 | 38 |
Match score weights: distance 35% · size 25% · config 20% · recency 20%. Top-matched comps best support the ARV.
Projected returns pro-forma
-3.0% appreciation · 3.0% rent growth · sell at horizon
- IRR
- 49.3%
- Equity multiple
- 3.15×
- Total profit
- $24,014
- Equity at exit
- $5,949
- IRR
- 54.8%
- Equity multiple
- 6.39×
- Total profit
- $60,190
- Equity at exit
- $3,450
Cash invested: $11,172 (down + closing). Projections, not guarantees.
Landlord ↔ Tenant lean methodology
- Overall (STATE)
- 81 Strongly Landlord-Friendly
- State Missouri
- 81 Strongly Landlord-Friendly · R+10
- County
- — inherits STATE
- City
- — inherits STATE
ZIP-level market 63703
- Home prices YoY
- -29.3%
- Active inventory
- 41
- Price-to-rent
- 3.5×
Monthly cashflow live
- Estimated rent
- $949 medium interval (Pro) →
- Mortgage (P&I)
- −$209
- Tax from tax record
- −$45 /mo · $544/yr
- Insurance
- −$17
- HOA
- −$0
- Vacancy / Maint / Mgmt
- −$199
- Net cashflow
- $478
Break-even live
UW: 25.0% down · 7.5% · 30yr · 1.5% tax · 5.0% vac · 8.0% maint · 8.0% mgmt
Financing live
Cash to close
- Down payment
- $9,975
- Closing costs
- $1,197
- Reserves months
- —
- Total cash needed
- —
Loan-product check · same deal, 3 products live
Conventional
25% down · 7.5% · 30yr
- Down + closing
- —
- Monthly P&I
- —
- Monthly cashflow
- —
- DSCR
- —
- Eligible?
- —
Personal DTI + credit; lowest rate.
DSCR
20% down · 8.5% · 30yr
- Down + closing
- —
- Monthly P&I
- —
- Monthly cashflow
- —
- DSCR
- —
- Eligible?
- —
No personal income docs; deal must DSCR.
Hard money
10% down · 12.0% · 12mo
- Down + closing
- —
- Monthly P&I
- —
- Monthly cashflow
- —
- DSCR
- —
- Eligible?
- —
Short-term bridge; refi at stabilization.
Rent comps 1 comps
| Address | Beds | Baths | Sqft | Rent | $/sqft | DOM | Units | Dist |
|---|---|---|---|---|---|---|---|---|
| Cape Girardeau Cape Girardeau, MO | 1.0–3.0 | 1.0–2.0 | 931 | $800 | $0.86 | 43d | 7 | 1.02mi |
Listing history 1 events
-
2026-06-13$39,900 Pending 1 DOM
ⓘ Source: listings_history table (triggers on properties + properties_extension) + one-shot
backfill from property_details.listing_events for pre-trigger history.
Tax reassessment forecast MO · Resets to sale price
- Current annual tax
- $544 · $45/mo
- Projected year-2 tax
- $544 · $45/mo
- Expected delta
- $0/yr ($0/mo · 0.0%)
ⓘ Screening estimate from a state-policy table — verify with the county assessor before closing.
Climate risk First Street
- Flood 4/10 Moderate FEMA zone X (unshaded) · 20% chance over 30 yrs
- Wildfire 1/10 Low
- Heat 6/10 Major 7 d/yr ≥108°F today · 21 d/yr by 30 yrs out
- Wind 2/10 Low 3% chance of damaging wind over 30 yrs
- Air quality 2/10 Low 0 unhealthy d/yr today · 2 by 30 yrs out
Nearby sold comps map
Loading sold comps map…
Walkable amenities ~0.75 mi
Loading nearby amenities…
Taxation est. · year 1
- Rental income
- $11,386
- − Mortgage interest
- −$2,235
- − Property taxes
- −$544
- − Insurance
- −$200
- − Repairs & maintenance
- −$911
- − Management
- −$911
- − Depreciation
- −$1,161
- Taxable income
- $5,425
- Est. tax owed @ 24.0%
- −$1,302
- After-tax cash flow
- $4,439/yr
For passive investors: Depreciation is non-cash, so a rental often shows a tax loss while cash-flowing — sheltering income. Rental losses are passive: they offset passive income freely, and up to $25,000/yr can offset ordinary (W-2) income if you actively participate and your MAGI is under $100k (phasing out to $0 by $150k); unused losses carry forward. On sale, claimed depreciation is recaptured at up to 25%, and gains may owe capital-gains tax (a 1031 exchange can defer both). Figures are a year-1 estimate at your 24.0% rate — not tax advice; consult a CPA.
Schools (NCES district)
- District
- Cape Girardeau 63
- NCES district ID
- 2907120
- Math proficiency
- 33% ▼ -6.00%
- Reading proficiency
- 42% ▼ -7.00%
- Median HH income
- $40,543
- Composite
- 31.49/100
- National rank
- #5974
- State rank
- #188 of 324 in MO
Livability — Cape Girardeau
- Score
- 64/100
- State rank
- #297
- US rank
- #13759
Category grades
Schools grade is shown separately in the Schools card above.
Census & demographics
- Census place
- Cape Girardeau, MO
- County
- Cape Girardeau County · 75,175 people
- City population
- 47,546
- Metro
- Cape Girardeau, MO-IL
- Population (ZIP)
- 8,201
- Household income
- $38,695
- Rent vs Own
- Severe rent burden
- 617.0
Population outlook (Cape Girardeau County) Hauer SSP2
- Today (2025)
- 84,807 people
- By 2030
- 88,016 · +3.8%
- By 2040
- 93,914 · +10.7%
- By 2050
- 99,541 · +17.4%
- By 2075
- 114,527 · +35.0%
- By 2100
- 121,718 · +43.5%
Race, ethnicity, and origin ACS 2023
- Neighborhood character
- Predominantly White (69%)
- Race & ethnicity
- White 69% Black 19% Two or more races 5% Hispanic / Latino 5%
- Hispanic origin (detail)
- Mexican 4% Puerto Rican 1%
- Common ancestry
- Slovak 2% Lithuanian 2% Italian 2%
- Foreign-born
- 4% · Canada, Jamaica
- Languages at home
- 94% English-only · Spanish 3% Russian/Polish/Slavic 1% Other Indo-European 1%
Political lean MEDSL · Cape Girardeau
- 2024 margin
- Solid R (+46.5) · D 26.2% · R 72.7% · Other 1.1%
- 2008→2024 swing
- -12.9pp toward R · 2008: -33.6pp · 2024: -46.5pp
- All cycles
- 2024: R+46.5 2020: R+45.0 2016: R+50.1 2012: R+43.8 2008: R+33.6
Not yet ingested
- Civics
- —
Market trends
- HPI YoY
- ▼ -63.10%
- Current HPI
- 152.013
- Rent YoY
- —
- Metro
- Cape Girardeau, MO-IL
- State GDP YoY
- ▲ 1.84%
- F500 in state
- 20
Industry mix (Fortune 500 HQ in MO)
| Industry | F500 HQs | Revenue |
|---|---|---|
| Healthcare | 1 | $163B |
|
||
| Insurance | 1 | $21B |
|
||
| Industrial Technology | 1 | $17B |
|
||
| Retail | 1 | $16B |
|
||
| Industrial Distribution | 1 | $10B |
|
||
| Utilities | 1 | $9B |
|
||
Price history
3 events — show timeline
- 2026-06-12 Pending — MARIS as Distributed by MLS Grid
- 2026-06-12 Listed $39,900 MARIS as Distributed by MLS Grid
- 2006-10-31 Sold (Public Records) — Public Records
Property tax history
+1.2%/yrLatest (2025): $544 · +5.3% YoY. Source: county tax records.
Cash-flow waterfall
monthlySold comps — $/sqft
last 12 mo · ≤1 miLoading sold comps…