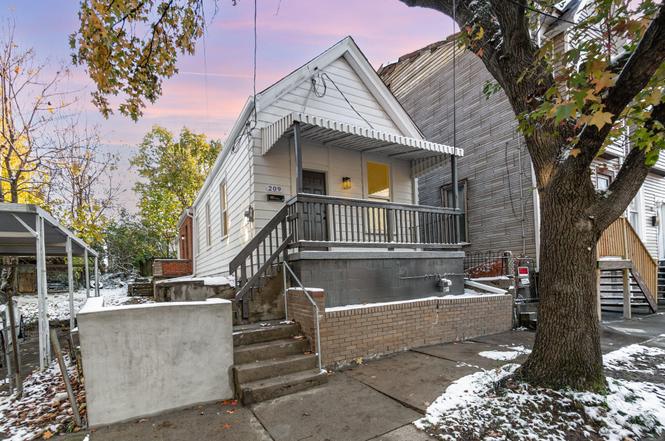
209 E 10th St · Covington, KY
Flood risk 1/10 · Minimal
- FEMA flood zone
- X (unshaded)
- Chance of flooding over 30 yrs
- 0.0%
- Est. flood insurance / yr
- $507 – $1,088
Fire risk 1/10 · Minimal
- Est. fire insurance / yr
- $839 – $1,559
Heat risk 5/10 · Moderate
- Hot days now (above 103°F)
- 7 days/yr
- Hot days in 30 yrs
- 20 days/yr
Wind risk 2/10 · Minimal
- Chance of severe wind over 30 yrs
- 1.0%
Air-quality risk 3/10 · Minor
- Unhealthy air days now
- 2 days/yr
- Unhealthy air days in 30 yrs
- 3 days/yr
Risk factors via First Street. Map © Google.
Why this score? — see what drove the D grade
The composite is a weighted blend of 9 inputs, each scored 0–100. Each bar is that input's sub-score; the figure is the points it added to the 100-point composite (weight × sub-score).
- Cash flow +20.7/30.0
- DSCR +6.6/10.0
- 1% rule +4.3/10.0
- Livability +4.3/5.0
- Rent growth +2.9/5.0
- Condition / age +2.5/5.0
- Schools +1.5/10.0
- ARV discount +0.0/15.0
- Appreciation +0.0/10.0
$183,900
🖨 Deal sheet 📄 Offer letter ✓ Due diligence
Listing remarks MLS
1 Bdrm, 2 bath, newer furnace, tenant pays $500/mo rent
Key facts
- Custom kitchen
- New vanity
- Tile tub surround
Tags
Property features AI
Exterior
- Parking: On-street parking
- Utilities: Public water; Public sewer
- Home design: Single-story home; Residential farm property
- Construction: Aluminum siding; Stone foundation; Shingle roof
- Exterior features: Vinyl window frames; Cleared lot
Interior
- Kitchen: Kitchen (10 x 12)
- Bedrooms: Primary bedroom (15 x 14); Second bedroom (12 x 10)
- Bathrooms: 1 full bathroom
- Heating & cooling: Central air conditioning; Forced air heating
- Interior features: Stainless steel appliances; Laundry on the main level
- Laundry & utility: Laundry located on main level
Neighborhood map
What this means for you Summary
Snapshot
- This is a 2-bed/1.0-bath single-family listed at $184k.
Deal economics
- At list price, monthly cash flow is $249 ($3k/yr) — positive.
- The deal already cash-flows at list — no discount required.
- To meet the 1% rule (rent ≥ 1% of price), the offer needs to be $171k (7.1% below list).
- Recommended offer: $162k (12.0% below list) — sets the bar for market timing.
- Cap rate 7.9% vs local median 5.3% in Covington — top-decile yield for the area; either an underpriced asset or a hidden risk that comps aren't pricing in. Stress-test before assuming the spread holds.
Location & tenants
- Location reads 86/100 on livability (#40 in KY, #376 nationally) — a professional / high-income tenant draw. Strengths: amenities A+, commute A+, cost of living A+; Watch: employment D+.
- Covington Independent (suburban): math 10% / reading 27% proficiency, ranked #162 of 165 in KY (top 98%) — low school quality limits family demand, transient renter base, plan for 1-2y turnover; 78% free/reduced lunch — lower-income household profile, screen leases tightly.
- Zoned schools: John G Carlisle Elementary (math 2% / reading 27%, grade F, #620 of 676 statewide, top 93%, 304 students, 81% FRL); Holmes Middle School (math 8% / reading 26%, grade F, #211 of 217 statewide, top 97%, 656 students, 84% FRL); Holmes High School (math 12% / reading 17%, grade F, #227 of 254 statewide, top 89%, 878 students, 80% FRL) — zoned schools at 82% FRL track the district average.
- Market conditions: Rents rising (+1.6%/yr); 214 active listings in the ZIP; 40 comparable units currently listed for rent nearby; rentals at typical pace (median 15d on market — plan ~3-4 weeks tenant-placement turnaround); 699 units permitted in Kenton County in 2024 (287 in 5+ unit buildings).
Forward outlook
- Local home prices are declining (-3.0%/yr); year-one equity from $1k of loan paydown is wiped out by about $6k of value loss. Plan a longer hold.
- Kenton County population projected at +5% by 2050 — modest demand growth; plan on rents tracking national, not racing it.
Negotiation context
- It's been on market 182 days — a 12% lower offer ($162k) is reasonable based on typical stale-listing flexibility.
- 5 sale attempts since 22y ago; this cycle's ask has dropped $16k (8%) from the opening price — seller is motivated, your offer sets the floor, not the list.
- Current owner paid $70k; list at $184k implies a 163% gain — meaningful room to come down on a strong offer.
Risks & watch-outs
- Climate carrying-cost: extreme-heat days projected 7→20/yr by 2055 (HVAC capex compounding) — expect insurance premiums to compound above CPI over the hold.
Questions for the listing agent
- It's been on market 182 days. Have you received any prior offers? Is the seller open to a 12% concession, seller financing, or rate buy-down credit?
- Why hasn't it sold? Are there any deal-killer items the seller is aware of (foundation, flood, title, zoning, code violations)?
- Is there a deadline driving the sale (1031 exchange, divorce, estate, relocation)? That informs how much negotiation room exists.
- The area grade is low — what's the realistic commute time and amenity access for the typical tenant pool here? Any planned neighborhood developments (good or bad) we should know about?
- What's the average days-on-market for RENTAL listings here right now (not sales)? A rising rental-DOM trend means longer vacancies and softer asking-rent achievability than the comps imply.
- What's the recent tenant-quality profile in this submarket — average credit score on applications, eviction rate, late-payment / NSF rate, and stable-employment percentage? A property-management company in the area should have these aggregated.
- How much new for-sale + rental construction is in the pipeline within 1–3 miles? Heavy new supply typically softens prices + rents 12–24 months out; constrained supply supports both.
Investment metrics
- 1% rule
- 0.93% ✗
- Cap rate
- 7.92%
- Cash-on-cash
- 5.80%
- DSCR
- 1.26
- GRM
- 9.0
CMA / ARV
- ARV (on-the-fly)
- $152,656
- Comps found
- 12
Show comp detail 12 sales within ~0.75 mi
| Address | Dist | Beds/Ba | Sqft | Sold | Price | $/sf | Match |
|---|---|---|---|---|---|---|---|
| 311 E 13th St | 0.31mi | 2/1.0 | 825 (+2%) | 7mo | $158,500 | $192 | 77 |
| 1310 Russell St | 0.47mi | 2/1.0 | 765 (-6%) | 0mo | $179,000 | $234 | 68 |
| 531 Lindsey St | 0.38mi | 1/1.0 (-1) | 777 (-4%) | 6mo | $174,900 | $225 | 65 |
| 319 Elm St | 0.56mi | 2/1.5 | 850 (+5%) | 0mo | $160,000 | $188 | 64 |
| 1506 St Clair St | 0.74mi | 1/1.0 (-1) | 816 (+0%) | 5mo | $117,000 | $143 | 55 |
| 328 W Martin Luther King Jr Blvd | 0.57mi | 2/1.0 | 708 (-13%) | 1mo | $79,000 | $112 | 51 |
| 1006 Liberty St | 0.66mi | 1/1.0 (-1) | 868 (+7%) | 3mo | $86,900 | $100 | 50 |
| 936 York St | 0.66mi | 1/1.0 (-1) | 882 (+9%) | 1mo | $205,000 | $232 | 49 |
| 939 Liberty St | 0.66mi | 2/1.5 | 720 (-11%) | 2mo | $90,000 | $125 | 46 |
| 1319 Holman Ave | 0.59mi | 2/1.0 | 928 (+14%) | 7mo | $168,000 | $181 | 43 |
| 835 Ann St | 0.74mi | 1/1.0 (-1) | 734 (-10%) | 5mo | $167,900 | $229 | 40 |
| 408 E 16th St | 0.68mi | 1/1.0 (-1) | 700 (-14%) | 6mo | $127,500 | $182 | 36 |
Match score weights: distance 35% · size 25% · config 20% · recency 20%. Top-matched comps best support the ARV.
Projected returns pro-forma
-3.0% appreciation · 1.55% rent growth · sell at horizon
- IRR
- -8.8%
- Equity multiple
- 0.68×
- Total profit
- $-16,493
- Equity at exit
- $27,420
- IRR
- -1.2%
- Equity multiple
- 0.92×
- Total profit
- $-4,075
- Equity at exit
- $15,900
Cash invested: $51,492 (down + closing). Projections, not guarantees.
Landlord ↔ Tenant lean methodology
- Overall (STATE)
- 83 Strongly Landlord-Friendly
- State Kentucky
- 83 Strongly Landlord-Friendly · R+16
- County
- — inherits STATE
- City
- — inherits STATE
ZIP-level market 41011
- Rents YoY
- 1.6%
- Active inventory
- 214
- Price-to-rent
- 9.0×
Monthly cashflow live
- Estimated rent
- $1,708 high interval (Pro) →
- Mortgage (P&I)
- −$964
- Tax from tax record
- −$60 /mo · $719/yr
- Insurance
- −$77
- HOA
- −$0
- Vacancy / Maint / Mgmt
- −$359
- Net cashflow
- $249
Break-even live
UW: 25.0% down · 7.5% · 30yr · 1.5% tax · 5.0% vac · 8.0% maint · 8.0% mgmt
Financing live
Cash to close
- Down payment
- $45,975
- Closing costs
- $5,517
- Reserves months
- —
- Total cash needed
- —
Loan-product check · same deal, 3 products live
Conventional
25% down · 7.5% · 30yr
- Down + closing
- —
- Monthly P&I
- —
- Monthly cashflow
- —
- DSCR
- —
- Eligible?
- —
Personal DTI + credit; lowest rate.
DSCR
20% down · 8.5% · 30yr
- Down + closing
- —
- Monthly P&I
- —
- Monthly cashflow
- —
- DSCR
- —
- Eligible?
- —
No personal income docs; deal must DSCR.
Hard money
10% down · 12.0% · 12mo
- Down + closing
- —
- Monthly P&I
- —
- Monthly cashflow
- —
- DSCR
- —
- Eligible?
- —
Short-term bridge; refi at stabilization.
Rent comps 40 comps
| Address | Beds | Baths | Sqft | Rent | $/sqft | DOM | Units | Dist |
|---|---|---|---|---|---|---|---|---|
| 1025 Scott St Unit 2 Covington, KY | 2.0 | 2.0 | 1100 | $1,800 | $1.64 | 3d | 1 | 0.11mi |
| 634 Greenup St Covington, KY | 1.0 | 1.5 | 1050 | $1,595 | $1.52 | 7d | 1 | 0.23mi |
| 521 Garrard St Apt 1 Covington, KY | 1.0 | 1.5 | 825 | $1,895 | $2.30 | 17d | 1 | 0.32mi |
| 521 Garrard St Apt 2 Covington, KY | 1.0 | 1.0 | 725 | $1,595 | $2.20 | 17d | 1 | 0.32mi |
| 521 Garrard St Apt 3 Covington, KY | 1.0 | 1.0 | 875 | $1,996 | $2.28 | 14d | 1 | 0.32mi |
| 521 Garrard St Apt 4 Covington, KY | 1.0 | 1.0 | 725 | $1,695 | $2.34 | 17d | 1 | 0.32mi |
| 521 Garrard St Apt 6 Covington, KY | 1.0 | 1.0 | 775 | $1,995 | $2.57 | 16d | 1 | 0.32mi |
| 344 E 13th St Unit 1 Covington, KY | 2.0 | 1.0 | 1000 | $1,275 | $1.27 | 23d | 1 | 0.33mi |
| 303 Greenup St Covington, KY | 1.0 | 1.0 | 678 | $1,445 | $2.13 | 23d | 1 | 0.54mi |
| 218 W 5th St Covington, KY | 1.0 | 1.0 | 800 | $1,595 | $1.99 | 14d | 1 | 0.56mi |
| 1205 Lee St Unit 1 Covington, KY | 1.0 | 1.0 | 675 | $1,350 | $2.00 | 23d | 1 | 0.60mi |
| 1205 Lee St Unit 2 Covington, KY | 1.0 | 1.0 | 800 | $1,500 | $1.88 | 23d | 1 | 0.60mi |
| 50 W Rivercenter Blvd Covington, KY | 1.0–2.0 | 1.0–2.5 | 1273 | $3,640 | $2.86 | 1d | 9 | 0.70mi |
| 515 Main St Covington, KY | 1.0–2.0 | 1.0–2.0 | 934 | $2,215 | $2.37 | 1d | 8 | 0.70mi |
| 210 W 5th St Newport, KY | 1.0–2.0 | 1.0–2.0 | 845 | $1,800 | $2.13 | 3d | 15 | 0.72mi |
| 128 W 9th St Newport, KY | 2.0 | 1.0 | 1012 | $1,650 | $1.63 | 2d | 1 | 0.74mi |
| 1114 Columbia St Unit 2 Newport, KY | 1.0 | 1.0 | 925 | $1,550 | $1.68 | 43d | 1 | 0.84mi |
| 911 Putnam St #2 Newport, KY | 2.0 | 1.0 | 1000 | $1,600 | $1.60 | 21d | 1 | 0.85mi |
| 835 York St Unit 2 Newport, KY | 1.0 | 1.0 | 1000 | $1,295 | $1.29 | 17d | 1 | 0.90mi |
| 1914 Eastern Ave Apt 1 Covington, KY | 2.0 | 1.0 | 750 | $1,200 | $1.60 | 23d | 1 | 0.94mi |
| 1914 Eastern Ave Apt 3 Covington, KY | 1.0 | 1.0 | 900 | $995 | $1.11 | 14d | 1 | 0.94mi |
| 415 Monmouth St Newport, KY | 1.0 | 1.0 | 775 | $1,660 | $2.14 | 2d | 5 | 1.03mi |
| 121 E Freedom Way Cincinnati, OH | 2.0 | 1.0–2.0 | 988 | $2,999 | $3.03 | 1d | 27 | 1.12mi |
| 920 Washington Ave Unit 10 Newport, KY | 1.0 | 1.0 | 600 | $955 | $1.59 | 23d | 1 | 1.14mi |
| 512 Wallace Ave Unit 512/18 Covington, KY | 2.0 | 2.0 | 900 | $1,299 | $1.44 | 7d | 1 | 1.14mi |
| 512 Wallace Ave Unit 512/16 Covington, KY | 1.0 | 1.0 | 550 | $939 | $1.71 | 7d | 1 | 1.14mi |
| 512 Wallace Ave Unit 512/09 Covington, KY | 1.0 | 1.0 | 550 | $899 | $1.63 | 7d | 1 | 1.14mi |
| 512 Wallace Ave Unit 512/08 Covington, KY | 1.0 | 1.0 | 550 | $899 | $1.63 | 17d | 1 | 1.15mi |
| 229 E 5th St Unit 1 Newport, KY | 1.0 | 1.0 | 950 | $1,225 | $1.29 | 43d | 1 | 1.16mi |
| 44 W Freedom Way Cincinnati, OH | 2.0 | 1.0–2.0 | 943 | $2,859 | $3.03 | 1d | 28 | 1.17mi |
| 100 Aqua Way Newport, KY | 1.0–3.0 | 1.0–2.0 | 1092 | $2,834 | $2.60 | 1d | 4 | 1.20mi |
| 621 E Mehring Way Cincinnati, OH | 1.0–2.0 | 1.0–2.0 | 938 | $2,249 | $2.40 | 1d | 12 | 1.29mi |
| 309 Sycamore St #201 Cincinnati, OH | 2.0 | 2.0 | 850 | $1,600 | $1.88 | 23d | 1 | 1.29mi |
| 309 Vine St Cincinnati, OH | 1.0–3.0 | 1.0–2.0 | 955 | $2,467 | $2.58 | 1d | 15 | 1.30mi |
| 1000 Parkvale Ct Park Hills, KY | 2.0 | 1.0 | 850 | $1,495 | $1.76 | 43d | 1 | 1.33mi |
| 1431 Dixie Hwy Park Hills, KY | 1.0–2.0 | 1.0–2.0 | 920 | $2,553 | $2.77 | 1d | 10 | 1.33mi |
| 1002 Parkvale Ct Unit 1004 1 Park Hills, KY | 2.0 | 1.0 | 850 | $995 | $1.17 | 43d | 1 | 1.34mi |
| 1002 Parkvale Ct Unit 1002 3 Park Hills, KY | 1.0 | 1.0 | 750 | $925 | $1.23 | 7d | 1 | 1.34mi |
| 1 W 4th St Cincinnati, OH | 3.0 | 1.0–3.5 | 1675 | $6,550 | $3.91 | 3d | 96 | 1.34mi |
| 601 E Pete Rose Way Cincinnati, OH | 3.0 | 1.0–2.5 | 1039 | $2,448 | $2.36 | 1d | 22 | 1.36mi |
Listing history 28 events
-
2026-06-18days on market $183,900 Active 182 DOM
-
2026-06-17pricedays on market $183,900 Active 181 DOM
-
2026-06-16days on market $184,800 Active 180 DOM
-
2026-06-15pricedays on market $184,800 Active 179 DOM
-
2026-06-09days on market $184,900 Active 173 DOM
-
2026-06-08days on market $184,900 Active 172 DOM
-
2026-06-07days on market $184,900 Active 171 DOM
-
2026-06-03status $184,900 Active 167 DOM
-
2026-05-23status Pending
-
2026-05-20price $184,900
-
2026-05-11price $185,900
-
2026-05-06price $186,900
-
2026-04-13price $187,400
-
2026-03-19status Active
-
2026-03-06status Pending
-
2026-02-19price $187,900
-
2026-02-05price $188,900
-
2026-01-18status Active
-
2026-01-13status Pending
-
2026-01-09price $189,900
-
2025-12-08price $194,900
-
2025-11-11$199,900 Active
-
2025-06-09soldstatus $70,000
-
2018-04-02soldstatus $15,000
-
2009-03-18soldstatus $13,000 55-char remark
Show marketing remark (55 chars)
1 Bdrm, 2 bath, newer furnace, tenant pays $500/mo rent
-
2008-11-02$11,975 55-char remark
Show marketing remark (55 chars)
1 Bdrm, 2 bath, newer furnace, tenant pays $500/mo rent
-
2004-12-14soldstatus $16,500 50-char remark
Show marketing remark (50 chars)
Property sold As is- Where is; Addendum A required
-
2004-09-29$19,500 50-char remark
Show marketing remark (50 chars)
Property sold As is- Where is; Addendum A required
ⓘ Source: listings_history table (triggers on properties + properties_extension) + one-shot
backfill from property_details.listing_events for pre-trigger history.
Tax reassessment forecast KY · Resets to sale price
- Current annual tax
- $719 · $60/mo
- Projected year-2 tax
- $1,582 · $132/mo
- Expected delta
- +$862/yr (+$72/mo · 119.9%)
ⓘ Screening estimate from a state-policy table — verify with the county assessor before closing.
Climate risk First Street
- Flood 1/10 Low FEMA zone X (unshaded) · 0% chance over 30 yrs
- Wildfire 1/10 Low
- Heat 5/10 Major 7 d/yr ≥103°F today · 20 d/yr by 30 yrs out
- Wind 2/10 Low 100% chance of damaging wind over 30 yrs
- Air quality 3/10 Moderate 2 unhealthy d/yr today · 3 by 30 yrs out
Nearby sold comps map
Loading sold comps map…
Walkable amenities ~0.75 mi
Loading nearby amenities…
Taxation est. · year 1
- Rental income
- $20,502
- − Mortgage interest
- −$10,301
- − Property taxes
- −$719
- − Insurance
- −$920
- − Repairs & maintenance
- −$1,640
- − Management
- −$1,640
- − Depreciation
- −$5,350
- Taxable loss
- −$68
- Est. tax savings @ 24.0%
- +$16
- After-tax cash flow
- $3,001/yr
For passive investors: Depreciation is non-cash, so a rental often shows a tax loss while cash-flowing — sheltering income. Rental losses are passive: they offset passive income freely, and up to $25,000/yr can offset ordinary (W-2) income if you actively participate and your MAGI is under $100k (phasing out to $0 by $150k); unused losses carry forward. On sale, claimed depreciation is recaptured at up to 25%, and gains may owe capital-gains tax (a 1031 exchange can defer both). Figures are a year-1 estimate at your 24.0% rate — not tax advice; consult a CPA.
Schools (NCES district)
- District
- Covington Independent
- NCES district ID
- 2101350
- Math proficiency
- 10% ▼ -20.00%
- Reading proficiency
- 27% ▼ -14.00%
- Median HH income
- $33,681
- Composite
- 15.04/100
- National rank
- #9353
- State rank
- #162 of 165 in KY
Livability — Covington
- Score
- 86/100
- State rank
- #40
- US rank
- #376
Category grades
Schools grade is shown separately in the Schools card above.
Census & demographics
- Census place
- Covington, KY
- County
- Kenton County · 142,881 people
- City population
- 34,373
- Metro
- Cincinnati, OH-KY-IN
- Population (ZIP)
- 26,981
- Household income
- $69,970
- Rent vs Own
- Severe rent burden
- 1488.0
Population outlook (Kenton County) Hauer SSP2
- Today (2025)
- 174,205 people
- By 2030
- 177,897 · +2.1%
- By 2040
- 182,671 · +4.9%
- By 2050
- 183,543 · +5.4%
- By 2075
- 178,977 · +2.7%
- By 2100
- 159,920 · -8.2%
Race, ethnicity, and origin ACS 2023
- Neighborhood character
- Predominantly White (72%)
- Race & ethnicity
- White 72% Hispanic / Latino 12% Black 10% Two or more races 7% Asian 1%
- Hispanic origin (detail)
- Mexican 2%
- Common ancestry
- Lithuanian 2% Italian 1% Slovak 1%
- Foreign-born
- 7% · Canada
- Languages at home
- 90% English-only · Spanish 6% Other Indo-European 1%
Political lean MEDSL · Kenton
- 2024 margin
- Strong R (+21.7) · D 38.2% · R 59.9% · Other 1.9%
- 2008→2024 swing
- -0.9pp no change · 2008: -20.9pp · 2024: -21.7pp
- All cycles
- 2024: R+21.7 2020: R+19.3 2016: R+26.1 2012: R+24.3 2008: R+20.9
Not yet ingested
- Civics
- —
Market trends
- HPI YoY
- ▼ -215.20%
- Current HPI
- 237.0869
- Rent YoY
- ▲ 1.55%
- Metro
- Cincinnati, OH-KY-IN
- State GDP YoY
- ▲ 1.81%
- F500 in state
- 4
Industry mix (Fortune 500 HQ in KY)
| Industry | F500 HQs | Revenue |
|---|---|---|
| Healthcare | 1 | $118B |
|
||
| Food / Beverage | 1 | $7B |
|
||
Price history
+848.2% since first listed20 events — show timeline
- 2026-05-23 Pending — NKMLS
- 2026-05-20 Price Changed $184,900 NKMLS
- 2026-05-11 Price Changed $185,900 NKMLS
- 2026-05-06 Price Changed $186,900 NKMLS
- 2026-04-13 Price Changed $187,400 NKMLS
- 2026-03-19 Relisted — NKMLS
- 2026-03-06 Pending — NKMLS
- 2026-02-19 Price Changed $187,900 NKMLS
- 2026-02-05 Price Changed $188,900 NKMLS
- 2026-01-18 Relisted — NKMLS
- 2026-01-13 Pending — NKMLS
- 2026-01-09 Price Changed $189,900 NKMLS
- 2025-12-08 Price Changed $194,900 NKMLS
- 2025-11-11 Listed $199,900 NKMLS
- 2025-06-09 Sold (Public Records) $70,000 Public Records
- 2018-04-02 Sold (Public Records) $15,000 Public Records
- 2009-03-18 Sold (MLS) $13,000 NKMLS
- 2008-11-02 Listed $11,975 NKMLS
- 2004-12-14 Sold (MLS) $16,500 NKMLS
- 2004-09-29 Listed $19,500 NKMLS
Property tax history
+9.5%/yrLatest (2025): $719 · +72.1% YoY. Source: county tax records.
Cash-flow waterfall
monthlySold comps — $/sqft
last 12 mo · ≤1 miLoading sold comps…