 10-Plex
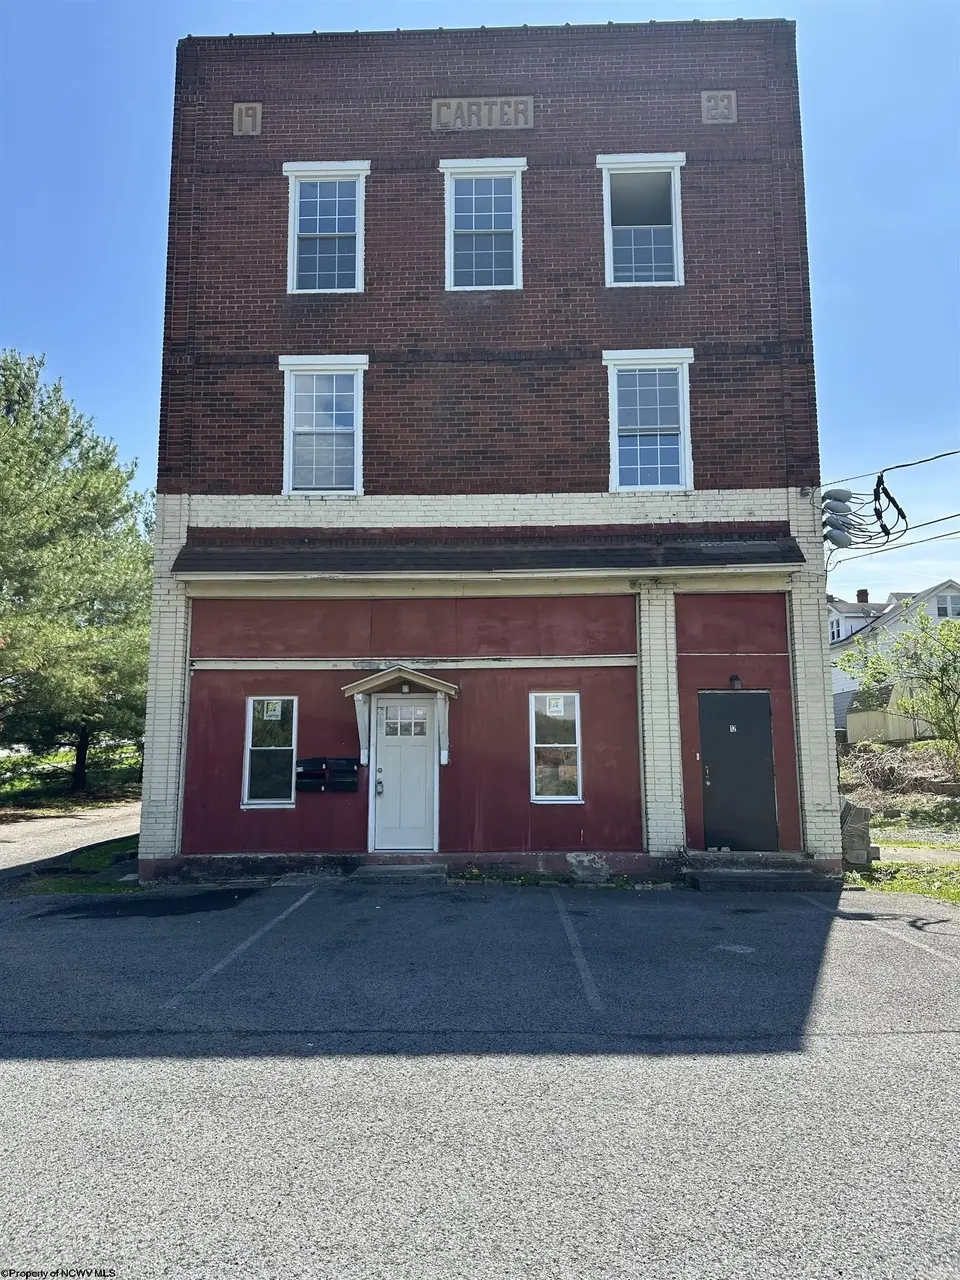
409 Diamond · Fairmont, WV
Flood risk 1/10 · Minimal
- FEMA flood zone
- X (unshaded)
- Chance of flooding over 30 yrs
- 0.0%
- Est. flood insurance / yr
- $473 – $860
Fire risk 3/10 · Minor
- Est. fire insurance / yr
- $787 – $1,461
Heat risk 5/10 · Moderate
- Hot days now (above 96°F)
- 7 days/yr
- Hot days in 30 yrs
- 20 days/yr
Wind risk 1/10 · Minimal
- Chance of severe wind over 30 yrs
- —
Air-quality risk 2/10 · Minimal
- Unhealthy air days now
- 1 days/yr
- Unhealthy air days in 30 yrs
- 2 days/yr
Risk factors via First Street. Map © Google.
Why this score? — see what drove the D grade
The composite is a weighted blend of 9 inputs, each scored 0–100. Each bar is that input's sub-score; the figure is the points it added to the 100-point composite (weight × sub-score).
- Cash flow +15.0/30.0
- ARV discount +7.5/15.0
- 1% rule +5.0/10.0
- DSCR +5.0/10.0
- Livability +3.5/5.0
- Schools +3.1/10.0
- Rent growth +2.5/5.0
- Condition / age +2.5/5.0
- Appreciation +0.0/10.0
$250,000
🖨 Deal sheet (PDF) 📄 Offer letter ✓ Due diligence
Multi-family units
County records classify this as Multi-Family (5+ Unit). Listing-text estimate: 10 units. confirmed
5+ unit building — per-unit beds/baths from public records are typically unavailable; the breakdown below (if shown) is an estimate from the listing text.
Listing remarks
Unlock the potential of this blank slate and transform it into a fully functioning 10-unit apartment building. With the structure and space already in place, this property is primed for redevelopment—ideal for investors looking to build long-term rental income or expand their portfolio. Endless possibilities await with the right vision. Being Sold AS IS. Will more than likely need to be a cash buyer or renovation loan
Key facts
- 5,400 sq ft lot
- Built 1923
- Listed 65 days
Tags
Property features AI
Exterior
- Parking: On-street parking
- Utilities: Public water; Public sewer
- Home design: Residential income, multi-family property; Three-story building
- Construction: Brick construction; Rolled/Hot Mop and rubber roofing
- Exterior features: Level lot
Interior
- Bedrooms: Three rental units: two 1-bedroom units and one 2-bedroom unit
- Bathrooms: Three full bathrooms
- Heating & cooling: Baseboard heating (electric); Window air conditioning units
- Interior features: Full basement; Has a view
Neighborhood map
What this means for you Summary
Snapshot
- This is a 10 × 4-bed/3.0-bath units multifamily listed at $250k.
Deal economics
- At list price, monthly cash flow is $8k ($91k/yr) — positive. Per door: $759/mo.
- The deal already cash-flows at list — no discount required.
- Meets the 1% rule at list price ($12k rent vs $250k).
- Recommended offer: $235k (6.0% below list) — sets the bar for market timing.
- Cap rate 42.7% vs local median 4.3% in Fairmont — top-decile yield for the area; either an underpriced asset or a hidden risk that comps aren't pricing in. Stress-test before assuming the spread holds.
Location & tenants
- Location reads 70/100 on livability (#64 in WV) — a middle-class / working-renter tenant base. Strengths: cost of living A+, housing A+, health & safety A+; Watch: crime D, amenities F, commute F.
- Marion County Schools (town): math 30% / reading 43% proficiency, ranked #11 of 55 in WV (top 20%) — families likely to look elsewhere, expect single-tenant / working-renter base with shorter leases.
- Zoned schools: East Park Elementary School (math 27% / reading 32%, grade F, #225 of 377 statewide, top 68%, 330 students, 0% FRL); East Fairmont Middle School (math 31% / reading 43%, grade F, #28 of 109 statewide, top 27%, 723 students, 0% FRL); East Fairmont High School (math 27% / reading 52%, grade F, #21 of 110 statewide, top 26%, 689 students, 0% FRL) — zoned schools average 0% FRL vs 46% district-wide (46 pts lower); this property's tenant base skews higher-income than the district average.
- Market conditions: 150 active listings in the ZIP; 3 units permitted in Marion County in 2024 (0 in 5+ unit buildings).
Forward outlook
- Local home prices are declining (-3.0%/yr); year-one equity from $2k of loan paydown is wiped out by about $8k of value loss. Plan a longer hold.
- At projected returns (-3.0% appreciation + 3.0% rent growth), your $70k cash investment doubles in ~1 year — after that, you're playing with house money.
Negotiation context
- It's been on market 65 days — a 6% lower offer ($235k) is reasonable based on typical stale-listing flexibility.
- Current owner paid $55k; list at $250k implies a 355% gain — meaningful room to come down on a strong offer.
Risks & watch-outs
- Watch-outs: built in 1923 — expect roof / HVAC / electrical / plumbing capex.
- Climate carrying-cost: extreme-heat days projected 7→20/yr by 2055 (HVAC capex compounding) — expect insurance premiums to compound above CPI over the hold.
Questions for the listing agent
- It's been on market 65 days. Have you received any prior offers? Is the seller open to a 6% concession, seller financing, or rate buy-down credit?
- Can we see the unit-by-unit rent roll, current vacancy, and any below-market leases? What's the average tenancy length?
- What capital expenditures (roof, boiler, parking lot, exteriors) have been made in the last 5 years, and what's planned in the next 2?
- Built in 1923 — when were the roof, HVAC, electrical panel, plumbing, and water heater last replaced?
- Why hasn't it sold? Are there any deal-killer items the seller is aware of (foundation, flood, title, zoning, code violations)?
- Is there a deadline driving the sale (1031 exchange, divorce, estate, relocation)? That informs how much negotiation room exists.
- Schools are B-rated — typically a magnet for longer-tenancy family renters. What's the average tenant stay here, and is there a school-zone premium baked into asking?
- Crime grade is D in this area — have there been break-ins, vandalism, or insurance claims at this property in the last 3 years? What carrier currently insures it and at what premium?
- The area grade is low — what's the realistic commute time and amenity access for the typical tenant pool here? Any planned neighborhood developments (good or bad) we should know about?
- What's the average days-on-market for RENTAL listings here right now (not sales)? A rising rental-DOM trend means longer vacancies and softer asking-rent achievability than the comps imply.
- What's the recent tenant-quality profile in this submarket — average credit score on applications, eviction rate, late-payment / NSF rate, and stable-employment percentage? A property-management company in the area should have these aggregated.
- How much new apartment / multifamily construction is in the pipeline within 1–3 miles? Heavy new supply (>2% of stock underway) typically softens rents 12–24 months out; light construction supports rent growth.
Investment metrics
- 1% rule
- 4.62% ✓
- Cap rate
- 42.71%
- Cash-on-cash
- 130.05%
- DSCR
- 6.79
- GRM
- 1.8
CMA / ARV
No comps found within radius.
Projected returns pro-forma
-3.0% appreciation · 3.0% rent growth · sell at horizon
- IRR
- —
- Equity multiple
- 7.32×
- Total profit
- $442,704
- Equity at exit
- $37,276
- IRR
- —
- Equity multiple
- 15.40×
- Total profit
- $1,007,860
- Equity at exit
- $21,615
Cash invested: $70,000 (down + closing). Projections, not guarantees.
Landlord ↔ Tenant lean methodology
- Overall (STATE)
- 83 Strongly Landlord-Friendly
- State West Virginia
- 83 Strongly Landlord-Friendly · R+22
- County
- — inherits STATE
- City
- — inherits STATE
ZIP-level market 26554
- Home prices YoY
- -11.3%
- Active inventory
- 150
- Price-to-rent
- 18.1×
Monthly cashflow live
- Estimated rent
- $11,538 medium interval (Pro) →
- Mortgage (P&I)
- −$1,311
- Tax from tax record
- −$114 /mo · $1,365/yr
- Insurance
- −$104
- HOA
- −$0
- Vacancy / Maint / Mgmt
- −$2,423
- Net cashflow
- $7,586
Break-even live
Sensitivity live
| Price | -10% $7,728 | -5% $7,657 | +0% $7,586 | +5% $7,515 | +10% $7,445 |
|---|---|---|---|---|---|
| Rent | -10% $6,675 | -5% $7,130 | +0% $7,586 | +5% $8,042 | +10% $8,498 |
| Rate | -1.0pp $7,712 | -0.5pp $7,650 | base $7,586 | +0.5pp $7,521 | +1.0pp $7,455 |
10-unit breakdown (identical units grouped — click to expand)
| Units | Beds | Baths | Est. rent |
|---|---|---|---|
| 10× units | 4 | 3 | $11,540 |
| #1 | 4 | 3 | $1,154 |
| #2 | 4 | 3 | $1,154 |
| #3 | 4 | 3 | $1,154 |
| #4 | 4 | 3 | $1,154 |
| #5 | 4 | 3 | $1,154 |
| #6 | 4 | 3 | $1,154 |
| #7 | 4 | 3 | $1,154 |
| #8 | 4 | 3 | $1,154 |
| #9 | 4 | 3 | $1,154 |
| #10 | 4 | 3 | $1,154 |
| Total (10 units) | $11,538 | ||
UW: 25.0% down · 7.5% · 30yr · 1.5% tax · 5.0% vac · 8.0% maint · 8.0% mgmt
Financing live
Cash to close
- Down payment
- $62,500
- Closing costs
- $7,500
- Reserves months
- —
- Total cash needed
- —
Loan-product check · same deal, 3 products live
Conventional
25% down · 7.5% · 30yr
- Down + closing
- —
- Monthly P&I
- —
- Monthly cashflow
- —
- DSCR
- —
- Eligible?
- —
Personal DTI + credit; lowest rate.
DSCR
20% down · 8.5% · 30yr
- Down + closing
- —
- Monthly P&I
- —
- Monthly cashflow
- —
- DSCR
- —
- Eligible?
- —
No personal income docs; deal must DSCR.
Hard money
10% down · 12.0% · 12mo
- Down + closing
- —
- Monthly P&I
- —
- Monthly cashflow
- —
- DSCR
- —
- Eligible?
- —
Short-term bridge; refi at stabilization.
Listing history 18 events
-
2026-06-21days on market $250,000 Active 65 DOM
-
2026-06-19days on market $250,000 Active 63 DOM
-
2026-06-18days on market $250,000 Active 62 DOM
-
2026-06-17days on market $250,000 Active 61 DOM
-
2026-06-16days on market $250,000 Active 60 DOM
-
2026-06-15days on market $250,000 Active 59 DOM
-
2026-06-14days on market $250,000 Active 57 DOM
-
2026-06-13days on market $250,000 Active 56 DOM
-
2026-06-10days on market $250,000 Active 54 DOM
-
2026-06-09days on market $250,000 Active 53 DOM
-
2026-06-08days on market $250,000 Active 52 DOM
-
2026-06-07days on market $250,000 Active 51 DOM
-
2026-06-02days on market $250,000 Active 46 DOM
-
2026-06-01days on market $250,000 Active 45 DOM
-
2026-05-31days on market $250,000 Active 44 DOM
-
2026-05-30days on market $250,000 Active 43 DOM
-
2026-04-17$250,000 Active
-
2007-06-08soldstatus $55,000
ⓘ Source: listings_history table (triggers on properties + properties_extension) + one-shot
backfill from property_details.listing_events for pre-trigger history.
Tax reassessment forecast WV · Resets to sale price
- Current annual tax
- $1,365 · $114/mo
- Projected year-2 tax
- $1,475 · $123/mo
- Expected delta
- +$110/yr (+$9/mo · 8.1%)
ⓘ Screening estimate from a state-policy table — verify with the county assessor before closing.
Climate risk First Street
- Flood 1/10 Low FEMA zone X (unshaded) · 0% chance over 30 yrs
- Wildfire 3/10 Moderate
- Heat 5/10 Major 7 d/yr ≥96°F today · 20 d/yr by 30 yrs out
- Wind 1/10 Low
- Air quality 2/10 Low 1 unhealthy d/yr today · 2 by 30 yrs out
Nearby sold comps map
Loading sold comps map…
Walkable amenities ~0.75 mi
Loading nearby amenities…
Taxation est. · year 1
- Rental income
- $138,456
- − Mortgage interest
- −$14,004
- − Property taxes
- −$1,365
- − Insurance
- −$1,250
- − Repairs & maintenance
- −$11,076
- − Management
- −$11,076
- − Depreciation
- −$7,273
- Taxable income
- $92,412
- Est. tax owed @ 24.0%
- −$22,179
- After-tax cash flow
- $68,854/yr
For passive investors: Depreciation is non-cash, so a rental often shows a tax loss while cash-flowing — sheltering income. Rental losses are passive: they offset passive income freely, and up to $25,000/yr can offset ordinary (W-2) income if you actively participate and your MAGI is under $100k (phasing out to $0 by $150k); unused losses carry forward. On sale, claimed depreciation is recaptured at up to 25%, and gains may owe capital-gains tax (a 1031 exchange can defer both). Figures are a year-1 estimate at your 24.0% rate — not tax advice; consult a CPA.
Schools (NCES district)
- District
- Marion County Schools
- NCES district ID
- 5400720
- Math proficiency
- 30% ▼ -14.00%
- Reading proficiency
- 43% ▼ -8.00%
- Median HH income
- $42,195
- Composite
- 30.8/100
- National rank
- #6145
- State rank
- #11 of 55 in WV
Livability — Fairmont
- Score
- 70/100
- State rank
- #64
- US rank
- #8054
Category grades
Schools grade is shown separately in the Schools card above.
Census & demographics
- Census place
- Fairmont, WV
- Population (ZIP)
- 42,116
Population outlook (Marion County) Hauer SSP2
- Today (2025)
- 56,923 people
- By 2030
- 56,850 · -0.1%
- By 2040
- 56,469 · -0.8%
- By 2050
- 56,027 · -1.6%
- By 2075
- 55,509 · -2.5%
- By 2100
- 51,082 · -10.3%
Race, ethnicity, and origin ACS 2023
- Neighborhood character
- Predominantly White (90%)
- Race & ethnicity
- White 90% Two or more races 5% Black 3% Hispanic / Latino 2%
- Common ancestry
- Romanian 3% Slovak 2% Iranian 2%
- Foreign-born
- 1%
- Languages at home
- 98% English-only · Spanish 1%
Political lean MEDSL · Marion
- 2024 margin
- Solid R (+31.2) · D 33.2% · R 64.5% · Other 2.3%
- 2008→2024 swing
- -31.7pp toward R · 2008: 0.5pp · 2024: -31.2pp
- All cycles
- 2024: R+31.2 2020: R+28.7 2016: R+33.5 2012: R+14.4 2008: D+0.5
Not yet ingested
- Civics
- —
Market trends
- HPI YoY
- ▼ -30.86%
- Current HPI
- 240.9967
- Rent YoY
- —
- Metro
- —
- State GDP YoY
- —
- F500 in state
- 0
Price history
+354.5% since first listed2 events — show timeline
- 2026-04-17 Listed $250,000 NCWVREIN
- 2007-06-08 Sold (Public Records) $55,000 Public Records
Property tax history
+13.7%/yrLatest (2025): $1,365 · -1.5% YoY. Source: county tax records.
Cash-flow waterfall
monthlySold comps — $/sqft
last 12 mo · ≤1 miLoading sold comps…