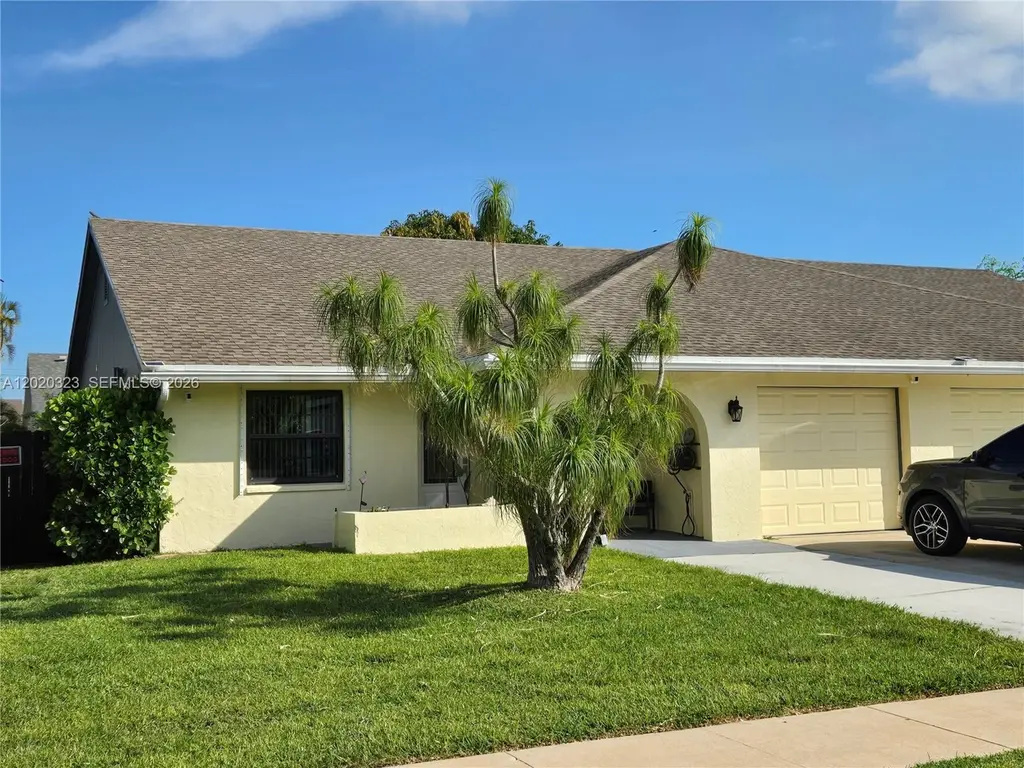
12051 Suellen Cir · Wellington, FL
Flood risk 3/10 · Minor
- FEMA flood zone
- X (unshaded)
- Chance of flooding over 30 yrs
- 0.17%
- Est. flood insurance / yr
- $507 – $1,088
Fire risk 1/10 · Minimal
- Est. fire insurance / yr
- $947 – $1,759
Heat risk 10/10 · Severe
- Hot days now (above 107°F)
- 7 days/yr
- Hot days in 30 yrs
- 27 days/yr
Wind risk 10/10 · Severe
- Chance of severe wind over 30 yrs
- 99.0%
Air-quality risk 2/10 · Minimal
- Unhealthy air days now
- 0 days/yr
- Unhealthy air days in 30 yrs
- 1 days/yr
Risk factors via First Street. Map © Google.
Why this score? — see what drove the D grade
The composite is a weighted blend of 9 inputs, each scored 0–100. Each bar is that input's sub-score; the figure is the points it added to the 100-point composite (weight × sub-score).
- Cash flow +13.8/30.0
- ARV discount +7.5/15.0
- Schools +4.3/10.0
- DSCR +4.2/10.0
- Livability +3.7/5.0
- 1% rule +3.1/10.0
- Rent growth +3.1/5.0
- Condition / age +2.5/5.0
- Appreciation +0.0/10.0
$397,500
🖨 Deal sheet (PDF) 📄 Offer letter ✓ Due diligence
Listing remarks
This is the one — the home you’ve been searching for. A true move-in-ready gem where everything has already been done for you. The kitchen and guest bathroom have been beautifully renovated. new flooring runs throughout. AC 2023, Refrigerator & Range 2024, home has been painted inside and out 2025-26. With newer roof (2020) plus impact windows and doors(2022), you’ll enjoy complete storm protection and total peace of mind. Relax on the screened porch overlooking your private, fully fenced backyard, the perfect spot to unwind in your tastefully updated home. The association handles all lawn care, giving you even more time to enjoy life with family and friends. This im
Key facts
- Garage
- Built 1980
- Listed 4 days
Property features AI
Finance
- Other: Pets allowed with restrictions
- HOA & community: Quarterly association fee of $300 (includes grounds maintenance)
Exterior
- Parking: Garage with 1 covered space; Two or more parking spaces
- Security: Security/high-impact doors; Smoke detector(s)
- Utilities: Cable available
- Home design: Single-story; Resale home; Block construction; First-floor entry; Has attached property
- Construction: Block construction; Resale
- Exterior features: Enclosed porch; Porch with screened area; Fence; Privacy wall; Security/high-impact doors; Smoke detector(s)
Interior
- Kitchen: Dishwasher; Electric range; Disposal; Microwave; Refrigerator
- Bedrooms: Bedroom on main level
- Flooring: Laminate flooring; Tile flooring
- Bathrooms: 2 full bathrooms
- Heating & cooling: Central heating (electric); Central air conditioning (electric); Ceiling fans
- Interior features: Impact glass windows; Breakfast bar; Built-in features; First-floor entry; Living/dining room; Bedroom on main level; Great room
Neighborhood map
What this means for you Summary
Snapshot
- This is a 3-bed/2.0-bath single-family listed at $398k.
Deal economics
- At list price, monthly cash flow is $33 ($397/yr) — positive.
- The deal already cash-flows at list — no discount required.
- To meet the 1% rule (rent ≥ 1% of price), the offer needs to be $321k (19.2% below list).
- Recommended offer: $321k (19.2% below list) — sets the bar for 1% rule.
- Cap rate 6.4% vs local median 3.4% in Wellington — top-decile yield for the area; either an underpriced asset or a hidden risk that comps aren't pricing in. Stress-test before assuming the spread holds.
Location & tenants
- Location reads 73/100 on livability (#294 in FL, #4,986 nationally) — a middle-class / working-renter tenant base. Strengths: crime A+, employment A+, housing A+; Watch: amenities F, commute F, cost of living F.
- Palm Beach (suburban): math 46% / reading 53% proficiency, ranked #34 of 73 in FL (top 47%) — families likely to look elsewhere, expect single-tenant / working-renter base with shorter leases.
- Zoned schools: Elbridge Gale Elementary School (math 70% / reading 75%, grade A, #281 of 2,144 statewide, top 13%, 915 students, 40% FRL); Emerald Cove Middle School (math 61% / reading 64%, grade B+, #116 of 571 statewide, top 21%, 1,241 students, 36% FRL); Wellington High School (math 57% / reading 65%, grade C+, #102 of 667 statewide, top 15%, 2,688 students, 29% FRL) — zoned schools average 35% FRL vs 52% district-wide (17 pts lower); this property's tenant base skews higher-income than the district average.
- Zoned-school proficiency averages 65% at this address vs 50% district-wide (+16 pts) — the actual schools serving this property are materially stronger than the Palm Beach average implies; a family-tenant draw the district grade alone would hide.
- Market conditions: Rents rising (+2.3%/yr); 621 active listings in the ZIP; 40 comparable units currently listed for rent nearby; rentals at typical pace (median 26d on market — plan ~3-4 weeks tenant-placement turnaround); high-income renter base; 3,974 units permitted in Palm Beach County in 2024 (1,012 in 5+ unit buildings).
- This rent runs 34% of the median local income ($112k/yr) — at the standard rent-burdened threshold; future hikes will face affordability resistance.
Forward outlook
- Local home prices are declining (-3.0%/yr); year-one equity from $3k of loan paydown is wiped out by about $12k of value loss. Plan a longer hold.
- Palm Beach County population projected at +30% by 2050 — long-run rental-demand tailwind backs the buy-and-hold thesis.
Negotiation context
- Only 4 days on market — expect competitive offers; lowballing is unlikely to land.
- 2 sale attempts since 31y ago with the ask held roughly flat each time — persistent listings suggest the price (not the market) is what's stuck; bring a comps-based counter.
- Current owner paid $178k; list at $398k implies a 124% gain — meaningful room to come down on a strong offer.
Risks & watch-outs
- Climate carrying-cost: severe wind risk, 99% chance of damaging wind over 30y; extreme-heat days projected 7→27/yr by 2055 (HVAC capex compounding) — expect insurance premiums to compound above CPI over the hold.
Questions for the listing agent
- What does the HOA fee cover, when was the last increase, and are there any pending special assessments or reserve-fund shortfalls?
- Is there a deadline driving the sale (1031 exchange, divorce, estate, relocation)? That informs how much negotiation room exists.
- Schools are A-rated — typically a magnet for longer-tenancy family renters. What's the average tenant stay here, and is there a school-zone premium baked into asking?
- The area grade is low — what's the realistic commute time and amenity access for the typical tenant pool here? Any planned neighborhood developments (good or bad) we should know about?
- What's the average days-on-market for RENTAL listings here right now (not sales)? A rising rental-DOM trend means longer vacancies and softer asking-rent achievability than the comps imply.
- What's the recent tenant-quality profile in this submarket — average credit score on applications, eviction rate, late-payment / NSF rate, and stable-employment percentage? A property-management company in the area should have these aggregated.
- How much new for-sale + rental construction is in the pipeline within 1–3 miles? Heavy new supply typically softens prices + rents 12–24 months out; constrained supply supports both.
Investment metrics
- 1% rule
- 0.81% ✗
- Cap rate
- 6.39%
- Cash-on-cash
- 0.36%
- DSCR
- 1.02
- GRM
- 10.3
CMA / ARV
No comps found within radius.
Projected returns pro-forma
-3.0% appreciation · 2.31% rent growth · sell at horizon
- IRR
- -16.5%
- Equity multiple
- 0.42×
- Total profit
- $-64,620
- Equity at exit
- $59,269
- IRR
- -9.5%
- Equity multiple
- 0.43×
- Total profit
- $-62,928
- Equity at exit
- $34,369
Cash invested: $111,300 (down + closing). Projections, not guarantees.
Landlord ↔ Tenant lean methodology
- Overall (STATE)
- 87 Strongly Landlord-Friendly
- State Florida
- 87 Strongly Landlord-Friendly · R+3
- County
- — inherits STATE
- City
- — inherits STATE
ZIP-level market 33414
- Home prices YoY
- -30.2%
- Rents YoY
- 2.3%
- Active inventory
- 621
- Price-to-rent
- 10.3×
Monthly cashflow live
- Estimated rent
- $3,211 high interval (Pro) →
- Mortgage (P&I)
- −$2,085
- Tax from tax record
- −$153 /mo · $1,840/yr
- Insurance
- −$166
- HOA
- −$100
- Vacancy / Maint / Mgmt
- −$674
- Net cashflow
- $33
Break-even live
Sensitivity live
| Price | -10% $258 | -5% $146 | +0% $33 | +5% $-79 | +10% $-192 |
|---|---|---|---|---|---|
| Rent | -10% $-221 | -5% $-94 | +0% $33 | +5% $160 | +10% $287 |
| Rate | -1.0pp $233 | -0.5pp $134 | base $33 | +0.5pp $-70 | +1.0pp $-175 |
UW: 25.0% down · 7.5% · 30yr · 1.5% tax · 5.0% vac · 8.0% maint · 8.0% mgmt
Financing live
Cash to close
- Down payment
- $99,375
- Closing costs
- $11,925
- Reserves months
- —
- Total cash needed
- —
Loan-product check · same deal, 3 products live
Conventional
25% down · 7.5% · 30yr
- Down + closing
- —
- Monthly P&I
- —
- Monthly cashflow
- —
- DSCR
- —
- Eligible?
- —
Personal DTI + credit; lowest rate.
DSCR
20% down · 8.5% · 30yr
- Down + closing
- —
- Monthly P&I
- —
- Monthly cashflow
- —
- DSCR
- —
- Eligible?
- —
No personal income docs; deal must DSCR.
Hard money
10% down · 12.0% · 12mo
- Down + closing
- —
- Monthly P&I
- —
- Monthly cashflow
- —
- DSCR
- —
- Eligible?
- —
Short-term bridge; refi at stabilization.
Rent comps 40 comps
| Address | Beds | Baths | Sqft | Rent | $/sqft | DOM | Units | Dist |
|---|---|---|---|---|---|---|---|---|
| 11925 Suellen Cir Wellington, FL | 3.0 | 2.0 | 1695 | $2,700 | $1.59 | 24d | 1 | 0.04mi |
| 11862 Brier Patch Ct E Wellington, FL | 3.0 | 2.5 | 1320 | $3,500 | $2.65 | 26d | 1 | 0.06mi |
| 11830 Brier Patch Ct E Wellington, FL | 3.0 | 2.5 | 1496 | $2,750 | $1.84 | 26d | 1 | 0.09mi |
| 1569 Shaker Cir Wellington, FL | 2.0 | 2.5 | 1577 | $3,500 | $2.22 | 26d | 1 | 0.09mi |
| 1604 Shaker Cir Wellington, FL | 3.0 | 2.5 | 1622 | $2,800 | $1.73 | 26d | 1 | 0.12mi |
| 11894 Donlin Dr Unit 11894 Wellington, FL | 3.0 | 2.5 | 1720 | $3,800 | $2.21 | 1d | 1 | 0.19mi |
| 1520 Shaker Cir Wellington, FL | 3.0 | 2.5 | 1622 | $3,000 | $1.85 | 26d | 1 | 0.19mi |
| 11937 Sturbridge Ln Wellington, FL | 3.0 | 2.0 | 1156 | $2,000 | $1.73 | 26d | 1 | 0.19mi |
| 1453 White Pine Dr Wellington, FL | 2.0 | 2.0 | 1492 | $2,900 | $1.94 | 9d | 1 | 0.28mi |
| 1437 White Pine Dr Wellington, FL | 2.0 | 2.0 | 1172 | $2,300 | $1.96 | 9d | 1 | 0.29mi |
| 1665 Cabot Ln Unit A3 Wellington, FL | 2.0 | 2.0 | 1315 | $2,500 | $1.90 | 26d | 1 | 0.30mi |
| 1665 Cabot Ln Unit A4 Wellington, FL | 2.0 | 2.0 | 1315 | $2,500 | $1.90 | 18d | 1 | 0.30mi |
| 1403 White Pine Dr Wellington, FL | 2.0 | 2.0 | 1444 | $2,400 | $1.66 | 9d | 1 | 0.32mi |
| 12244 Sag Harbor Ct #2 Wellington, FL | 3.0 | 2.5 | 1661 | $3,000 | $1.81 | 26d | 1 | 0.33mi |
| 1456 Waterway Cove Dr Wellington, FL | 3.0 | 2.0 | 1585 | $3,650 | $2.30 | 26d | 1 | 0.33mi |
| 1348 The 12th Fairway Wellington, FL | 2.0 | 2.0 | 1444 | $2,800 | $1.94 | 26d | 1 | 0.34mi |
| 11780 Saint Andrews Pl Wellington, FL | 2.0–3.0 | 2.0 | 1403 | $2,800 | $2.00 | 9d | 3 | 0.36mi |
| 11780 Saint Andrews Pl Wellington, FL | 2.0–3.0 | 2.0 | 1482 | $2,800 | $1.89 | 26d | 3 | 0.36mi |
| 11790 Saint Andrews Pl #302 Wellington, FL | 3.0 | 2.0 | 1479 | $2,780 | $1.88 | 6d | 1 | 0.37mi |
| 11770 Saint Andrews Pl Wellington, FL | 2.0–3.0 | 2.0 | 1403 | $3,500 | $2.49 | 9d | 4 | 0.37mi |
| 11770 Saint Andrews Pl Wellington, FL | 2.0–3.0 | 2.0 | 1403 | $3,500 | $2.49 | 24d | 5 | 0.37mi |
| 11790 Saint Andrews Pl Wellington, FL | 2.0–3.0 | 2.0 | 1405 | $2,780 | $1.98 | 1d | 2 | 0.37mi |
| 11790 Saint Andrews Pl Wellington, FL | 2.0–3.0 | 2.0 | 1405 | $2,950 | $2.10 | 18d | 3 | 0.37mi |
| 1352 Wyndcliff Dr Wellington, FL | 4.0 | 2.0 | 1740 | $5,000 | $2.87 | 26d | 1 | 0.39mi |
| 11789 Saint Andrews Pl #103 Wellington, FL | 2.0 | 2.5 | 1427 | $2,800 | $1.96 | 26d | 1 | 0.39mi |
| 11785 Saint Andrews Pl #106 Wellington, FL | 2.0 | 2.5 | 1401 | $3,000 | $2.14 | 20d | 1 | 0.40mi |
| 11775 Saint Andrews Pl #103 Wellington, FL | 2.0 | 2.5 | 1427 | $5,500 | $3.85 | 4d | 1 | 0.40mi |
| 11771 Saint Andrews Pl #101 Wellington, FL | 2.0 | 2.5 | 1401 | $6,800 | $4.85 | 22d | 1 | 0.40mi |
| 11771 Saint Andrews Pl #104 Wellington, FL | 2.0 | 2.5 | 1401 | $2,700 | $1.93 | 6d | 1 | 0.40mi |
| 11750 Saint Andrews Pl Wellington, FL | 2.0–3.0 | 2.0 | 1351 | $2,700 | $2.00 | 26d | 2 | 0.40mi |
| 11750 Saint Andrews Pl Wellington, FL | 2.0–3.0 | 2.0 | 1351 | $2,700 | $2.00 | 26d | 2 | 0.40mi |
| 11730 Saint Andrews Pl #302 Wellington, FL | 3.0 | 2.0 | 1479 | $3,000 | $2.03 | 26d | 1 | 0.43mi |
| 11720 Saint Andrews Pl Wellington, FL | 2.0–3.0 | 2.0 | 1405 | $6,000 | $4.27 | 21d | 2 | 0.43mi |
| 11740 Saint Andrews Pl Wellington, FL | 3.0 | 2.0 | 1556 | $5,350 | $3.44 | 9d | 2 | 0.44mi |
| 11740 St Andrews Pl Wellington, FL | 3.0 | 2.0 | 1479 | $5,500 | $3.72 | 26d | 1 | 0.44mi |
| 12738 Peconic Ct Wellington, FL | 3.0 | 2.5 | 1428 | $2,800 | $1.96 | 18d | 1 | 0.46mi |
| 12722 Peconic Ct Wellington, FL | 2.0 | 2.5 | 1482 | $2,150 | $1.45 | 16d | 1 | 0.47mi |
| 2106 Wingate Bnd Wellington, FL | 3.0 | 2.0 | 1812 | $2,500 | $1.38 | 26d | 1 | 0.49mi |
| 2175 Wingate Bnd Wellington, FL | 3.0 | 2.0 | 1482 | $2,800 | $1.89 | 26d | 1 | 0.49mi |
| 12768 Westhampton Cir Wellington, FL | 3.0 | 2.5 | 1779 | $2,600 | $1.46 | 26d | 1 | 0.51mi |
HOA detail
- Monthly dues
- $100 · $1,200/yr
- Likely covers
- landscaping
Listing history 1 events
-
2026-05-31status $397,500 Pending 4 DOM
ⓘ Source: listings_history table (triggers on properties + properties_extension) + one-shot
backfill from property_details.listing_events for pre-trigger history.
Tax reassessment forecast FL · Resets to sale price
- Current annual tax
- $1,840 · $153/mo
- Projected year-2 tax
- $3,299 · $275/mo
- Expected delta
- +$1,460/yr (+$122/mo · 79.4%)
ⓘ Screening estimate from a state-policy table — verify with the county assessor before closing.
Climate risk First Street
- Flood 3/10 Moderate FEMA zone X (unshaded) · 17% chance over 30 yrs
- Wildfire 1/10 Low
- Heat 10/10 Extreme 7 d/yr ≥107°F today · 27 d/yr by 30 yrs out
- Wind 10/10 Extreme 99% chance of damaging wind over 30 yrs
- Air quality 2/10 Low 0 unhealthy d/yr today · 1 by 30 yrs out
Nearby sold comps map
Loading sold comps map…
Walkable amenities ~0.75 mi
Loading nearby amenities…
Taxation est. · year 1
- Rental income
- $38,530
- − Mortgage interest
- −$22,266
- − Property taxes
- −$1,840
- − Insurance
- −$1,988
- − Repairs & maintenance
- −$3,082
- − Management
- −$3,082
- − HOA
- −$1,200
- − Depreciation
- −$11,564
- Taxable loss
- −$6,492
- Est. tax savings @ 24.0%
- +$1,558
- After-tax cash flow
- $1,955/yr
For passive investors: Depreciation is non-cash, so a rental often shows a tax loss while cash-flowing — sheltering income. Rental losses are passive: they offset passive income freely, and up to $25,000/yr can offset ordinary (W-2) income if you actively participate and your MAGI is under $100k (phasing out to $0 by $150k); unused losses carry forward. On sale, claimed depreciation is recaptured at up to 25%, and gains may owe capital-gains tax (a 1031 exchange can defer both). Figures are a year-1 estimate at your 24.0% rate — not tax advice; consult a CPA.
Schools (NCES district)
- District
- Palm Beach
- NCES district ID
- 1201500
- Math proficiency
- 46% ▼ -16.00%
- Reading proficiency
- 53% ▼ -4.00%
- Median HH income
- $53,943
- Composite
- 42.72/100
- National rank
- #3160
- State rank
- #34 of 73 in FL
Livability — Wellington
- Score
- 73/100
- State rank
- #294
- US rank
- #4986
Category grades
Schools grade is shown separately in the Schools card above.
Census & demographics
- Census place
- Wellington, FL
- County
- Palm Beach County · 1,438,312 people
- City population
- 60,184
- Metro
- Miami-Fort Lauderdale-Pompano Beach, FL
- Population (ZIP)
- 60,184
- Household income
- $112,241
- Rent vs Own
- Severe rent burden
- 1566.0
Population outlook (Palm Beach County) Hauer SSP2
- Today (2025)
- 1,637,487 people
- By 2030
- 1,743,255 · +6.5%
- By 2040
- 1,948,712 · +19.0%
- By 2050
- 2,132,979 · +30.3%
- By 2075
- 2,530,027 · +54.5%
- By 2100
- 2,706,979 · +65.3%
Race, ethnicity, and origin ACS 2023
- Neighborhood character
- Diverse neighborhood (Simpson 0.67)
- Race & ethnicity
- White 47% Hispanic / Latino 29% Two or more races 20% Black 13% Asian 6%
- Hispanic origin (detail)
- Mexican 4% Puerto Rican 5% Cuban 6% Dominican 1% Salvadoran 1%
- Common ancestry
- Hispanic 4% Romanian 3% Lithuanian 2%
- Foreign-born
- 26% · Canada, Jamaica, China
- Languages at home
- 67% English-only · Spanish 23% French/Haitian/Cajun 3% Other Indo-European 3%
Political lean MEDSL · Palm Beach
- 2024 margin
- Toss-up / Even · D 50.0% · R 49.2%
- 2008→2024 swing
- -22.1pp toward R · 2008: 22.9pp · 2024: 0.8pp
- All cycles
- 2024: D+0.8 2020: D+12.8 2016: D+15.3 2012: D+17.0 2008: D+22.9
Not yet ingested
- Civics
- —
Market trends
- HPI YoY
- ▼ -152.58%
- Current HPI
- 352.9366
- Rent YoY
- ▲ 2.31%
- Metro
- Miami-Fort Lauderdale-Pompano Beach, FL
- State GDP YoY
- ▲ 3.28%
- F500 in state
- 36
Industry mix (Fortune 500 HQ in FL)
| Industry | F500 HQs | Revenue |
|---|---|---|
| Industrial Technology | 2 | $29B |
|
||
| Insurance | 2 | $17B |
|
||
| Retail | 1 | $60B |
|
||
| Technology Distribution | 1 | $58B |
|
||
| Homebuilding | 1 | $35B |
|
||
| Technology Manufacturing | 1 | $35B |
|
||
Price history
+396.9% since first listed8 events — show timeline
- 2026-05-30 Pending — MARMLS
- 2026-05-27 Listed $397,500 MARMLS
- 2004-11-02 Sold (Public Records) $177,500 Public Records
- 2002-07-23 Listing Removed — Beaches MLS
- 1996-06-18 Sold (Public Records) $75,000 Public Records
- 1996-06-18 Sold (Public Records) $75,000 Public Records
- 1995-10-12 Listed $79,900 Beaches MLS
- 1987-10-01 Sold (Public Records) $80,000 Public Records
Property tax history
+2.0%/yrLatest (2025): $1,840 · +4.6% YoY. Source: county tax records.
Cash-flow waterfall
monthlySold comps — $/sqft
last 12 mo · ≤1 miLoading sold comps…