 6-Plex
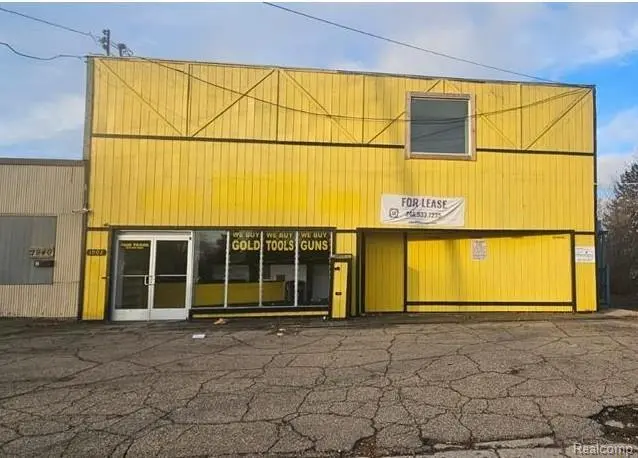
1902 Fenton Rd · Flint, MI
Flood risk No data
- FEMA flood zone
- —
- Chance of flooding over 30 yrs
- —
- Est. flood insurance / yr
- —
Fire risk No data
- Est. fire insurance / yr
- —
Heat risk No data
- Hot days now (above threshold)
- —
- Hot days in 30 yrs
- —
Wind risk No data
- Chance of severe wind over 30 yrs
- —
Air-quality risk No data
- Unhealthy air days now
- —
- Unhealthy air days in 30 yrs
- —
Risk factors via First Street. Map © Google.
Why this score? — see what drove the B- grade
The composite is a weighted blend of 9 inputs, each scored 0–100. Each bar is that input's sub-score; the figure is the points it added to the 100-point composite (weight × sub-score).
- Cash flow +30.0/30.0
- 1% rule +10.0/10.0
- DSCR +10.0/10.0
- ARV discount +7.5/15.0
- Livability +3.7/5.0
- Rent growth +2.2/5.0
- Condition / age +2.2/5.0
- Schools +1.1/10.0
- Appreciation +0.0/10.0
$269,000
🖨 Deal sheet (PDF) 📄 Offer letter ✓ Due diligence
Multi-family units
County records classify this as Multi-Family (5+ Unit). Listing-text estimate: 6 units. confirmed
5+ unit building — per-unit beds/baths from public records are typically unavailable; the breakdown below (if shown) is an estimate from the listing text.
Listing remarks MLS
Reduced 6-unit multifamily property with an additional retail space, offering strong income potential. Rare investment opportunity with flexible land contract terms available. Priced to move - don't miss your chance, this one will go fast.
Key facts
- 6,970 sq ft lot
- Listed 65 days
Property features AI
Finance
- Other: Zoning: Commercial, MultiFamily; Lot dimensions approximately 67.5 x 100 (0.16 acres)
- Financial info:
- HOA & community:
Exterior
- Parking:
- Security:
- Utilities: Public water; Public sewer
- Home design: Residential income property (multi-family); Two levels; Subdivision: PLAT OF FENTON HILL SUB; Cross street near 12th St and Fenton Rd; Directions: Follow Fenton Rd to property
- Construction: Block and other construction materials; Slab foundation; Built-up area above grade: 5,962 square feet
- Exterior features: Paved road access; Pets not allowed
Interior
- Kitchen:
- Bedrooms: Multiple 1-bedroom units (each listed as 1 bedroom)
- Flooring:
- Bathrooms: Each unit contains one bathroom
- Heating & cooling: Baseboard heating; Heat pump; Hot water heating; Zoned heating; No central cooling
- Interior features: Six full bathrooms
- Laundry & utility:
Neighborhood map
What this means for you Summary
Snapshot
- This is a 6 × 6-bed/6.0-bath units multifamily listed at $269k. Condition is rated fair.
Deal economics
- At list price, monthly cash flow is $5k ($55k/yr) — positive. Per door: $769/mo.
- The deal already cash-flows at list — no discount required.
- Meets the 1% rule at list price ($8k rent vs $269k).
- Recommended offer: $253k (6.0% below list) — sets the bar for market timing.
- Cap rate 26.9% vs local median 11.5% in Flint — top-decile yield for the area; either an underpriced asset or a hidden risk that comps aren't pricing in. Stress-test before assuming the spread holds.
Location & tenants
- Location reads 74/100 on livability (#196 in MI, #4,946 nationally) — a middle-class / working-renter tenant base. Strengths: commute A+, cost of living A+, housing A+; Watch: crime F, employment F.
- Flint School District (urban): math 7% / reading 13% proficiency, ranked #714 of 760 in MI (top 94%) — low school quality limits family demand, transient renter base, plan for 1-2y turnover; 83% free/reduced lunch — lower-income household profile, screen leases tightly.
- Zoned schools: Holmes Stem Middle School Academy (math 10% / reading 30%, grade F, #420 of 493 statewide, top 86%, 324 students, 90% FRL).
- Market conditions: Rents soft (-1.0%/yr); 207 active listings in the ZIP; 419 units permitted in Genesee County in 2024 (68 in 5+ unit buildings).
- At $8,193/mo this rent would consume 211% of the median local household income ($47k/yr) (locally 1534% of renters already pay >50% of income on rent) — very limited rent-growth headroom before tenants either downsize or default.
Forward outlook
- Local home prices are declining (-3.0%/yr); year-one equity from $2k of loan paydown is wiped out by about $8k of value loss. Plan a longer hold.
- Genesee County population projected at -27% by 2050 — secular population decline; favor cash flow + early exit over multi-decade hold.
- At projected returns (-3.0% appreciation + 0.0% rent growth), your $75k cash investment doubles in ~2 years — after that, you're playing with house money.
Negotiation context
- It's been on market 65 days — a 6% lower offer ($253k) is reasonable based on typical stale-listing flexibility.
- 10 sale attempts since 3y ago with the ask held roughly flat each time — persistent listings suggest the price (not the market) is what's stuck; bring a comps-based counter.
Questions for the listing agent
- It's been on market 65 days. Have you received any prior offers? Is the seller open to a 6% concession, seller financing, or rate buy-down credit?
- Can we see the unit-by-unit rent roll, current vacancy, and any below-market leases? What's the average tenancy length?
- What capital expenditures (roof, boiler, parking lot, exteriors) have been made in the last 5 years, and what's planned in the next 2?
- Have any recent inspections been done? Can we get a copy of the seller's disclosures and any deferred-maintenance estimates?
- Why hasn't it sold? Are there any deal-killer items the seller is aware of (foundation, flood, title, zoning, code violations)?
- Is there a deadline driving the sale (1031 exchange, divorce, estate, relocation)? That informs how much negotiation room exists.
- Schools are F-rated, which usually means shorter tenancies and higher turnover. Who's the typical renter profile here, and what's been the actual vacancy rate?
- Crime grade is F in this area — have there been break-ins, vandalism, or insurance claims at this property in the last 3 years? What carrier currently insures it and at what premium?
- What's the average days-on-market for RENTAL listings here right now (not sales)? A rising rental-DOM trend means longer vacancies and softer asking-rent achievability than the comps imply.
- What's the recent tenant-quality profile in this submarket — average credit score on applications, eviction rate, late-payment / NSF rate, and stable-employment percentage? A property-management company in the area should have these aggregated.
- How much new apartment / multifamily construction is in the pipeline within 1–3 miles? Heavy new supply (>2% of stock underway) typically softens rents 12–24 months out; light construction supports rent growth.
Investment metrics
- 1% rule
- 3.05% ✓
- Cap rate
- 26.87%
- Cash-on-cash
- 73.50%
- DSCR
- 4.27
- GRM
- 2.7
CMA / ARV
No comps found within radius.
Projected returns pro-forma
-3.0% appreciation · 0.0% rent growth · sell at horizon
- IRR
- 69.8%
- Equity multiple
- 4.01×
- Total profit
- $226,358
- Equity at exit
- $40,109
- IRR
- 73.0%
- Equity multiple
- 7.42×
- Total profit
- $483,179
- Equity at exit
- $23,258
Cash invested: $75,320 (down + closing). Projections, not guarantees.
Landlord ↔ Tenant lean methodology
- Overall (STATE)
- 62 Landlord-Friendly
- State Michigan
- 62 Landlord-Friendly · EVEN
- County
- — inherits STATE
- City
- — inherits STATE
ZIP-level market 48507
- Rents YoY
- -1.0%
- Active inventory
- 207
- Price-to-rent
- 16.4×
Monthly cashflow live
- Estimated rent
- $8,193 medium interval (Pro) →
- Mortgage (P&I)
- −$1,411
- Tax est. 1.5%
- −$336 /mo · $4,035/yr
- Insurance
- −$112
- HOA
- −$0
- Vacancy / Maint / Mgmt
- −$1,721
- Net cashflow
- $4,613
Break-even live
Sensitivity live
| Price | -10% $4,799 | -5% $4,706 | +0% $4,613 | +5% $4,521 | +10% $4,428 |
|---|---|---|---|---|---|
| Rent | -10% $3,966 | -5% $4,290 | +0% $4,613 | +5% $4,937 | +10% $5,261 |
| Rate | -1.0pp $4,749 | -0.5pp $4,682 | base $4,613 | +0.5pp $4,544 | +1.0pp $4,473 |
6-unit breakdown (identical units grouped — click to expand)
| Units | Beds | Baths | Est. rent |
|---|---|---|---|
| 6× units | 6 | 6 | $8,196 |
| #1 | 6 | 6 | $1,366 |
| #2 | 6 | 6 | $1,366 |
| #3 | 6 | 6 | $1,366 |
| #4 | 6 | 6 | $1,366 |
| #5 | 6 | 6 | $1,366 |
| #6 | 6 | 6 | $1,366 |
| Total (6 units) | $8,193 | ||
UW: 25.0% down · 7.5% · 30yr · 1.5% tax · 5.0% vac · 8.0% maint · 8.0% mgmt
Financing live
Cash to close
- Down payment
- $67,250
- Closing costs
- $8,070
- Reserves months
- —
- Total cash needed
- —
Loan-product check · same deal, 3 products live
Conventional
25% down · 7.5% · 30yr
- Down + closing
- —
- Monthly P&I
- —
- Monthly cashflow
- —
- DSCR
- —
- Eligible?
- —
Personal DTI + credit; lowest rate.
DSCR
20% down · 8.5% · 30yr
- Down + closing
- —
- Monthly P&I
- —
- Monthly cashflow
- —
- DSCR
- —
- Eligible?
- —
No personal income docs; deal must DSCR.
Hard money
10% down · 12.0% · 12mo
- Down + closing
- —
- Monthly P&I
- —
- Monthly cashflow
- —
- DSCR
- —
- Eligible?
- —
Short-term bridge; refi at stabilization.
Listing history 40 events
-
2026-06-21days on market $269,000 Active 65 DOM
-
2026-06-18days on market $269,000 Active 62 DOM
-
2026-06-17days on market $269,000 Active 61 DOM
-
2026-06-16days on market $269,000 Active 60 DOM
-
2026-06-15days on market $269,000 Active 59 DOM
-
2026-06-14days on market $269,000 Active 57 DOM
-
2026-06-13days on market $269,000 Active 56 DOM
-
2026-06-10days on market $269,000 Active 54 DOM
-
2026-06-09days on market $269,000 Active 53 DOM
-
2026-06-08days on market $269,000 Active 52 DOM
-
2026-06-07days on market $269,000 Active 51 DOM
-
2026-06-05days on market $269,000 Active 48 DOM
-
2026-06-03days on market $269,000 Active 47 DOM
-
2026-06-02days on market $269,000 Active 46 DOM
-
2026-06-01days on market $269,000 Active 45 DOM
-
2026-05-31days on market $269,000 Active 44 DOM
-
2026-05-30days on market $269,000 Active 43 DOM
-
2026-04-17$269,000 Active
Show marketing remark (239 chars)
Reduced 6-unit multifamily property with an additional retail space, offering strong income potential. Rare investment opportunity with flexible land contract terms available. Priced to move - don't miss your chance, this one will go fast.
-
2026-04-17$269,000 Active 239-char remark
Show marketing remark (239 chars)
Reduced 6-unit multifamily property with an additional retail space, offering strong income potential. Rare investment opportunity with flexible land contract terms available. Priced to move - don't miss your chance, this one will go fast.
-
2025-08-01historical
-
2025-08-01historical
-
2025-03-21historical
-
2025-03-21status Active
-
2025-01-17historical
-
2025-01-16$349,000 Active
-
2025-01-16$349,000 Active
-
2025-01-16$349,000 Active
-
2024-07-20historical $650
-
2024-04-10$650
-
2024-04-10historical $650
-
2024-03-13$650
-
2023-09-09historical
-
2023-03-10soldstatus $280,000 Sold
-
2023-03-10soldstatus $280,000 Closed
-
2023-02-22status Pending
-
2023-02-22status Pending
-
2023-02-05historical Accepting Backup Offers
-
2023-02-05historical Accepting Backup Offers
-
2023-01-16$325,000 Active
-
2023-01-16$325,000 Active
ⓘ Source: listings_history table (triggers on properties + properties_extension) + one-shot
backfill from property_details.listing_events for pre-trigger history.
Nearby sold comps map
Loading sold comps map…
Walkable amenities ~0.75 mi
Loading nearby amenities…
Taxation est. · year 1
- Rental income
- $98,316
- − Mortgage interest
- −$15,068
- − Property taxes
- −$4,035
- − Insurance
- −$1,345
- − Repairs & maintenance
- −$7,865
- − Management
- −$7,865
- − Depreciation
- −$7,825
- Taxable income
- $54,312
- Est. tax owed @ 24.0%
- −$13,035
- After-tax cash flow
- $42,327/yr
For passive investors: Depreciation is non-cash, so a rental often shows a tax loss while cash-flowing — sheltering income. Rental losses are passive: they offset passive income freely, and up to $25,000/yr can offset ordinary (W-2) income if you actively participate and your MAGI is under $100k (phasing out to $0 by $150k); unused losses carry forward. On sale, claimed depreciation is recaptured at up to 25%, and gains may owe capital-gains tax (a 1031 exchange can defer both). Figures are a year-1 estimate at your 24.0% rate — not tax advice; consult a CPA.
Condition & rehab AI · 12 photos
This 6-unit multifamily property requires extensive repairs and updates to improve its condition and value. Significant investments in the exterior, HVAC, and interior spaces are necessary to make it move-in ready.
Repairs flagged
- Major roof — Exposed insulation and potential water damage
- Major exterior siding — Weathered and peeling
- Major HVAC system — No visible systems, likely outdated
- Major kitchen cabinets — Old and worn
- Major bathroom fixtures — Old and dated
- Major landscaping — Overgrown and unkempt
Value-add opportunities
- Both exterior siding and roof repair — Improves curb appeal and structural integrity
- Both HVAC system replacement — Enhances comfort and energy efficiency
- Both kitchen and bathroom updates — Modernizes spaces and increases appeal
- Both landscaping and curb appeal — Enhances overall property value and appeal
Renovation cost estimate screening
| Repair item | Severity | Est. cost |
|---|---|---|
| roof · Exposed insulation and potential water damage | Major | $15,000–50,000 |
| exterior siding · Weathered and peeling | Major | $15,000–50,000 |
| HVAC system · No visible systems, likely outdated | Major | $15,000–50,000 |
| kitchen cabinets · Old and worn | Major | $15,000–50,000 |
| bathroom fixtures · Old and dated | Major | $15,000–50,000 |
| landscaping · Overgrown and unkempt | Major | $15,000–50,000 |
| Total estimated repair cost · 6 items | $90,000–300,000 |
Value-add ROI direction
- Both exterior siding and roof repair — Improves curb appeal and structural integrity ↑
- Both HVAC system replacement — Enhances comfort and energy efficiency ↑
- Both kitchen and bathroom updates — Modernizes spaces and increases appeal ↑
- Both landscaping and curb appeal — Enhances overall property value and appeal ↑
ⓘ Cost ranges are severity-bucket heuristics (US national rule-of-thumb). Get contractor quotes + a written scope before underwriting a rehab budget.
Schools (NCES district)
- District
- Flint School District
- NCES district ID
- 2614520
- Math proficiency
- 7% ▬ 0.00%
- Reading proficiency
- 13% ▲ 3.00%
- Median HH income
- $25,954
- Composite
- 10.97/100
- National rank
- #14642
- State rank
- #714 of 760 in MI
Livability — Flint
- Score
- 74/100
- State rank
- #196
- US rank
- #4946
Category grades
Schools grade is shown separately in the Schools card above.
Census & demographics
- Census place
- Flint, MI
- County
- Genesee County · 221,329 people
- City population
- 93,814
- Metro
- Flint, MI
- Population (ZIP)
- 28,723
- Household income
- $46,554
- Rent vs Own
- Severe rent burden
- 1534.0
Population outlook (Genesee County) Hauer SSP2
- Today (2025)
- 381,312 people
- By 2030
- 362,731 · -4.9%
- By 2040
- 321,550 · -15.7%
- By 2050
- 279,212 · -26.8%
- By 2075
- 193,336 · -49.3%
- By 2100
- 128,118 · -66.4%
Race, ethnicity, and origin ACS 2023
- Neighborhood character
- Diverse neighborhood (Simpson 0.57)
- Race & ethnicity
- White 59% Black 28% Two or more races 10% Hispanic / Latino 5%
- Common ancestry
- Lithuanian 4% Romanian 3% Slovak 2%
- Foreign-born
- 1% · Canada
- Languages at home
- 97% English-only · Spanish 1% Other Asian/Pacific 1%
Political lean MEDSL · Genesee
- 2024 margin
- Toss-up / Even · D 51.4% · R 47.2% · Other 1.4%
- 2008→2024 swing
- -28.3pp toward R · 2008: 32.5pp · 2024: 4.2pp
- All cycles
- 2024: D+4.2 2020: D+9.3 2016: D+9.5 2012: D+28.2 2008: D+32.5
Not yet ingested
- Civics
- —
Market trends
- HPI YoY
- ▼ -154.90%
- Current HPI
- 132.3632
- Rent YoY
- ▼ -1.04%
- Metro
- Flint, MI
- State GDP YoY
- ▲ 1.37%
- F500 in state
- 28
Industry mix (Fortune 500 HQ in MI)
| Industry | F500 HQs | Revenue |
|---|---|---|
| Automotive Parts | 3 | $48B |
|
||
| Automotive | 2 | $372B |
|
||
| Chemicals | 1 | $45B |
|
||
| Automotive Retail | 1 | $29B |
|
||
| Healthcare / Medical Devices | 1 | $23B |
|
||
| Automotive Technology | 1 | $20B |
|
||
Price history
-17.2% since first listed23 events — show timeline
- 2026-04-17 Listed $269,000 MiRealSource-MiMLS
- 2026-04-17 Listed $269,000 REALCOMP
- 2025-08-01 Listing Removed — REALCOMP
- 2025-08-01 Listing Removed — MiRealSource-MiMLS
- 2025-03-21 Listing Removed — MiRealSource-MiMLS
- 2025-03-21 Relisted — MiRealSource-MiMLS
- 2025-01-17 Listing Removed — MiRealSource-MiMLS
- 2025-01-16 Listed $349,000 MiRealSource-MiMLS
- 2025-01-16 Listed $349,000 REALCOMP
- 2025-01-16 Listed $349,000 MiRealSource-MiMLS
- 2024-07-20 Rental Removed $650 APPFOLIO
- 2024-04-10 Listed for Rent $650 APPFOLIO
- 2024-04-10 Rental Removed $650 APPFOLIO
- 2024-03-13 Listed for Rent $650 APPFOLIO
- 2023-09-09 Rental Removed — APPFOLIO
- 2023-03-10 Sold (MLS) $280,000 MiRealSource-MiMLS
- 2023-03-10 Sold (MLS) $280,000 REALCOMP
- 2023-02-22 Pending — MiRealSource-MiMLS
- 2023-02-22 Pending — REALCOMP
- 2023-02-05 Contingent — MiRealSource-MiMLS
- 2023-02-05 Contingent — REALCOMP
- 2023-01-16 Listed $325,000 MiRealSource-MiMLS
- 2023-01-16 Listed $325,000 REALCOMP
Cash-flow waterfall
monthlySold comps — $/sqft
last 12 mo · ≤1 miLoading sold comps…