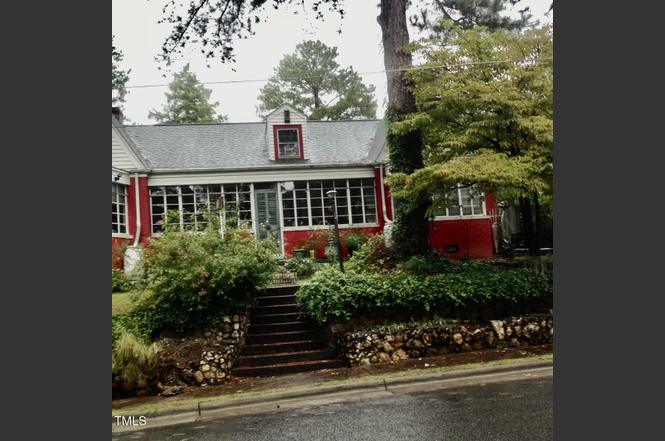
500 N Gulf St · Sanford, NC
Flood risk 1/10 · Minimal
- FEMA flood zone
- X (unshaded)
- Chance of flooding over 30 yrs
- 0.0%
- Est. flood insurance / yr
- $473 – $860
Fire risk 3/10 · Minor
- Est. fire insurance / yr
- $906 – $1,684
Heat risk 6/10 · Moderate
- Hot days now (above 105°F)
- 7 days/yr
- Hot days in 30 yrs
- 17 days/yr
Wind risk 6/10 · Moderate
- Chance of severe wind over 30 yrs
- 58.0%
Air-quality risk 2/10 · Minimal
- Unhealthy air days now
- 1 days/yr
- Unhealthy air days in 30 yrs
- 1 days/yr
Risk factors via First Street. Map © Google.
Why this score? — see what drove the B grade
The composite is a weighted blend of 9 inputs, each scored 0–100. Each bar is that input's sub-score; the figure is the points it added to the 100-point composite (weight × sub-score).
- Cash flow +30.0/30.0
- 1% rule +10.0/10.0
- DSCR +10.0/10.0
- ARV discount +7.5/15.0
- Rent growth +3.7/5.0
- Livability +3.6/5.0
- Schools +3.0/10.0
- Condition / age +2.5/5.0
- Appreciation +0.0/10.0
$70,000
🖨 Deal sheet (PDF) 📄 Offer letter ✓ Due diligence
Listing remarks
INVESTOR SPECIAL in Sanford's Historic District! Spacious 4BR/4 1/2BA home (3,306 sq ft) built in 1948 with historic charm, now needs full renovation. Fire damage on upper level & black mold present; property sold strictly AS-IS. Excellent flip, rebuild, or restoration opportunity in sought-after neighborhood near downtown Sanford. Cash or renovation loan accepted; seller to make no repairs. Priced well below market to reflect condition. Bring your contractor & vision to unlock its full potential!
Key facts
- Full renovation
- Historic district
- Downtown sanford
Tags
Neighborhood map
What this means for you Summary
Snapshot
- This is a 4-bed/3.0-bath single-family listed at $70k.
Deal economics
- At list price, monthly cash flow is $1k ($14k/yr) — positive.
- The deal already cash-flows at list — no discount required.
- Meets the 1% rule at list price ($2k rent vs $70k).
- Recommended offer: $69k (1.5% below list) — sets the bar for market timing.
- Cap rate 25.8% vs local median 3.6% in Sanford — top-decile yield for the area; either an underpriced asset or a hidden risk that comps aren't pricing in. Stress-test before assuming the spread holds.
Location & tenants
- Location reads 72/100 on livability (#92 in NC) — a middle-class / working-renter tenant base. Strengths: cost of living A+, housing A+, health & safety A+; Watch: employment D, crime D-, commute F.
- Lee County Schools (rural): math 31% / reading 39% proficiency, ranked #131 of 178 in NC (top 74%) — families likely to look elsewhere, expect single-tenant / working-renter base with shorter leases.
- Zoned schools: Tramway Elementary (math 45% / reading 47%, grade D-, #551 of 1,410 statewide, top 40%, 545 students, 47% FRL); West Lee Middle (math 25% / reading 39%, grade F, #317 of 475 statewide, top 68%, 607 students, 70% FRL); Southern Lee High School (math 43% / reading 46%, grade F, #352 of 535 statewide, top 68%, 1,234 students, 61% FRL) — zoned schools at 59% FRL track the district average.
- Market conditions: Rents rising fast (+4.7%/yr); 529 active listings in the ZIP; 602 units permitted in Lee County in 2024 (0 in 5+ unit buildings).
- This rent runs 43% of the median local income ($61k/yr) — at the standard rent-burdened threshold; future hikes will face affordability resistance.
Forward outlook
- Local home prices are declining (-3.0%/yr); year-one equity from $484 of loan paydown is wiped out by about $2k of value loss. Plan a longer hold.
- Lee County population projected at +8% by 2050 — modest demand growth; plan on rents tracking national, not racing it.
- At projected returns (-3.0% appreciation + 4.7% rent growth), your $20k cash investment doubles in ~2 years — after that, you're playing with house money.
Negotiation context
- It's been on market 15 days — a 2% lower offer ($69k) is reasonable based on typical stale-listing flexibility.
- 7 sale attempts; this cycle's ask has dropped $50k (42%) from the opening price — seller is motivated, your offer sets the floor, not the list.
Risks & watch-outs
- Watch-outs: property tax is 3.8% of price; built in 1948 — expect roof / HVAC / electrical / plumbing capex.
- Climate carrying-cost: major wind risk, 58% chance of damaging wind over 30y; extreme-heat days projected 7→17/yr by 2055 (HVAC capex compounding) — expect insurance premiums to compound above CPI over the hold.
Questions for the listing agent
- Built in 1948 — when were the roof, HVAC, electrical panel, plumbing, and water heater last replaced?
- Property tax is high relative to price — has the assessment been appealed recently, and will the sale trigger a re-assessment?
- Is there a deadline driving the sale (1031 exchange, divorce, estate, relocation)? That informs how much negotiation room exists.
- Schools are F-rated, which usually means shorter tenancies and higher turnover. Who's the typical renter profile here, and what's been the actual vacancy rate?
- Crime grade is D in this area — have there been break-ins, vandalism, or insurance claims at this property in the last 3 years? What carrier currently insures it and at what premium?
- What's the average days-on-market for RENTAL listings here right now (not sales)? A rising rental-DOM trend means longer vacancies and softer asking-rent achievability than the comps imply.
- What's the recent tenant-quality profile in this submarket — average credit score on applications, eviction rate, late-payment / NSF rate, and stable-employment percentage? A property-management company in the area should have these aggregated.
- How much new for-sale + rental construction is in the pipeline within 1–3 miles? Heavy new supply typically softens prices + rents 12–24 months out; constrained supply supports both.
Investment metrics
- 1% rule
- 3.17% ✓
- Cap rate
- 25.78%
- Cash-on-cash
- 69.59%
- DSCR
- 4.10
- GRM
- 2.6
CMA / ARV
- ARV (on-the-fly)
- $469,452
- Comps found
- 5
Show comp detail 5 sales within ~0.75 mi
| Address | Dist | Beds/Ba | Sqft | Sold | Price | $/sf | Match |
|---|---|---|---|---|---|---|---|
| 619 Spring Ln | 0.15mi | 3/3.0 (-1) | 3,294 (-0%) | 17mo | $410,000 | $124 | 73 |
| 505 Cross St | 0.19mi | 5/3.5 (+1) | 3,072 (-7%) | 0mo | $375,000 | $122 | 72 |
| 615 Spring Ln | 0.12mi | 3/2.5 (-1) | 3,285 (-1%) | 19mo | $569,900 | $173 | 70 |
| 133 Pisgah St | 0.28mi | 4/2.5 | 2,824 (-15%) | 11mo | $400,000 | $142 | 51 |
| 210 Pisgah St | 0.74mi | 4/2.5 | 2,824 (-15%) | 1mo | $399,990 | $142 | 38 |
Match score weights: distance 35% · size 25% · config 20% · recency 20%. Top-matched comps best support the ARV.
Projected returns pro-forma
-3.0% appreciation · 4.66% rent growth · sell at horizon
- IRR
- 71.2%
- Equity multiple
- 4.31×
- Total profit
- $64,938
- Equity at exit
- $10,437
- IRR
- 75.7%
- Equity multiple
- 9.48×
- Total profit
- $166,243
- Equity at exit
- $6,052
Cash invested: $19,600 (down + closing). Projections, not guarantees.
Landlord ↔ Tenant lean methodology
- Overall (STATE)
- 85 Strongly Landlord-Friendly
- State North Carolina
- 85 Strongly Landlord-Friendly · R+3
- County
- — inherits STATE
- City
- — inherits STATE
ZIP-level market 27330
- Home prices YoY
- -19.4%
- Rents YoY
- 4.7%
- Active inventory
- 529
- Price-to-rent
- 2.6×
Monthly cashflow live
- Estimated rent
- $2,221 medium interval (Pro) →
- Mortgage (P&I)
- −$367
- Tax from tax record
- −$221 /mo · $2,657/yr
- Insurance
- −$29
- HOA
- −$0
- Lot rent
- −$0
- Vacancy / Maint / Mgmt
- −$466
- Net cashflow
- $1,137
Break-even live
Sensitivity live
| Price | -10% $1,176 | -5% $1,156 | +0% $1,137 | +5% $1,117 | +10% $1,097 |
|---|---|---|---|---|---|
| Rent | -10% $961 | -5% $1,049 | +0% $1,137 | +5% $1,224 | +10% $1,312 |
| Rate | -1.0pp $1,172 | -0.5pp $1,154 | base $1,137 | +0.5pp $1,119 | +1.0pp $1,100 |
UW: 25.0% down · 7.5% · 30yr · 1.5% tax · 5.0% vac · 8.0% maint · 8.0% mgmt
Financing live
Cash to close
- Down payment
- $17,500
- Closing costs
- $2,100
- Reserves months
- —
- Total cash needed
- —
Loan-product check · same deal, 3 products live
Conventional
25% down · 7.5% · 30yr
- Down + closing
- —
- Monthly P&I
- —
- Monthly cashflow
- —
- DSCR
- —
- Eligible?
- —
Personal DTI + credit; lowest rate.
DSCR
20% down · 8.5% · 30yr
- Down + closing
- —
- Monthly P&I
- —
- Monthly cashflow
- —
- DSCR
- —
- Eligible?
- —
No personal income docs; deal must DSCR.
Hard money
10% down · 12.0% · 12mo
- Down + closing
- —
- Monthly P&I
- —
- Monthly cashflow
- —
- DSCR
- —
- Eligible?
- —
Short-term bridge; refi at stabilization.
Listing history 18 events
-
2026-02-01status Pending
-
2026-01-27price $70,000
-
2026-01-27status Active
-
2026-01-01status Pending
-
2025-12-22$120,000 Active
-
2025-12-22historical
-
2025-12-20$70,000 Active
-
2025-11-22status Active
-
2025-10-29status Pending
-
2025-10-29historical
-
2025-10-12status Active
-
2025-09-13status Pending
-
2025-08-31price $150,000
-
2025-08-29status Active
-
2025-08-25status Pending
-
2025-07-14$185,000 Active
-
2025-07-14historical
-
1999-06-10soldstatus $105,000
ⓘ Source: listings_history table (triggers on properties + properties_extension) + one-shot
backfill from property_details.listing_events for pre-trigger history.
Tax reassessment forecast NC · Resets to sale price
- Current annual tax
- $2,657 · $221/mo
- Projected year-2 tax
- $2,657 · $221/mo
- Expected delta
- $0/yr ($0/mo · 0.0%)
ⓘ Screening estimate from a state-policy table — verify with the county assessor before closing.
Climate risk First Street
- Flood 1/10 Low FEMA zone X (unshaded) · 0% chance over 30 yrs
- Wildfire 3/10 Moderate
- Heat 6/10 Major 7 d/yr ≥105°F today · 17 d/yr by 30 yrs out
- Wind 6/10 Major 58% chance of damaging wind over 30 yrs
- Air quality 2/10 Low 1 unhealthy d/yr today · 1 by 30 yrs out
Nearby sold comps map
Loading sold comps map…
Walkable amenities ~0.75 mi
Loading nearby amenities…
Taxation est. · year 1
- Rental income
- $26,648
- − Mortgage interest
- −$3,921
- − Property taxes
- −$2,657
- − Insurance
- −$350
- − Repairs & maintenance
- −$2,132
- − Management
- −$2,132
- − Depreciation
- −$2,036
- Taxable income
- $13,420
- Est. tax owed @ 24.0%
- −$3,221
- After-tax cash flow
- $10,419/yr
For passive investors: Depreciation is non-cash, so a rental often shows a tax loss while cash-flowing — sheltering income. Rental losses are passive: they offset passive income freely, and up to $25,000/yr can offset ordinary (W-2) income if you actively participate and your MAGI is under $100k (phasing out to $0 by $150k); unused losses carry forward. On sale, claimed depreciation is recaptured at up to 25%, and gains may owe capital-gains tax (a 1031 exchange can defer both). Figures are a year-1 estimate at your 24.0% rate — not tax advice; consult a CPA.
Schools (NCES district)
- District
- Lee County Schools
- NCES district ID
- 3702560
- Math proficiency
- 31% ▼ -6.00%
- Reading proficiency
- 39% ▬ 0.00%
- Median HH income
- $45,300
- Composite
- 29.87/100
- National rank
- #6403
- State rank
- #131 of 178 in NC
Livability — Sanford
- Score
- 72/100
- State rank
- #92
- US rank
- #6134
Category grades
Schools grade is shown separately in the Schools card above.
Census & demographics
- Census place
- Sanford, NC
- County
- Lee County · 76,725 people
- City population
- 76,725
- Metro
- Sanford, NC
- Population (ZIP)
- 39,778
- Household income
- $61,300
- Rent vs Own
- Severe rent burden
- 928.0
Population outlook (Lee County) Hauer SSP2
- Today (2025)
- 63,008 people
- By 2030
- 64,443 · +2.3%
- By 2040
- 66,898 · +6.2%
- By 2050
- 68,310 · +8.4%
- By 2075
- 70,920 · +12.6%
- By 2100
- 70,402 · +11.7%
Race, ethnicity, and origin ACS 2023
- Neighborhood character
- Diverse neighborhood (Simpson 0.63)
- Race & ethnicity
- White 54% Hispanic / Latino 21% Black 19% Two or more races 10% Asian 1%
- Hispanic origin (detail)
- Mexican 12% Puerto Rican 2%
- Common ancestry
- Slovak 4% Serbian 2% Italian 1%
- Foreign-born
- 10% · Canada
- Languages at home
- 81% English-only · Spanish 17%
Political lean MEDSL · Lee
- 2024 margin
- R (+17.5) · D 40.8% · R 58.3%
- 2008→2024 swing
- -9.1pp toward R · 2008: -8.4pp · 2024: -17.5pp
- All cycles
- 2024: R+17.5 2020: R+14.9 2016: R+13.2 2012: R+10.2 2008: R+8.4
Not yet ingested
- Civics
- —
Market trends
- HPI YoY
- ▼ -72.62%
- Current HPI
- 302.3589
- Rent YoY
- ▲ 4.66%
- Metro
- Sanford, NC
- State GDP YoY
- ▲ 3.28%
- F500 in state
- 26
Industry mix (Fortune 500 HQ in NC)
| Industry | F500 HQs | Revenue |
|---|---|---|
| Financial Services | 2 | $213B |
|
||
| Retail | 2 | $95B |
|
||
| Industrial Conglomerate | 1 | $38B |
|
||
| Metals / Steel | 1 | $35B |
|
||
| Utilities | 1 | $30B |
|
||
| Industrial Machinery | 1 | $19B |
|
||
Price history
-33.3% since first listed18 events — show timeline
- 2026-02-01 Pending — TMLS
- 2026-01-27 Price Changed $70,000 TMLS
- 2026-01-27 Relisted — TMLS
- 2026-01-01 Pending — TMLS
- 2025-12-22 Listing Removed — TMLS
- 2025-12-22 Listed $120,000 TMLS
- 2025-12-20 Listed $70,000 TMLS
- 2025-11-22 Relisted — TMLS
- 2025-10-29 Pending — TMLS
- 2025-10-29 Listing Removed — TMLS
- 2025-10-12 Relisted — TMLS
- 2025-09-13 Pending — TMLS
- 2025-08-31 Price Changed $150,000 TMLS
- 2025-08-29 Relisted — TMLS
- 2025-08-25 Pending — TMLS
- 2025-07-14 Listed $185,000 TMLS
- 2025-07-14 Coming Soon — TMLS
- 1999-06-10 Sold (Public Records) $105,000 Public Records
Property tax history
+3.0%/yrLatest (2025): $2,657 · +0.8% YoY. Source: county tax records.
Cash-flow waterfall
monthlySold comps — $/sqft
last 12 mo · ≤1 miLoading sold comps…