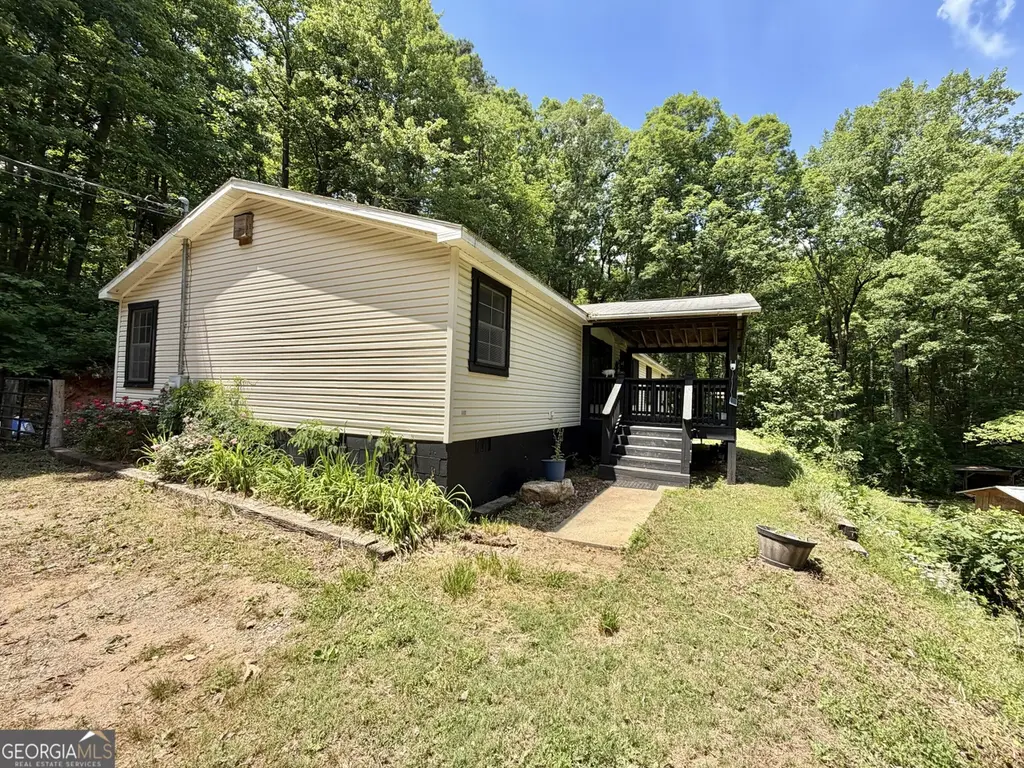
325 Fern Valley Trl · Clarkesville, GA
Flood risk 1/10 · Minimal
- FEMA flood zone
- X (unshaded)
- Chance of flooding over 30 yrs
- 0.0%
- Est. flood insurance / yr
- $507 – $1,088
Fire risk 4/10 · Minor
- Est. fire insurance / yr
- $963 – $1,789
Heat risk 4/10 · Minor
- Hot days now (above 100°F)
- 7 days/yr
- Hot days in 30 yrs
- 18 days/yr
Wind risk 2/10 · Minimal
- Chance of severe wind over 30 yrs
- —
Air-quality risk 4/10 · Minor
- Unhealthy air days now
- 4 days/yr
- Unhealthy air days in 30 yrs
- 6 days/yr
Risk factors via First Street. Map © Google.
Why this score? — see what drove the D- grade
The composite is a weighted blend of 9 inputs, each scored 0–100. Each bar is that input's sub-score; the figure is the points it added to the 100-point composite (weight × sub-score).
- Cash flow +9.0/30.0
- ARV discount +7.5/15.0
- Appreciation +5.8/10.0
- Livability +3.6/5.0
- Schools +3.2/10.0
- DSCR +2.5/10.0
- Rent growth +2.5/5.0
- Condition / age +2.5/5.0
- 1% rule +1.5/10.0
$250,000
🖨 Deal sheet (PDF) 📄 Offer letter ✓ Due diligence
Listing remarks
Nestled on nearly 2 peaceful acres in the north end of Habersham, this spacious 4 bedroom, 2 bath home offers endless possibilities indoors and out. Inside you'll find plenty of room to spread out with a large living room, separate den area, dining room, spacious kitchen and laundry room. Outside, the property really shines, featuring mature muscadine vines, a green house, garden spot, multiple outbuildings for storage or hobbies plus a small creek! This property is a great opportunity to have a working homestead or just a quiet place to enjoy the outdoors. * Additional acreage available to purchase as well *
Key facts
- Green house
- Garden spot
- Small creek
Tags
Property features AI
Finance
- HOA & community: No HOA
Exterior
- Parking: No designated parking listed
- Utilities: Well water; Septic tank sewer; Phone service available
- Home design: Manufactured single-family residence; One level; Resale property
- Construction: Built in 2001; Vinyl siding; Composition roof; Manufactured house structure
- Exterior features: Lot just under 2 acres; Lot features described as Other
Interior
- Kitchen: No built-in appliances listed
- Bedrooms: 4 bedrooms (all on the main level)
- Flooring: Vinyl flooring; Other flooring types
- Bathrooms: 2 full bathrooms (main level)
- Heating & cooling: Electric central heating; Central electric air conditioning
- Interior features: Den; Mud room; Crawl space basement; Two fireplaces
- Laundry & utility: Laundry area in mud room
Neighborhood map
What this means for you Summary
Snapshot
- This is a 3-bed/2.0-bath single-family listed at $250k.
Deal economics
- At list price, monthly cash flow is $-196 ($-2k/yr) — negative.
- To cash-flow at today's rent, offer at most $215k (13.9% below list).
- To meet the 1% rule (rent ≥ 1% of price), the offer needs to be $163k (34.7% below list).
- Recommended offer: $163k (34.7% below list) — sets the bar for 1% rule.
- Cap rate 5.3% vs local median 1.7% in Clarkesville — top-decile yield for the area; either an underpriced asset or a hidden risk that comps aren't pricing in. Stress-test before assuming the spread holds.
Location & tenants
- Location reads 72/100 on livability (#66 in GA) — a middle-class / working-renter tenant base. Strengths: crime A+, cost of living A+, housing A+; Watch: amenities F, commute F, health & safety D-.
- Habersham County (rural): math 38% / reading 39% proficiency, ranked #53 of 174 in GA (top 30%) — families likely to look elsewhere, expect single-tenant / working-renter base with shorter leases.
- Zoned schools: Clarkesville Elementary School (math 47% / reading 47%, grade D-, #301 of 1,228 statewide, top 25%, 442 students, 55% FRL); North Habersham Middle School (math 35% / reading 48%, grade F, #132 of 470 statewide, top 28%, 557 students, 46% FRL); Habersham Central High School (math 8% / reading 38%, grade F, #209 of 424 statewide, top 49%, 1,525 students, 47% FRL) — zoned schools at 49% FRL track the district average.
- Market conditions: 291 active listings in the ZIP; 215 units permitted in Habersham County in 2024 (5 in 5+ unit buildings).
Forward outlook
- In year one you build about $6k of equity ($2k loan paydown + $4k appreciation (1.6% local appreciation)).
- Habersham County population projected at +8% by 2050 — modest demand growth; plan on rents tracking national, not racing it.
- By year 6, paydown + projected appreciation supports a ~$31k cash-out refi (75% LTV) — recoverable capital for the next deal without selling this one.
Negotiation context
- It's been on market 30 days — a 2% lower offer ($246k) is reasonable based on typical stale-listing flexibility.
- Current owner paid $75k; list at $250k implies a 234% gain — meaningful room to come down on a strong offer.
Questions for the listing agent
- What do current leases actually rent for vs. the listed asking? Can we see a recent rent roll and the last 12 months of T-12 income?
- Is there a deadline driving the sale (1031 exchange, divorce, estate, relocation)? That informs how much negotiation room exists.
- The area grade is low — what's the realistic commute time and amenity access for the typical tenant pool here? Any planned neighborhood developments (good or bad) we should know about?
- What's the average days-on-market for RENTAL listings here right now (not sales)? A rising rental-DOM trend means longer vacancies and softer asking-rent achievability than the comps imply.
- What's the recent tenant-quality profile in this submarket — average credit score on applications, eviction rate, late-payment / NSF rate, and stable-employment percentage? A property-management company in the area should have these aggregated.
- How much new for-sale + rental construction is in the pipeline within 1–3 miles? Heavy new supply typically softens prices + rents 12–24 months out; constrained supply supports both.
Investment metrics
- 1% rule
- 0.65% ✗
- Cap rate
- 5.35%
- Cash-on-cash
- -3.37%
- DSCR
- 0.85
- GRM
- 12.8
CMA / ARV
No comps found within radius.
Projected returns pro-forma
1.56% appreciation · 3.0% rent growth · sell at horizon
- IRR
- -0.3%
- Equity multiple
- 0.99×
- Total profit
- $-1,008
- Equity at exit
- $92,745
- IRR
- 4.2%
- Equity multiple
- 1.55×
- Total profit
- $38,222
- Equity at exit
- $129,189
Cash invested: $70,000 (down + closing). Projections, not guarantees.
Landlord ↔ Tenant lean methodology
- Overall (STATE)
- 90 Strongly Landlord-Friendly
- State Georgia
- 90 Strongly Landlord-Friendly · R+3
- County
- — inherits STATE
- City
- — inherits STATE
ZIP-level market 30523
- Home prices YoY
- 0.5%
- Active inventory
- 291
- Price-to-rent
- 12.8×
Monthly cashflow live
- Estimated rent
- $1,632 medium interval (Pro) →
- Mortgage (P&I)
- −$1,311
- Tax from tax record
- −$71 /mo · $850/yr
- Insurance
- −$104
- HOA
- −$0
- Vacancy / Maint / Mgmt
- −$343
- Net cashflow
- $-196
Break-even live
Sensitivity live
| Price | -10% $-55 | -5% $-126 | +0% $-196 | +5% $-267 | +10% $-338 |
|---|---|---|---|---|---|
| Rent | -10% $-325 | -5% $-261 | +0% $-196 | +5% $-132 | +10% $-68 |
| Rate | -1.0pp $-71 | -0.5pp $-133 | base $-196 | +0.5pp $-261 | +1.0pp $-327 |
UW: 25.0% down · 7.5% · 30yr · 1.5% tax · 5.0% vac · 8.0% maint · 8.0% mgmt
Financing live
Cash to close
- Down payment
- $62,500
- Closing costs
- $7,500
- Reserves months
- —
- Total cash needed
- —
Loan-product check · same deal, 3 products live
Conventional
25% down · 7.5% · 30yr
- Down + closing
- —
- Monthly P&I
- —
- Monthly cashflow
- —
- DSCR
- —
- Eligible?
- —
Personal DTI + credit; lowest rate.
DSCR
20% down · 8.5% · 30yr
- Down + closing
- —
- Monthly P&I
- —
- Monthly cashflow
- —
- DSCR
- —
- Eligible?
- —
No personal income docs; deal must DSCR.
Hard money
10% down · 12.0% · 12mo
- Down + closing
- —
- Monthly P&I
- —
- Monthly cashflow
- —
- DSCR
- —
- Eligible?
- —
Short-term bridge; refi at stabilization.
Listing history 20 events
-
2026-06-21days on market $250,000 Active 30 DOM
-
2026-06-19days on market $250,000 Active 28 DOM
-
2026-06-18days on market $250,000 Active 27 DOM
-
2026-06-17days on market $250,000 Active 26 DOM
-
2026-06-16days on market $250,000 Active 25 DOM
-
2026-06-15days on market $250,000 Active 24 DOM
-
2026-06-14days on market $250,000 Active 22 DOM
-
2026-06-12days on market $250,000 Active 21 DOM
-
2026-06-09days on market $250,000 Active 18 DOM
-
2026-06-08days on market $250,000 Active 17 DOM
-
2026-06-07days on market $250,000 Active 16 DOM
-
2026-06-07statusdays on market $250,000 Active 15 DOM
-
2026-06-02days on market $250,000 New 11 DOM
-
2026-06-01days on market $250,000 New 10 DOM
-
2026-05-31days on market $250,000 New 9 DOM
-
2026-05-31days on market $250,000 New 8 DOM
-
2026-05-15$250,000 New
-
2005-01-05soldstatus $74,900
-
2003-05-01soldstatus $1,000
-
2002-08-01soldstatus $9,800
ⓘ Source: listings_history table (triggers on properties + properties_extension) + one-shot
backfill from property_details.listing_events for pre-trigger history.
Tax reassessment forecast GA · Resets to sale price
- Current annual tax
- $850 · $71/mo
- Projected year-2 tax
- $2,300 · $192/mo
- Expected delta
- +$1,450/yr (+$121/mo · 170.6%)
ⓘ Screening estimate from a state-policy table — verify with the county assessor before closing.
Climate risk First Street
- Flood 1/10 Low FEMA zone X (unshaded) · 0% chance over 30 yrs
- Wildfire 4/10 Moderate
- Heat 4/10 Moderate 7 d/yr ≥100°F today · 18 d/yr by 30 yrs out
- Wind 2/10 Low
- Air quality 4/10 Moderate 4 unhealthy d/yr today · 6 by 30 yrs out
Nearby sold comps map
Loading sold comps map…
Walkable amenities ~0.75 mi
Loading nearby amenities…
Taxation est. · year 1
- Rental income
- $19,588
- − Mortgage interest
- −$14,004
- − Property taxes
- −$850
- − Insurance
- −$1,250
- − Repairs & maintenance
- −$1,567
- − Management
- −$1,567
- − Depreciation
- −$7,273
- Taxable loss
- −$6,923
- Est. tax savings @ 24.0%
- +$1,661
- After-tax cash flow
- $-696/yr
For passive investors: Depreciation is non-cash, so a rental often shows a tax loss while cash-flowing — sheltering income. Rental losses are passive: they offset passive income freely, and up to $25,000/yr can offset ordinary (W-2) income if you actively participate and your MAGI is under $100k (phasing out to $0 by $150k); unused losses carry forward. On sale, claimed depreciation is recaptured at up to 25%, and gains may owe capital-gains tax (a 1031 exchange can defer both). Figures are a year-1 estimate at your 24.0% rate — not tax advice; consult a CPA.
Schools (NCES district)
- District
- Habersham County
- NCES district ID
- 1302580
- Math proficiency
- 38% ▼ -16.00%
- Reading proficiency
- 39% ▼ -8.00%
- Median HH income
- $41,838
- Composite
- 32.48/100
- National rank
- #5709
- State rank
- #53 of 174 in GA
Livability — Clarkesville
- Score
- 72/100
- State rank
- #66
- US rank
- #6195
Category grades
Schools grade is shown separately in the Schools card above.
Census & demographics
- Population (ZIP)
- 13,777
Population outlook (Habersham County) Hauer SSP2
- Today (2025)
- 45,697 people
- By 2030
- 46,571 · +1.9%
- By 2040
- 48,157 · +5.4%
- By 2050
- 49,492 · +8.3%
- By 2075
- 52,546 · +15.0%
- By 2100
- 52,752 · +15.4%
Race, ethnicity, and origin ACS 2023
- Neighborhood character
- Predominantly White (88%)
- Race & ethnicity
- White 88% Hispanic / Latino 6% Two or more races 4% Black 2% Asian 2%
- Hispanic origin (detail)
- Mexican 5%
- Common ancestry
- Slovak 2% Italian 2% Serbian 1%
- Foreign-born
- 5% · Canada, Jamaica, Vietnam
- Languages at home
- 93% English-only · Spanish 5% Other Asian/Pacific 1% Tagalog/Filipino 1%
Political lean MEDSL · Habersham
- 2024 margin
- Solid R (+64.9) · D 17.3% · R 82.2%
- 2008→2024 swing
- -5.0pp toward R · 2008: -59.9pp · 2024: -64.9pp
- All cycles
- 2024: R+64.9 2020: R+64.0 2016: R+66.3 2012: R+67.5 2008: R+59.9
Not yet ingested
- Civics
- —
Market trends
- HPI YoY
- ▲ 1.56%
- Current HPI
- 346.7256
- Rent YoY
- —
- Metro
- —
- State GDP YoY
- ▲ 2.66%
- F500 in state
- 28
Industry mix (Fortune 500 HQ in GA)
| Industry | F500 HQs | Revenue |
|---|---|---|
| Paper / Packaging | 2 | $29B |
|
||
| Retail | 1 | $160B |
|
||
| Transportation / Logistics | 1 | $91B |
|
||
| Airlines | 1 | $62B |
|
||
| Consumer Goods | 1 | $47B |
|
||
| Utilities | 1 | $25B |
|
||
Price history
+2451.0% since first listed4 events — show timeline
- 2026-05-15 Listed $250,000 GAMLS
- 2005-01-05 Sold (Public Records) $74,900 Public Records
- 2003-05-01 Sold (Public Records) $1,000 Public Records
- 2002-08-01 Sold (Public Records) $9,800 Public Records
Property tax history
+5.8%/yrLatest (2025): $850 · +21.6% YoY. Source: county tax records.
Cash-flow waterfall
monthlySold comps — $/sqft
last 12 mo · ≤1 miLoading sold comps…