 6-Plex
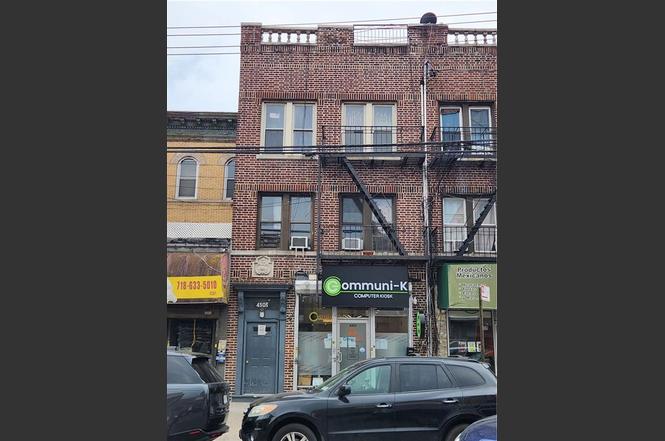
4303 12th Ave · New York, NY
Flood risk No data
- FEMA flood zone
- —
- Chance of flooding over 30 yrs
- —
- Est. flood insurance / yr
- —
Fire risk No data
- Est. fire insurance / yr
- —
Heat risk No data
- Hot days now (above threshold)
- —
- Hot days in 30 yrs
- —
Wind risk No data
- Chance of severe wind over 30 yrs
- —
Air-quality risk No data
- Unhealthy air days now
- —
- Unhealthy air days in 30 yrs
- —
Risk factors via First Street. Map © Google.
Why this score? — see what drove the D grade
The composite is a weighted blend of 9 inputs, each scored 0–100. Each bar is that input's sub-score; the figure is the points it added to the 100-point composite (weight × sub-score).
- Appreciation +10.0/10.0
- Cash flow +7.9/30.0
- ARV discount +7.5/15.0
- Schools +5.0/10.0
- Livability +3.8/5.0
- Rent growth +2.5/5.0
- Condition / age +2.5/5.0
- 1% rule +2.4/10.0
- DSCR +1.9/10.0
$2,199,999
🖨 Deal sheet (PDF) 📄 Offer letter ✓ Due diligence
Multi-family units
County records classify this as Multi-Family (2-4 Unit). Listing-text estimate: 6 units. estimate disagrees with records
Listing remarks
Solid brick mix used building located in the heart of Borough Park. 6-unit building consists of 1 store and 5 apartments, Lot is 20x100 building is 20x75, R6 zoning, currently occupied month by month with no leases. full basement windows in every room gross income approximately 95,000. please call for more information.
Key facts
- 2,000 sq ft lot
- Built 1930
- Listed 10 days
Property features AI
Finance
- Other: Six-unit building (one retail unit and five residential units); Retail unit on 1st floor currently month-to-month; All residential units currently month-to-month
- Financial info: Reported rent income: 95,000; Financing options considered: exchange, bank mortgage, cash
- HOA & community: No HOA information provided
Exterior
- Parking: No on-site parking
- Security: No security details provided
- Utilities: Electric service with circuit breakers; Gas for heating and hot water
- Home design: Attached building; Flat roof; Building footprint approximately 1,500 (dimensions 75.00 x 20.00); Zoning: R6
- Construction: Brick exterior; Poured concrete foundation
- Exterior features: Back yard; Mixed-use property
Interior
- Kitchen: No kitchen/appliance details provided
- Bedrooms: Five residential units with two bedrooms each (units on floors 1–3)
- Flooring: Other flooring (see remarks)
- Bathrooms: Each residential unit has one full bath
- Heating & cooling: Steam/radiator heat; Hot water heated by gas
- Interior features: Cellar; Ceiling height varies; Other flooring (see remarks); Other walls (see remarks)
- Laundry & utility: No laundry details provided
Neighborhood map
What this means for you Summary
Snapshot
- This is a 6 × 10-bed/5.0-bath units multifamily listed at $2.20M.
Deal economics
- At list price, monthly cash flow is $-2k ($-29k/yr) — negative. Per door: $-396/mo.
- To cash-flow at today's rent, offer at most $1.86M (15.6% below list).
- To meet the 1% rule (rent ≥ 1% of price), the offer needs to be $1.62M (26.2% below list).
- Recommended offer: $1.62M (26.2% below list) — sets the bar for 1% rule.
- Cap rate 5.0% vs local median 2.6% in New York — top-decile yield for the area; either an underpriced asset or a hidden risk that comps aren't pricing in. Stress-test before assuming the spread holds.
Location & tenants
- Location reads 75/100 on livability (#268 in NY, #4,188 nationally) — a middle-class / working-renter tenant base. Strengths: amenities A+, commute A+, health & safety A; Watch: crime F, cost of living F.
- Zoned schools: Elm Tree Elementary School (math 27% / reading 52%, grade F, #1,444 of 2,108 statewide, top 71%, 806 students, 94% FRL); Ms 51 William Alexander (math 67% / reading 92%, grade A+, #32 of 729 statewide, top 5%, 1,026 students, 61% FRL); Midwood High School (math 94% / reading 96%, grade A+, #83 of 1,100 statewide, top 8%, 4,062 students, 73% FRL).
- Market conditions: 123 active listings in the ZIP; 10,063 units permitted in Kings County in 2024 (9,789 in 5+ unit buildings).
- At $16,236/mo this rent would consume 334% of the median local household income ($58k/yr) (locally 6849% of renters already pay >50% of income on rent) — very limited rent-growth headroom before tenants either downsize or default.
Forward outlook
- In year one you build about $235k of equity ($15k loan paydown + $220k appreciation (10.0% local appreciation)).
- Kings County population projected at +13% by 2050 — modest demand growth; plan on rents tracking national, not racing it.
- By year 2, paydown + projected appreciation supports a ~$378k cash-out refi (75% LTV) — recoverable capital for the next deal without selling this one.
Negotiation context
- Only 10 days on market — expect competitive offers; lowballing is unlikely to land.
Risks & watch-outs
- Watch-outs: built in 1930 — expect roof / HVAC / electrical / plumbing capex.
Questions for the listing agent
- What do current leases actually rent for vs. the listed asking? Can we see a recent rent roll and the last 12 months of T-12 income?
- Can we see the unit-by-unit rent roll, current vacancy, and any below-market leases? What's the average tenancy length?
- What capital expenditures (roof, boiler, parking lot, exteriors) have been made in the last 5 years, and what's planned in the next 2?
- Built in 1930 — when were the roof, HVAC, electrical panel, plumbing, and water heater last replaced?
- Is there a deadline driving the sale (1031 exchange, divorce, estate, relocation)? That informs how much negotiation room exists.
- Schools are B-rated — typically a magnet for longer-tenancy family renters. What's the average tenant stay here, and is there a school-zone premium baked into asking?
- Crime grade is F in this area — have there been break-ins, vandalism, or insurance claims at this property in the last 3 years? What carrier currently insures it and at what premium?
- The area grade is low — what's the realistic commute time and amenity access for the typical tenant pool here? Any planned neighborhood developments (good or bad) we should know about?
- What's the average days-on-market for RENTAL listings here right now (not sales)? A rising rental-DOM trend means longer vacancies and softer asking-rent achievability than the comps imply.
- What's the recent tenant-quality profile in this submarket — average credit score on applications, eviction rate, late-payment / NSF rate, and stable-employment percentage? A property-management company in the area should have these aggregated.
- How much new apartment / multifamily construction is in the pipeline within 1–3 miles? Heavy new supply (>2% of stock underway) typically softens rents 12–24 months out; light construction supports rent growth.
Investment metrics
- 1% rule
- 0.74% ✗
- Cap rate
- 5.00%
- Cash-on-cash
- -4.63%
- DSCR
- 0.79
- GRM
- 11.3
CMA / ARV
No comps found within radius.
Projected returns pro-forma
10.0% appreciation · 3.0% rent growth · sell at horizon
- IRR
- 21.0%
- Equity multiple
- 2.70×
- Total profit
- $1,047,014
- Equity at exit
- $1,981,933
- IRR
- 19.0%
- Equity multiple
- 6.20×
- Total profit
- $3,202,837
- Equity at exit
- $4,274,114
Cash invested: $616,000 (down + closing). Projections, not guarantees.
Landlord ↔ Tenant lean methodology
- Overall (CITY)
- 0 Strongly Tenant-Friendly
- State New York
- 15 Strongly Tenant-Friendly · D+10
- County
- — inherits STATE
- City New York
- 0 Strongly Tenant-Friendly · D+34
ZIP-level market 11219
- Home prices YoY
- 4.9%
- Active inventory
- 123
- Price-to-rent
- 67.8×
Monthly cashflow live
- Estimated rent
- $16,236 medium interval (Pro) →
- Mortgage (P&I)
- −$11,537
- Tax est. 1.5%
- −$2,750 /mo · $33,000/yr
- Insurance
- −$917
- HOA
- −$0
- Vacancy / Maint / Mgmt
- −$3,410
- Net cashflow
- $-2,377
Break-even live
Sensitivity live
| Price | -10% $-857 | -5% $-1,617 | +0% $-2,377 | +5% $-3,137 | +10% $-3,898 |
|---|---|---|---|---|---|
| Rent | -10% $-3,660 | -5% $-3,019 | +0% $-2,377 | +5% $-1,736 | +10% $-1,095 |
| Rate | -1.0pp $-1,269 | -0.5pp $-1,818 | base $-2,377 | +0.5pp $-2,947 | +1.0pp $-3,527 |
6-unit breakdown (identical units grouped — click to expand)
| Units | Beds | Baths | Est. rent |
|---|---|---|---|
| 6× units | 10 | 5 | $16,236 |
| #1 | 10 | 5 | $2,706 |
| #2 | 10 | 5 | $2,706 |
| #3 | 10 | 5 | $2,706 |
| #4 | 10 | 5 | $2,706 |
| #5 | 10 | 5 | $2,706 |
| #6 | 10 | 5 | $2,706 |
| Total (6 units) | $16,236 | ||
UW: 25.0% down · 7.5% · 30yr · 1.5% tax · 5.0% vac · 8.0% maint · 8.0% mgmt
Financing live
Cash to close
- Down payment
- $550,000
- Closing costs
- $66,000
- Reserves months
- —
- Total cash needed
- —
Loan-product check · same deal, 3 products live
Conventional
25% down · 7.5% · 30yr
- Down + closing
- —
- Monthly P&I
- —
- Monthly cashflow
- —
- DSCR
- —
- Eligible?
- —
Personal DTI + credit; lowest rate.
DSCR
20% down · 8.5% · 30yr
- Down + closing
- —
- Monthly P&I
- —
- Monthly cashflow
- —
- DSCR
- —
- Eligible?
- —
No personal income docs; deal must DSCR.
Hard money
10% down · 12.0% · 12mo
- Down + closing
- —
- Monthly P&I
- —
- Monthly cashflow
- —
- DSCR
- —
- Eligible?
- —
Short-term bridge; refi at stabilization.
Listing history 7 events
-
2026-06-21days on market $2,199,999 Active 10 DOM
-
2026-06-18days on market $2,199,999 Active 7 DOM
-
2026-06-17days on market $2,199,999 Active 6 DOM
-
2026-06-16days on market $2,199,999 Active 5 DOM
-
2026-06-15days on market $2,199,999 Active 4 DOM
-
2026-06-13remarks 320-char remark
-
2026-06-13$2,199,999 Active 2 DOM
ⓘ Source: listings_history table (triggers on properties + properties_extension) + one-shot
backfill from property_details.listing_events for pre-trigger history.
Nearby sold comps map
Loading sold comps map…
Walkable amenities ~0.75 mi
Loading nearby amenities…
Taxation est. · year 1
- Rental income
- $194,832
- − Mortgage interest
- −$123,234
- − Property taxes
- −$33,000
- − Insurance
- −$11,000
- − Repairs & maintenance
- −$15,587
- − Management
- −$15,587
- − Depreciation
- −$64,000
- Taxable loss
- −$67,575
- Est. tax savings @ 24.0%
- +$16,218
- After-tax cash flow
- $-12,309/yr
For passive investors: Depreciation is non-cash, so a rental often shows a tax loss while cash-flowing — sheltering income. Rental losses are passive: they offset passive income freely, and up to $25,000/yr can offset ordinary (W-2) income if you actively participate and your MAGI is under $100k (phasing out to $0 by $150k); unused losses carry forward. On sale, claimed depreciation is recaptured at up to 25%, and gains may owe capital-gains tax (a 1031 exchange can defer both). Figures are a year-1 estimate at your 24.0% rate — not tax advice; consult a CPA.
Schools (NCES district)
No district data.
Livability — New York
- Score
- 75/100
- State rank
- #268
- US rank
- #4188
Category grades
Schools grade is shown separately in the Schools card above.
Census & demographics
- Census place
- New York, NY
- County
- Kings County · 2,614,986 people
- City population
- 7,731,280
- Metro
- New York-Newark-Jersey City, NY-NJ-PA
- Population (ZIP)
- 94,196
- Household income
- $58,347
- Rent vs Own
- Severe rent burden
- 6849.0
Population outlook (Kings County) Hauer SSP2
- Today (2025)
- 2,847,441 people
- By 2030
- 2,937,006 · +3.1%
- By 2040
- 3,095,491 · +8.7%
- By 2050
- 3,228,968 · +13.4%
- By 2075
- 3,321,723 · +16.7%
- By 2100
- 3,111,387 · +9.3%
Race, ethnicity, and origin ACS 2023
- Neighborhood character
- Diverse neighborhood (Simpson 0.58)
- Race & ethnicity
- White 60% Asian 21% Hispanic / Latino 13% Two or more races 3% Black 1%
- Hispanic origin (detail)
- Mexican 5% Puerto Rican 2%
- Common ancestry
- Romanian 4% Italian 2% Scotch-Irish 1%
- Foreign-born
- 30% · China, Canada, Jamaica
- Languages at home
- 18% English-only · German/W. Germanic 39% Chinese 19% Spanish 13%
Political lean MEDSL · Kings
- 2024 margin
- Solid D (+44.0) · D 72.0% · R 28.0%
- 2008→2024 swing
- -15.5pp toward R · 2008: 59.4pp · 2024: 44.0pp
- All cycles
- 2024: D+44.0 2020: D+54.8 2016: D+61.8 2012: D+63.9 2008: D+59.4
Not yet ingested
- Civics
- —
Market trends
- HPI YoY
- ▲ 14.87%
- Current HPI
- 315.9088
- Rent YoY
- —
- Metro
- New York-Newark-Jersey City, NY-NJ-PA
- State GDP YoY
- ▲ 2.60%
- F500 in state
- 92
Industry mix (Fortune 500 HQ in NY)
| Industry | F500 HQs | Revenue |
|---|---|---|
| Financial Services | 10 | $950B |
|
||
| Consumer Goods | 9 | $162B |
|
||
| Insurance | 4 | $225B |
|
||
| Telecommunications | 2 | $144B |
|
||
| Pharmaceuticals | 2 | $112B |
|
||
| Media / Entertainment | 2 | $69B |
|
||
Price history
1 event — show timeline
- 2026-06-11 Listed $2,199,999 BNYMLS
Cash-flow waterfall
monthlySold comps — $/sqft
last 12 mo · ≤1 miLoading sold comps…