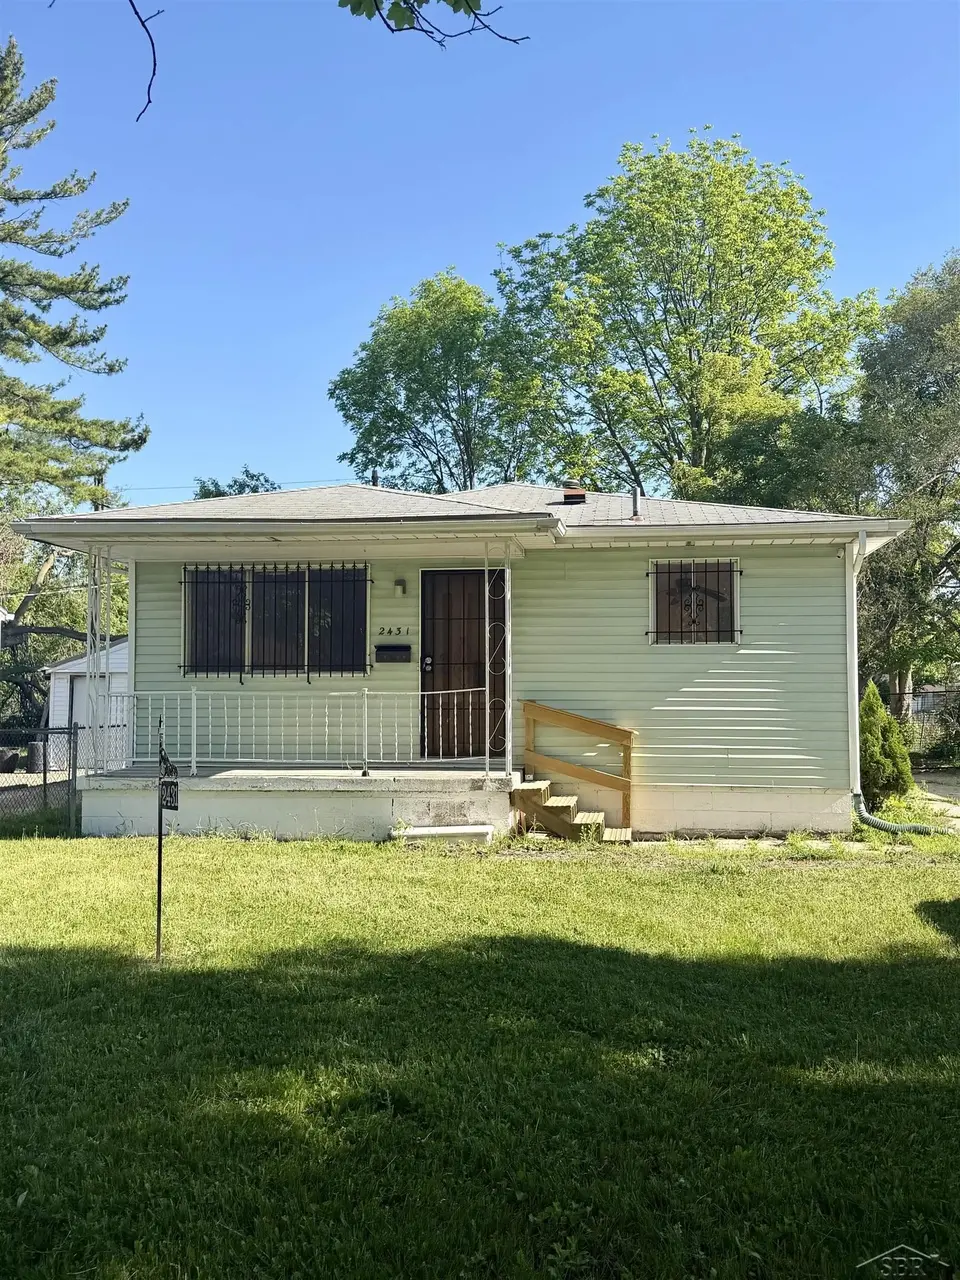
2431 Ledyard St · Saginaw, MI
Flood risk 1/10 · Minimal
- FEMA flood zone
- X (unshaded)
- Chance of flooding over 30 yrs
- 0.0%
- Est. flood insurance / yr
- $473 – $860
Fire risk 1/10 · Minimal
- Est. fire insurance / yr
- $784 – $1,456
Heat risk 2/10 · Minimal
- Hot days now (above 100°F)
- 7 days/yr
- Hot days in 30 yrs
- 14 days/yr
Wind risk 1/10 · Minimal
- Chance of severe wind over 30 yrs
- —
Air-quality risk 2/10 · Minimal
- Unhealthy air days now
- 1 days/yr
- Unhealthy air days in 30 yrs
- 2 days/yr
Risk factors via First Street. Map © Google.
Why this score? — see what drove the B- grade
The composite is a weighted blend of 9 inputs, each scored 0–100. Each bar is that input's sub-score; the figure is the points it added to the 100-point composite (weight × sub-score).
- Cash flow +30.0/30.0
- 1% rule +10.0/10.0
- DSCR +10.0/10.0
- ARV discount +7.5/15.0
- Livability +3.2/5.0
- Rent growth +2.5/5.0
- Condition / age +2.5/5.0
- Schools +2.0/10.0
- Appreciation +0.0/10.0
$59,999
🖨 Deal sheet (PDF) 📄 Offer letter ✓ Due diligence
Listing remarks MLS
Recently remodeled and move-in ready 3-bedroom, 1 bath home. Features include easy-to-maintain living spaces, updated interior finishes, and a new furnace for added efficiency. A usable full basement provides additional storage or workspace, and the fenced yard is ideal for outdoor enjoyment. Whether you're starting your next chapter or looking for an affordable, turnkey option, this cute as a button home is ready to welcome you in. Just unpack and enjoy!
Key facts
- New furnace
- Full basement
- Updated home
Tags
Property features AI
Finance
- Other: Residential property type; Above-grade finished area reported (988 square feet)
- Financial info: No additional financial details provided
- HOA & community: Homeowners association present
Exterior
- Parking: No parking details provided
- Security: No security features provided
- Utilities: Public water; Public sewer
- Home design: Single-family residence; One level
- Construction: Vinyl siding exterior
- Exterior features: Lot dimensions approximately 50 x 117; Lot size about 0.13 acres; No pool
Interior
- Kitchen: No kitchen appliance details provided
- Bedrooms: Total of 4 rooms (bedrooms and living spaces combined)
- Flooring: No flooring details provided
- Bathrooms: 1 full bathroom
- Heating & cooling: Forced air heating (natural gas); Ceiling fan(s) for cooling
- Interior features: Basement
- Laundry & utility: No laundry details provided
Neighborhood map
What this means for you Summary
Snapshot
- This is a 3-bed/1.0-bath single-family listed at $60k.
Deal economics
- At list price, monthly cash flow is $609 ($7k/yr) — positive.
- The deal already cash-flows at list — no discount required.
- Meets the 1% rule at list price ($1k rent vs $60k).
- Recommended offer: $59k (1.5% below list) — sets the bar for market timing.
- Cap rate 18.5% vs local median 8.3% in Saginaw — top-decile yield for the area; either an underpriced asset or a hidden risk that comps aren't pricing in. Stress-test before assuming the spread holds.
Location & tenants
- Location reads 63/100 on livability (#521 in MI) — a middle-class / working-renter tenant base. Strengths: cost of living A+, housing A+, health & safety A+; Watch: schools F, crime F, amenities F.
- Saginaw School District (urban): math 20% / reading 29% proficiency, ranked #444 of 540 in MI (top 82%) — low school quality limits family demand, transient renter base, plan for 1-2y turnover; 76% free/reduced lunch — lower-income household profile, screen leases tightly.
- Market conditions: 201 active listings in the ZIP; 1 comparable units currently listed for rent nearby; 154 units permitted in Saginaw County in 2024 (0 in 5+ unit buildings).
Forward outlook
- Local home prices are declining (-3.0%/yr); year-one equity from $415 of loan paydown is wiped out by about $2k of value loss. Plan a longer hold.
- Saginaw County population projected at -25% by 2050 — secular population decline; favor cash flow + early exit over multi-decade hold.
- At projected returns (-3.0% appreciation + 3.0% rent growth), your $17k cash investment doubles in ~3 years — after that, you're playing with house money.
Negotiation context
- It's been on market 18 days — a 2% lower offer ($59k) is reasonable based on typical stale-listing flexibility.
- 2 sale attempts; this cycle's ask has dropped $10k (14%) from the opening price — seller is motivated, your offer sets the floor, not the list.
Questions for the listing agent
- Built in 1963 — when were the roof, HVAC, electrical panel, plumbing, and water heater last replaced?
- Is there a deadline driving the sale (1031 exchange, divorce, estate, relocation)? That informs how much negotiation room exists.
- Schools are F-rated, which usually means shorter tenancies and higher turnover. Who's the typical renter profile here, and what's been the actual vacancy rate?
- Crime grade is F in this area — have there been break-ins, vandalism, or insurance claims at this property in the last 3 years? What carrier currently insures it and at what premium?
- What's the average days-on-market for RENTAL listings here right now (not sales)? A rising rental-DOM trend means longer vacancies and softer asking-rent achievability than the comps imply.
- What's the recent tenant-quality profile in this submarket — average credit score on applications, eviction rate, late-payment / NSF rate, and stable-employment percentage? A property-management company in the area should have these aggregated.
- How much new for-sale + rental construction is in the pipeline within 1–3 miles? Heavy new supply typically softens prices + rents 12–24 months out; constrained supply supports both.
Investment metrics
- 1% rule
- 2.08% ✓
- Cap rate
- 18.48%
- Cash-on-cash
- 43.52%
- DSCR
- 2.94
- GRM
- 4.0
CMA / ARV
- ARV (on-the-fly)
- $36,556
- Comps found
- 12
Show comp detail 12 sales within ~0.75 mi
| Address | Dist | Beds/Ba | Sqft | Sold | Price | $/sf | Match |
|---|---|---|---|---|---|---|---|
| 2523 E Holland Ave | 0.35mi | 2/1.0 (-1) | 987 (-0%) | 8mo | $18,100 | $18 | 72 |
| 945 S 27th St | 0.45mi | 3/1.0 | 884 (-10%) | 2mo | $13,000 | $15 | 60 |
| 2420 Bancroft St | 0.19mi | 2/1.0 (-1) | 845 (-14%) | 4mo | $60,000 | $71 | 59 |
| 347 S 19th St | 0.66mi | 3/1.0 | 950 (-4%) | 5mo | $27,500 | $29 | 59 |
| 2143 Whittier St | 0.25mi | 3/1.0 | 845 (-14%) | 8mo | $50,000 | $59 | 57 |
| 427 S 24th St | 0.64mi | 3/1.5 | 1,040 (+5%) | 4mo | $79,900 | $77 | 56 |
| 525 S 14th St | 0.58mi | 3/1.0 | 1,046 (+6%) | 9mo | $48,500 | $46 | 56 |
| 919 S 4th Ave | 0.57mi | 3/1.0 | 1,090 (+10%) | 3mo | $4,000 | $4 | 53 |
| 315 S 19th St | 0.72mi | 2/1.0 (-1) | 912 (-8%) | 5mo | $34,000 | $37 | 45 |
| 2021 Cumberland St | 0.74mi | 2/1.0 (-1) | 874 (-12%) | 5mo | $14,500 | $17 | 37 |
| 523 S 29th St | 0.73mi | 3/1.0 | 864 (-13%) | 10mo | $75,000 | $87 | 37 |
| 455 S 24th St | 0.59mi | 2/1.0 (-1) | 840 (-15%) | 9mo | $30,000 | $36 | 35 |
Match score weights: distance 35% · size 25% · config 20% · recency 20%. Top-matched comps best support the ARV.
Projected returns pro-forma
-3.0% appreciation · 3.0% rent growth · sell at horizon
- IRR
- 40.4%
- Equity multiple
- 2.73×
- Total profit
- $29,080
- Equity at exit
- $8,946
- IRR
- 46.7%
- Equity multiple
- 5.48×
- Total profit
- $75,277
- Equity at exit
- $5,188
Cash invested: $16,800 (down + closing). Projections, not guarantees.
Landlord ↔ Tenant lean methodology
- Overall (STATE)
- 62 Landlord-Friendly
- State Michigan
- 62 Landlord-Friendly · EVEN
- County
- — inherits STATE
- City
- — inherits STATE
ZIP-level market 48601
- Home prices YoY
- -32.1%
- Active inventory
- 201
- Price-to-rent
- 4.0×
Monthly cashflow live
- Estimated rent
- $1,250 medium interval (Pro) →
- Mortgage (P&I)
- −$315
- Tax from tax record
- −$39 /mo · $463/yr
- Insurance
- −$25
- HOA
- −$0
- Vacancy / Maint / Mgmt
- −$262
- Net cashflow
- $609
Break-even live
Sensitivity live
| Price | -10% $643 | -5% $626 | +0% $609 | +5% $592 | +10% $575 |
|---|---|---|---|---|---|
| Rent | -10% $511 | -5% $560 | +0% $609 | +5% $659 | +10% $708 |
| Rate | -1.0pp $640 | -0.5pp $625 | base $609 | +0.5pp $594 | +1.0pp $578 |
UW: 25.0% down · 7.5% · 30yr · 1.5% tax · 5.0% vac · 8.0% maint · 8.0% mgmt
Financing live
Cash to close
- Down payment
- $15,000
- Closing costs
- $1,800
- Reserves months
- —
- Total cash needed
- —
Loan-product check · same deal, 3 products live
Conventional
25% down · 7.5% · 30yr
- Down + closing
- —
- Monthly P&I
- —
- Monthly cashflow
- —
- DSCR
- —
- Eligible?
- —
Personal DTI + credit; lowest rate.
DSCR
20% down · 8.5% · 30yr
- Down + closing
- —
- Monthly P&I
- —
- Monthly cashflow
- —
- DSCR
- —
- Eligible?
- —
No personal income docs; deal must DSCR.
Hard money
10% down · 12.0% · 12mo
- Down + closing
- —
- Monthly P&I
- —
- Monthly cashflow
- —
- DSCR
- —
- Eligible?
- —
Short-term bridge; refi at stabilization.
Rent comps 1 comps
| Address | Beds | Baths | Sqft | Rent | $/sqft | DOM | Units | Dist |
|---|---|---|---|---|---|---|---|---|
| 3328 Webber St Saginaw, MI | 3.0 | 1.0 | 878 | $1,250 | $1.42 | 44d | 1 | 0.90mi |
Listing history 21 events
-
2026-06-19days on market $59,999 Active 18 DOM
-
2026-06-18days on market $59,999 Active 17 DOM
-
2026-06-17days on market $59,999 Active 16 DOM
-
2026-06-16days on market $59,999 Active 15 DOM
-
2026-06-15days on market $59,999 Active 14 DOM
-
2026-06-14days on market $59,999 Active 12 DOM
-
2026-06-12days on market $59,999 Active 11 DOM
-
2026-06-09days on market $59,999 Active 8 DOM
-
2026-06-08days on market $59,999 Active 7 DOM
-
2026-06-07days on market $59,999 Active 6 DOM
-
2026-06-05days on market $59,999 Active 3 DOM
-
2026-06-03days on market $59,999 Active 2 DOM
-
2026-06-02remarks 546-char remark
-
2026-06-02pricedays on market $59,999 Active 1 DOM
-
2026-06-01days on market $62,999 Active 178 DOM
-
2026-05-31days on market $62,999 Active 177 DOM
-
2026-05-30days on market $62,999 Active 176 DOM
-
2026-02-06price $62,999 459-char remark
Show marketing remark (459 chars)
Recently remodeled and move-in ready 3-bedroom, 1 bath home. Features include easy-to-maintain living spaces, updated interior finishes, and a new furnace for added efficiency. A usable full basement provides additional storage or workspace, and the fenced yard is ideal for outdoor enjoyment. Whether you're starting your next chapter or looking for an affordable, turnkey option, this cute as a button home is ready to welcome you in. Just unpack and enjoy!
-
2026-02-05price $62,999
-
2025-12-05$69,999 Active
Show marketing remark (459 chars)
Recently remodeled and move-in ready 3-bedroom, 1 bath home. Features include easy-to-maintain living spaces, updated interior finishes, and a new furnace for added efficiency. A usable full basement provides additional storage or workspace, and the fenced yard is ideal for outdoor enjoyment. Whether you're starting your next chapter or looking for an affordable, turnkey option, this cute as a button home is ready to welcome you in. Just unpack and enjoy!
-
2025-12-05$69,999 Active 459-char remark
Show marketing remark (459 chars)
Recently remodeled and move-in ready 3-bedroom, 1 bath home. Features include easy-to-maintain living spaces, updated interior finishes, and a new furnace for added efficiency. A usable full basement provides additional storage or workspace, and the fenced yard is ideal for outdoor enjoyment. Whether you're starting your next chapter or looking for an affordable, turnkey option, this cute as a button home is ready to welcome you in. Just unpack and enjoy!
ⓘ Source: listings_history table (triggers on properties + properties_extension) + one-shot
backfill from property_details.listing_events for pre-trigger history.
Tax reassessment forecast MI · Partial reset (capped growth)
- Current annual tax
- $463 · $39/mo
- Projected year-2 tax
- $693 · $58/mo
- Expected delta
- +$231/yr (+$19/mo · 49.8%)
ⓘ Screening estimate from a state-policy table — verify with the county assessor before closing.
Climate risk First Street
- Flood 1/10 Low FEMA zone X (unshaded) · 0% chance over 30 yrs
- Wildfire 1/10 Low
- Heat 2/10 Low 7 d/yr ≥100°F today · 14 d/yr by 30 yrs out
- Wind 1/10 Low
- Air quality 2/10 Low 1 unhealthy d/yr today · 2 by 30 yrs out
Nearby sold comps map
Loading sold comps map…
Walkable amenities ~0.75 mi
Loading nearby amenities…
Taxation est. · year 1
- Rental income
- $15,000
- − Mortgage interest
- −$3,361
- − Property taxes
- −$463
- − Insurance
- −$300
- − Repairs & maintenance
- −$1,200
- − Management
- −$1,200
- − Depreciation
- −$1,745
- Taxable income
- $6,731
- Est. tax owed @ 24.0%
- −$1,615
- After-tax cash flow
- $5,696/yr
For passive investors: Depreciation is non-cash, so a rental often shows a tax loss while cash-flowing — sheltering income. Rental losses are passive: they offset passive income freely, and up to $25,000/yr can offset ordinary (W-2) income if you actively participate and your MAGI is under $100k (phasing out to $0 by $150k); unused losses carry forward. On sale, claimed depreciation is recaptured at up to 25%, and gains may owe capital-gains tax (a 1031 exchange can defer both). Figures are a year-1 estimate at your 24.0% rate — not tax advice; consult a CPA.
Schools (NCES district)
- District
- Saginaw School District
- NCES district ID
- 2630390
- Math proficiency
- 20% ▼ -5.00%
- Reading proficiency
- 29% ▼ -3.00%
- Median HH income
- $28,940
- Composite
- 19.6/100
- National rank
- #8755
- State rank
- #444 of 540 in MI
Livability — Saginaw
- Score
- 63/100
- State rank
- #521
- US rank
- #15424
Category grades
Schools grade is shown separately in the Schools card above.
Census & demographics
- Census place
- Saginaw, MI
- City population
- 54,884
- Population (ZIP)
- 32,069
Population outlook (Saginaw County) Hauer SSP2
- Today (2025)
- 180,568 people
- By 2030
- 172,302 · -4.6%
- By 2040
- 153,919 · -14.8%
- By 2050
- 135,519 · -24.9%
- By 2075
- 97,199 · -46.2%
- By 2100
- 65,037 · -64.0%
Race, ethnicity, and origin ACS 2023
- Neighborhood character
- Diverse neighborhood (Simpson 0.56)
- Race & ethnicity
- Black 59% White 27% Hispanic / Latino 12% Two or more races 5%
- Hispanic origin (detail)
- Mexican 10%
- Common ancestry
- Romanian 2% Lithuanian 2%
- Foreign-born
- 1% · Canada
- Languages at home
- 96% English-only · Spanish 4%
Political lean MEDSL · Saginaw
- 2024 margin
- Toss-up / Even · D 47.7% · R 51.0% · Other 1.4%
- 2008→2024 swing
- -20.6pp toward R · 2008: 17.3pp · 2024: -3.3pp
- All cycles
- 2024: R+3.3 2020: D+0.3 2016: R+1.1 2012: D+11.9 2008: D+17.3
Not yet ingested
- Civics
- —
Market trends
- HPI YoY
- ▼ -93.46%
- Current HPI
- 197.3359
- Rent YoY
- —
- Metro
- —
- State GDP YoY
- ▲ 1.37%
- F500 in state
- 28
Industry mix (Fortune 500 HQ in MI)
| Industry | F500 HQs | Revenue |
|---|---|---|
| Automotive Parts | 3 | $48B |
|
||
| Automotive | 2 | $372B |
|
||
| Chemicals | 1 | $45B |
|
||
| Automotive Retail | 1 | $29B |
|
||
| Healthcare / Medical Devices | 1 | $23B |
|
||
| Automotive Technology | 1 | $20B |
|
||
Price history
-10.0% since first listed4 events — show timeline
- 2026-02-06 Price Changed $62,999 MiRealSource-MiMLS
- 2026-02-05 Price Changed $62,999 REALCOMP
- 2025-12-05 Listed $69,999 REALCOMP
- 2025-12-05 Listed $69,999 MiRealSource-MiMLS
Property tax history
-1.4%/yrLatest (2025): $463 · -16.2% YoY. Source: county tax records.
Cash-flow waterfall
monthlySold comps — $/sqft
last 12 mo · ≤1 miLoading sold comps…