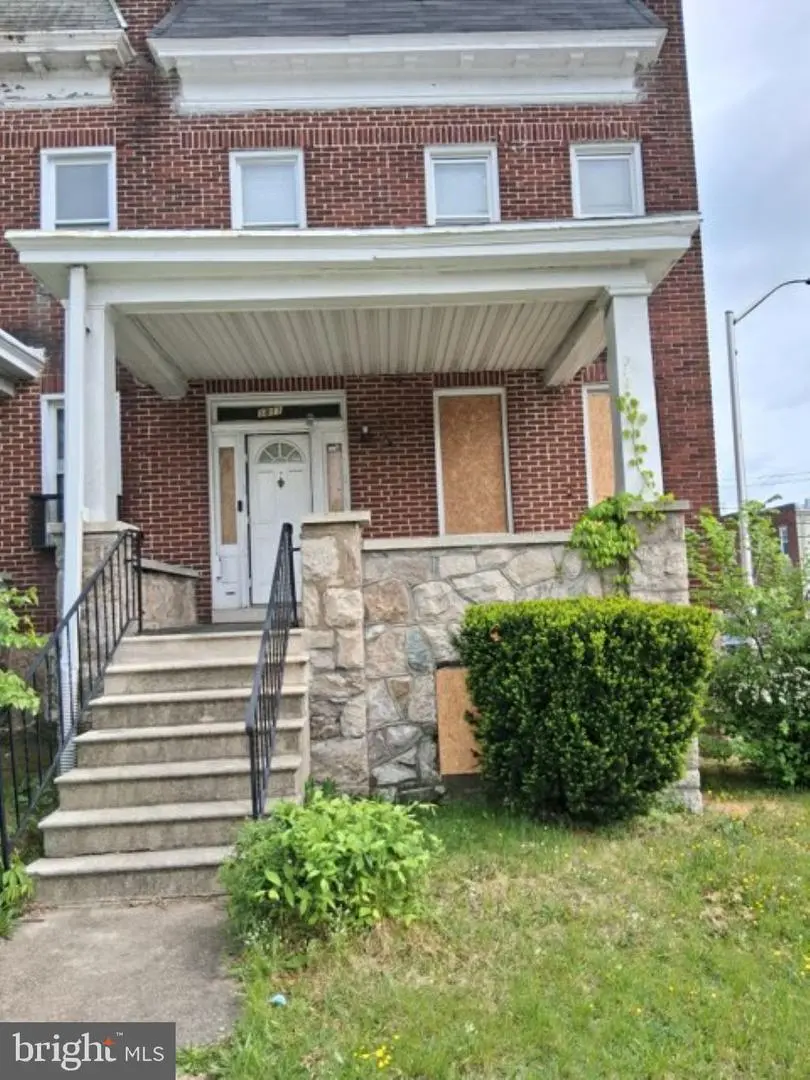
1811 Gwynns Falls Pkwy · Baltimore, MD
Flood risk 1/10 · Minimal
- FEMA flood zone
- X (unshaded)
- Chance of flooding over 30 yrs
- 0.0%
- Est. flood insurance / yr
- $473 – $860
Fire risk 1/10 · Minimal
- Est. fire insurance / yr
- $755 – $1,403
Heat risk 7/10 · Major
- Hot days now (above 103°F)
- 7 days/yr
- Hot days in 30 yrs
- 15 days/yr
Wind risk 6/10 · Moderate
- Chance of severe wind over 30 yrs
- 27.0%
Air-quality risk 3/10 · Minor
- Unhealthy air days now
- 3 days/yr
- Unhealthy air days in 30 yrs
- 4 days/yr
Risk factors via First Street. Map © Google.
Why this score? — see what drove the B- grade
The composite is a weighted blend of 9 inputs, each scored 0–100. Each bar is that input's sub-score; the figure is the points it added to the 100-point composite (weight × sub-score).
- Cash flow +29.8/30.0
- DSCR +10.0/10.0
- 1% rule +9.6/10.0
- ARV discount +5.2/15.0
- Rent growth +4.2/5.0
- Livability +3.8/5.0
- Condition / age +2.5/5.0
- Schools +1.0/10.0
- Appreciation +0.0/10.0
$120,000
🖨 Deal sheet (PDF) 📄 Offer letter ✓ Due diligence
Listing remarks MLS
END OF GROUP BRICK PORCH FRONT USED AS TWO UNITS IN NEED OF REPAIR. PROPERTY SOLD AS IS
Key facts
- One car garage
- Front porch
- Parking pad
Tags
Property features AI
Finance
- Financial info: Ownership interest: Ground Rent
Exterior
- Parking: Rear-entry attached garage (1 space); Driveway; On-street parking
- Utilities: Public water; Public sewer; Natural gas service
- Home design: End of Row/Townhouse structure; Brick construction
- Construction: Brick construction; Brick/mortar foundation; Above-grade finished area and below-grade unfinished area
- Exterior features: End of row townhouse; Ground rent paid annually
Interior
- Bedrooms: Three bedrooms on the main level
- Bathrooms: Three full bathrooms (main level)
- Heating & cooling: Radiator heat; Natural gas for heating, hot water, and cooling fuel
- Interior features: Full unfinished basement
Neighborhood map
What this means for you Summary
Snapshot
- This is a 3-bed/1.0-bath townhouse listed at $120k.
Deal economics
- At list price, monthly cash flow is $442 ($5k/yr) — positive.
- The deal already cash-flows at list — no discount required.
- Meets the 1% rule at list price ($2k rent vs $120k).
- Recommended offer: $116k (3.0% below list) — sets the bar for market timing.
Location & tenants
- Location reads 76/100 on livability (#90 in MD, #3,396 nationally) — a middle-class / working-renter tenant base. Strengths: amenities A+, commute A+, housing A+; Watch: crime F.
- Baltimore City Public Schools (urban): math 7% / reading 16% proficiency, ranked #24 of 24 in MD (top 100%) — low school quality limits family demand, transient renter base, plan for 1-2y turnover; 79% free/reduced lunch — lower-income household profile, screen leases tightly.
- Zoned schools: Elmer A. Henderson: A Johns Hopkins Partnership (math 2% / reading 16%, grade F, #650 of 860 statewide, top 77%, 642 students, 80% FRL); Vanguard Collegiate Middle (math 3% / reading 15%, grade F, #212 of 225 statewide, top 95%, 343 students, 84% FRL); Baltimore Polytechnic Institute (math 71% / reading 84%, grade A-, #22 of 222 statewide, top 10%, 1,555 students, 43% FRL).
- Zoned-school proficiency averages 32% at this address vs 12% district-wide (+20 pts) — the actual schools serving this property are materially stronger than the Baltimore City Public Schools average implies; a family-tenant draw the district grade alone would hide.
- Market conditions: Rents rising fast (+6.6%/yr); 333 active listings in the ZIP; 40 comparable units currently listed for rent nearby; rentals at typical pace (median 26d on market — plan ~3-4 weeks tenant-placement turnaround); 48% of comp listings sitting > 30 days — soft ceiling on asking rent; lower-income renter base — watch delinquency; 1,273 units permitted in Baltimore city in 2024 (1,104 in 5+ unit buildings).
Forward outlook
- Local home prices are declining (-3.0%/yr); year-one equity from $830 of loan paydown is wiped out by about $4k of value loss. Plan a longer hold.
- Baltimore County population projected to shrink 4% by 2050 — rents likely to lag national; underwrite the cash flow, not the appreciation.
- At projected returns (-3.0% appreciation + 6.6% rent growth), your $34k cash investment doubles in ~6 years — after that, you're playing with house money.
Negotiation context
- It's been on market 54 days — a 3% lower offer ($116k) is reasonable based on typical stale-listing flexibility.
- 4 sale attempts since 21y ago; this cycle's ask has dropped $45k (27%) from the opening price — seller is motivated, your offer sets the floor, not the list.
- Current owner paid $50k; list at $120k implies a 140% gain — meaningful room to come down on a strong offer.
Risks & watch-outs
- Watch-outs: property tax is 2.6% of price; built in 1927 — expect roof / HVAC / electrical / plumbing capex.
- Climate carrying-cost: major wind risk, 27% chance of damaging wind over 30y; extreme-heat days projected 7→15/yr by 2055 (HVAC capex compounding) — expect insurance premiums to compound above CPI over the hold.
Questions for the listing agent
- It's been on market 54 days. Have you received any prior offers? Is the seller open to a 3% concession, seller financing, or rate buy-down credit?
- Built in 1927 — when were the roof, HVAC, electrical panel, plumbing, and water heater last replaced?
- Property tax is high relative to price — has the assessment been appealed recently, and will the sale trigger a re-assessment?
- Is there a deadline driving the sale (1031 exchange, divorce, estate, relocation)? That informs how much negotiation room exists.
- Schools are D-rated, which usually means shorter tenancies and higher turnover. Who's the typical renter profile here, and what's been the actual vacancy rate?
- Crime grade is F in this area — have there been break-ins, vandalism, or insurance claims at this property in the last 3 years? What carrier currently insures it and at what premium?
- What's the average days-on-market for RENTAL listings here right now (not sales)? A rising rental-DOM trend means longer vacancies and softer asking-rent achievability than the comps imply.
- What's the recent tenant-quality profile in this submarket — average credit score on applications, eviction rate, late-payment / NSF rate, and stable-employment percentage? A property-management company in the area should have these aggregated.
- How much new for-sale + rental construction is in the pipeline within 1–3 miles? Heavy new supply typically softens prices + rents 12–24 months out; constrained supply supports both.
Investment metrics
- 1% rule
- 1.46% ✓
- Cap rate
- 10.72%
- Cash-on-cash
- 15.80%
- DSCR
- 1.70
- GRM
- 5.7
CMA / ARV
- ARV (median comp)
- $114,235
- List price
- $120,000
- Delta
- 5.05%
- Verdict
- FAIR
- Comps
- 20 within 1.0 mi
Show comp detail 12 sales within ~0.75 mi
| Address | Dist | Beds/Ba | Sqft | Sold | Price | $/sf | Match |
|---|---|---|---|---|---|---|---|
| 2105 Whittier Ave | 0.09mi | 3/1.5 | 1,587 (-4%) | 1mo | $80,000 | $50 | 86 |
| 2521 Reisterstown Rd | 0.10mi | 3/2.0 | 1,578 (-5%) | 3mo | $215,000 | $136 | 81 |
| 2117 N Smallwood St | 0.28mi | 3/2.5 | 1,680 (+1%) | 1mo | $192,000 | $114 | 78 |
| 3104 Tioga Pkwy | 0.45mi | 3/2.0 | 1,640 (-1%) | 3mo | $217,000 | $132 | 71 |
| 2009 Ruxton Ave | 0.41mi | 4/2.0 (+1) | 1,600 (-3%) | 1mo | $234,000 | $146 | 66 |
| 2402 Liberty Heights Ave | 0.25mi | 4/1.5 (+1) | 1,800 (+9%) | 4mo | $90,000 | $50 | 64 |
| 608 Cumberland St | 0.67mi | 3/2.0 | 1,700 (+3%) | 2mo | $90,000 | $53 | 58 |
| 1601 Ruxton Ave | 0.69mi | 3/1.0 | 1,568 (-5%) | 1mo | $90,000 | $57 | 58 |
| 2326 Braddish Ave | 0.60mi | 3/1.5 | 1,500 (-9%) | 2mo | $159,000 | $106 | 53 |
| 2453 Mcculloh St | 0.66mi | 3/1.0 | 1,460 (-12%) | 3mo | $99,900 | $68 | 47 |
| 2304 Ashburton St | 0.66mi | 4/2.0 (+1) | 1,520 (-8%) | 4mo | $255,000 | $168 | 43 |
| 1722 N Bentalou St | 0.57mi | 4/2.0 (+1) | 1,450 (-12%) | 3mo | $245,000 | $169 | 41 |
Match score weights: distance 35% · size 25% · config 20% · recency 20%. Top-matched comps best support the ARV.
Projected returns pro-forma
-3.0% appreciation · 6.63% rent growth · sell at horizon
- IRR
- 11.1%
- Equity multiple
- 1.46×
- Total profit
- $15,443
- Equity at exit
- $17,892
- IRR
- 23.1%
- Equity multiple
- 3.36×
- Total profit
- $79,388
- Equity at exit
- $10,375
Cash invested: $33,600 (down + closing). Projections, not guarantees.
Landlord ↔ Tenant lean methodology
- Overall (CITY)
- 12 Strongly Tenant-Friendly
- State Maryland
- 27 Tenant-Leaning · D+14
- County
- — inherits STATE
- City Baltimore
- 12 Strongly Tenant-Friendly · D+58
ZIP-level market 21217
- Rents YoY
- 6.6%
- Active inventory
- 333
- Price-to-rent
- 5.7×
Monthly cashflow live
- Estimated rent
- $1,749 high interval (Pro) →
- Mortgage (P&I)
- −$629
- Tax from tax record
- −$260 /mo · $3,124/yr
- Insurance
- −$50
- HOA
- −$0
- Vacancy / Maint / Mgmt
- −$367
- Net cashflow
- $442
Break-even live
Sensitivity live
| Price | -10% $510 | -5% $476 | +0% $442 | +5% $408 | +10% $374 |
|---|---|---|---|---|---|
| Rent | -10% $304 | -5% $373 | +0% $442 | +5% $511 | +10% $581 |
| Rate | -1.0pp $503 | -0.5pp $473 | base $442 | +0.5pp $411 | +1.0pp $380 |
UW: 25.0% down · 7.5% · 30yr · 1.5% tax · 5.0% vac · 8.0% maint · 8.0% mgmt
Financing live
Cash to close
- Down payment
- $30,000
- Closing costs
- $3,600
- Reserves months
- —
- Total cash needed
- —
Loan-product check · same deal, 3 products live
Conventional
25% down · 7.5% · 30yr
- Down + closing
- —
- Monthly P&I
- —
- Monthly cashflow
- —
- DSCR
- —
- Eligible?
- —
Personal DTI + credit; lowest rate.
DSCR
20% down · 8.5% · 30yr
- Down + closing
- —
- Monthly P&I
- —
- Monthly cashflow
- —
- DSCR
- —
- Eligible?
- —
No personal income docs; deal must DSCR.
Hard money
10% down · 12.0% · 12mo
- Down + closing
- —
- Monthly P&I
- —
- Monthly cashflow
- —
- DSCR
- —
- Eligible?
- —
Short-term bridge; refi at stabilization.
Rent comps 40 comps
| Address | Beds | Baths | Sqft | Rent | $/sqft | DOM | Units | Dist |
|---|---|---|---|---|---|---|---|---|
| 2201 Whittier Ave Baltimore, MD | 4.0 | 2.0 | 1750 | $1,700 | $0.97 | 45d | 1 | 0.13mi |
| 2201 Whittier Ave Baltimore, MD | 4.0 | 2.0 | 1750 | $1,700 | $0.97 | 19d | 1 | 0.13mi |
| 2301 Whittier Ave Unit 3 Baltimore, MD | 2.0 | 2.0 | 1104 | $1,650 | $1.49 | 45d | 1 | 0.17mi |
| 2301 Whittier Ave Unit 1 Baltimore, MD | 2.0 | 1.0 | 1104 | $1,400 | $1.27 | 45d | 1 | 0.17mi |
| 2301 Whittier Ave Unit 2 Baltimore, MD | 2.0 | 2.0 | 1104 | $1,400 | $1.27 | 45d | 1 | 0.17mi |
| 2231 Orem Ave Baltimore, MD | 3.0 | 1.5 | 1140 | $1,750 | $1.54 | 19d | 1 | 0.18mi |
| 2128 N Pulaski St Baltimore, MD | 4.0 | 3.0 | 2166 | $2,200 | $1.02 | 45d | 1 | 0.23mi |
| 2204 Clifton Ave Baltimore, MD | 3.0 | 1.0 | 1400 | $1,450 | $1.04 | 6d | 1 | 0.31mi |
| 2910 Reisterstown Rd Baltimore, MD | 1.0–3.0 | 1.0 | 950 | $1,414 | $1.49 | 16d | 4 | 0.44mi |
| 3104 Tioga Pkwy Baltimore, MD | 3.0 | 2.0 | 1640 | $2,050 | $1.25 | 23d | 1 | 0.45mi |
| 2614 Pennsylvania Ave Baltimore, MD | 1.0–3.0 | 1.0–2.0 | 982 | $1,141 | $1.16 | 6d | 4 | 0.47mi |
| 2505 Woodbrook Ave Baltimore, MD | 4.0 | 2.0 | 1256 | $1,745 | $1.39 | 3d | 1 | 0.48mi |
| 2305 Wichita Ave Unit 1 Baltimore, MD | 3.0 | 1.0 | 1950 | $1,300 | $0.67 | 25d | 1 | 0.51mi |
| 1816 N Bentalou St Baltimore, MD | 3.0 | 2.0 | 1350 | $1,700 | $1.26 | 25d | 1 | 0.51mi |
| 1816 N Bentalou St Baltimore, MD | 3.0 | 2.0 | 1350 | $1,700 | $1.26 | 12d | 1 | 0.51mi |
| 1515 Retreat St Baltimore, MD | 3.0 | 2.0 | 1098 | $1,800 | $1.64 | 25d | 1 | 0.53mi |
| 1507 Retreat St Unit 1 Baltimore, MD | 3.0 | 3.0 | 1098 | $2,500 | $2.28 | 45d | 1 | 0.54mi |
| 2405 W North Ave Baltimore, MD | 4.0 | 3.0 | 1826 | $1,900 | $1.04 | 6d | 1 | 0.54mi |
| 1806 N Mount St Baltimore, MD | 3.0 | 3.0 | 1200 | $1,700 | $1.42 | 21d | 1 | 0.57mi |
| 1729 N Fulton Ave Baltimore, MD | 3.0 | 2.0 | 1081 | $1,795 | $1.66 | 45d | 1 | 0.57mi |
| 1617-A Moreland Ave Unit 2nd Flr Baltimore, MD | 2.0 | 1.0 | 1500 | $1,400 | $0.93 | 45d | 1 | 0.64mi |
| 2449 Druid Hill Ave Baltimore, MD | 2.0 | 1.0 | 1100 | $1,800 | $1.64 | 45d | 1 | 0.64mi |
| 2409 Francis St Baltimore, MD | 3.0 | 1.0 | 1298 | $1,500 | $1.16 | 45d | 1 | 0.64mi |
| 2433 Druid Hill Ave Baltimore, MD | 2.0 | 2.5 | 1092 | $1,999 | $1.83 | 45d | 1 | 0.66mi |
| 1616 N Fulton Ave Baltimore, MD | 3.0 | 2.0 | 1620 | $1,795 | $1.11 | 6d | 1 | 0.66mi |
| 2511 Madison Ave #2 Baltimore, MD | 3.0 | 1.0 | 1100 | $1,650 | $1.50 | 45d | 1 | 0.67mi |
| 2636 W North Ave Baltimore, MD | 2.0–3.0 | 1.0–2.0 | 975 | $1,475 | $1.51 | 6d | 1 | 0.67mi |
| 1121 Whitelock St Baltimore, MD | 2.0 | 1.0 | 1180 | $1,300 | $1.10 | 45d | 1 | 0.73mi |
| 519 Sanford Pl Baltimore, MD | 3.0 | 1.0 | 1300 | $1,650 | $1.27 | 17d | 1 | 0.74mi |
| 1501 N Payson St Baltimore, MD | 3.0 | 1.0 | 1400 | $1,550 | $1.11 | 45d | 1 | 0.74mi |
| 1516 N Mount St Baltimore, MD | 3.0 | 1.5 | 1830 | $1,750 | $0.96 | 16d | 1 | 0.76mi |
| 1205 Clendenin St Baltimore, MD | 3.0 | 1.5 | 1560 | $800 | $0.51 | 25d | 1 | 0.78mi |
| 2812 Clifton Ave Baltimore, MD | 3.0 | 1.5 | 1650 | $1,850 | $1.12 | 45d | 1 | 0.80mi |
| 1433 N Fulton Ave Baltimore, MD | 2.0 | 1.0 | 1200 | $1,500 | $1.25 | 45d | 1 | 0.81mi |
| 2339 Eutaw Pl Ste 1 Baltimore, MD | 2.0 | 1.0 | 1300 | $1,275 | $0.98 | 45d | 1 | 0.84mi |
| 2917 Clifton Ave Baltimore, MD | 4.0 | 4.0 | 1700 | $2,150 | $1.26 | 25d | 1 | 0.90mi |
| 805 Brooks Ln #2 Baltimore, MD | 2.0 | 1.0 | 2120 | $1,500 | $0.71 | 4d | 1 | 0.90mi |
| 2401 Brookfield Ave Baltimore, MD | 2.0–3.0 | 1.0–2.0 | 1102 | $1,675 | $1.52 | 25d | 3 | 0.93mi |
| 2407 Brookfield Ave Unit 4 Baltimore, MD | 2.0 | 2.0 | 1300 | $1,550 | $1.19 | 45d | 1 | 0.93mi |
| 1315 Presstman St Baltimore, MD | 4.0 | 2.0 | 1700 | $2,000 | $1.18 | 45d | 1 | 0.94mi |
Listing history 25 events
-
2026-06-21days on market $120,000 Active 54 DOM
-
2026-06-18days on market $120,000 Active 51 DOM
-
2026-06-17days on market $120,000 Active 50 DOM
-
2026-06-16days on market $120,000 Active 49 DOM
-
2026-06-15days on market $120,000 Active 48 DOM
-
2026-06-13days on market $120,000 Active 46 DOM
-
2026-06-09days on market $120,000 Active 42 DOM
-
2026-06-08days on market $120,000 Active 41 DOM
-
2026-06-07days on market $120,000 Active 40 DOM
-
2026-06-04days on market $120,000 Active 37 DOM
-
2026-06-03days on market $120,000 Active 36 DOM
-
2026-06-02days on market $120,000 Active 35 DOM
-
2026-06-01days on market $120,000 Active 34 DOM
-
2026-05-31days on market $120,000 Active 33 DOM
-
2026-05-11status Active 673-char remark
-
2026-05-08historical 673-char remark
-
2026-04-26$165,000 Active 673-char remark
-
2008-09-11soldstatus $50,000 Sold 87-char remark
Show marketing remark (87 chars)
END OF GROUP BRICK PORCH FRONT USED AS TWO UNITS IN NEED OF REPAIR. PROPERTY SOLD AS IS
-
2008-06-06historical 87-char remark
Show marketing remark (87 chars)
END OF GROUP BRICK PORCH FRONT USED AS TWO UNITS IN NEED OF REPAIR. PROPERTY SOLD AS IS
-
2008-05-31$37,900 87-char remark
Show marketing remark (87 chars)
END OF GROUP BRICK PORCH FRONT USED AS TWO UNITS IN NEED OF REPAIR. PROPERTY SOLD AS IS
-
2006-02-16soldstatus $82,000
-
2005-10-26soldstatus $82,000
Show marketing remark (223 chars)
Duplex - Separate furnaces and gas & electric meters. 1st floor - LR, Bedroom, Breakfast Room, Kitchen. 2nd floor - LR, 2 bedrooms, kitchen. Owner pays water bill. 2nd floor - occupied. Refrigerator 1st floor conveys.
-
2005-08-05historical
Show marketing remark (223 chars)
Duplex - Separate furnaces and gas & electric meters. 1st floor - LR, Bedroom, Breakfast Room, Kitchen. 2nd floor - LR, 2 bedrooms, kitchen. Owner pays water bill. 2nd floor - occupied. Refrigerator 1st floor conveys.
-
2005-07-28$99,900
Show marketing remark (223 chars)
Duplex - Separate furnaces and gas & electric meters. 1st floor - LR, Bedroom, Breakfast Room, Kitchen. 2nd floor - LR, 2 bedrooms, kitchen. Owner pays water bill. 2nd floor - occupied. Refrigerator 1st floor conveys.
-
1986-12-18soldstatus $25,000
ⓘ Source: listings_history table (triggers on properties + properties_extension) + one-shot
backfill from property_details.listing_events for pre-trigger history.
Tax reassessment forecast MD · Partial reset (capped growth)
- Current annual tax
- $3,124 · $260/mo
- Projected year-2 tax
- $3,124 · $260/mo
- Expected delta
- $0/yr ($0/mo · 0.0%)
ⓘ Screening estimate from a state-policy table — verify with the county assessor before closing.
Climate risk First Street
- Flood 1/10 Low FEMA zone X (unshaded) · 0% chance over 30 yrs
- Wildfire 1/10 Low
- Heat 7/10 Severe 7 d/yr ≥103°F today · 15 d/yr by 30 yrs out
- Wind 6/10 Major 27% chance of damaging wind over 30 yrs
- Air quality 3/10 Moderate 3 unhealthy d/yr today · 4 by 30 yrs out
Nearby sold comps map
Loading sold comps map…
Walkable amenities ~0.75 mi
Loading nearby amenities…
Taxation est. · year 1
- Rental income
- $20,991
- − Mortgage interest
- −$6,722
- − Property taxes
- −$3,124
- − Insurance
- −$600
- − Repairs & maintenance
- −$1,679
- − Management
- −$1,679
- − Depreciation
- −$3,491
- Taxable income
- $3,696
- Est. tax owed @ 24.0%
- −$887
- After-tax cash flow
- $4,421/yr
For passive investors: Depreciation is non-cash, so a rental often shows a tax loss while cash-flowing — sheltering income. Rental losses are passive: they offset passive income freely, and up to $25,000/yr can offset ordinary (W-2) income if you actively participate and your MAGI is under $100k (phasing out to $0 by $150k); unused losses carry forward. On sale, claimed depreciation is recaptured at up to 25%, and gains may owe capital-gains tax (a 1031 exchange can defer both). Figures are a year-1 estimate at your 24.0% rate — not tax advice; consult a CPA.
Schools (NCES district)
- District
- Baltimore City Public Schools
- NCES district ID
- 2400090
- Math proficiency
- 7% ▼ -9.00%
- Reading proficiency
- 16% ▼ -5.00%
- Median HH income
- $42,108
- Composite
- 10.08/100
- National rank
- #9805
- State rank
- #24 of 24 in MD
Livability — Baltimore
- Score
- 76/100
- State rank
- #90
- US rank
- #3396
Category grades
Schools grade is shown separately in the Schools card above.
Census & demographics
- Census place
- Baltimore, MD
- County
- Baltimore City · 558,601 people
- City population
- 588,727
- Metro
- Baltimore-Columbia-Towson, MD
- Population (ZIP)
- 30,792
- Household income
- $38,409
- Rent vs Own
- Severe rent burden
- 2921.0
Population outlook (Baltimore County) Hauer SSP2
- Today (2025)
- 624,249 people
- By 2030
- 621,541 · -0.4%
- By 2040
- 609,756 · -2.3%
- By 2050
- 597,249 · -4.3%
- By 2075
- 552,236 · -11.5%
- By 2100
- 513,934 · -17.7%
Race, ethnicity, and origin ACS 2023
- Neighborhood character
- Predominantly Black (81%)
- Race & ethnicity
- Black 81% White 12% Two or more races 4% Hispanic / Latino 2% Asian 2%
- Common ancestry
- Romanian 1% Hispanic 1% Italian 1%
- Foreign-born
- 5% · Canada, China, South Korea
- Languages at home
- 94% English-only · Spanish 2% French/Haitian/Cajun 1% Chinese 1%
Political lean MEDSL · Baltimore
- 2024 margin
- Solid D (+73.0) · D 85.2% · R 12.2% · Other 2.6%
- 2008→2024 swing
- -2.5pp toward R · 2008: 75.5pp · 2024: 73.0pp
- All cycles
- 2024: D+73.0 2020: D+76.6 2016: D+74.6 2012: D+76.4 2008: D+75.5
Not yet ingested
- Civics
- —
Market trends
- HPI YoY
- ▼ -187.20%
- Current HPI
- 104.2102
- Rent YoY
- ▲ 6.63%
- Metro
- Baltimore-Columbia-Towson, MD
- State GDP YoY
- ▲ 2.97%
- F500 in state
- 12
Industry mix (Fortune 500 HQ in MD)
| Industry | F500 HQs | Revenue |
|---|---|---|
| Aerospace / Defense | 1 | $71B |
|
||
| Utilities | 1 | $25B |
|
||
| Hotels | 1 | $24B |
|
||
| Consumer Goods | 1 | $7B |
|
||
| Real Estate | 1 | $6B |
|
||
| Chemicals | 1 | $2B |
|
||
Price history
+380.0% since first listed12 events — show timeline
- 2026-05-30 Price Changed $120,000 BRIGHT MLS
- 2026-05-11 Relisted — BRIGHT MLS
- 2026-05-08 Listing Removed — BRIGHT MLS
- 2026-04-26 Listed $165,000 BRIGHT MLS
- 2008-09-11 Sold (MLS) $50,000 MRIS
- 2008-06-06 Delisted — MRIS
- 2008-05-31 Listed $37,900 MRIS
- 2006-02-16 Sold (Public Records) $82,000 Public Records
- 2005-10-26 Sold (MLS) $82,000 MRIS
- 2005-08-05 Delisted — MRIS
- 2005-07-28 Listed $99,900 MRIS
- 1986-12-18 Sold (Public Records) $25,000 Public Records
Property tax history
+2.2%/yrLatest (2025): $3,124 · +10.1% YoY. Source: county tax records.
Cash-flow waterfall
monthlySold comps — $/sqft
last 12 mo · ≤1 miLoading sold comps…