6129 Dixie · New Woodville, OK
Flood risk 1/10 · Minimal
- FEMA flood zone
- X
- Chance of flooding over 30 yrs
- 0.0%
- Est. flood insurance / yr
- $507 – $1,088
Fire risk 5/10 · Moderate
- Est. fire insurance / yr
- $2,463 – $4,575
Heat risk 6/10 · Moderate
- Hot days now (above 109°F)
- 7 days/yr
- Hot days in 30 yrs
- 20 days/yr
Wind risk 4/10 · Minor
- Chance of severe wind over 30 yrs
- 15.0%
Air-quality risk 3/10 · Minor
- Unhealthy air days now
- 3 days/yr
- Unhealthy air days in 30 yrs
- 3 days/yr
Risk factors via First Street. Map © Google.
Why this score? — see what drove the C- grade
The composite is a weighted blend of 9 inputs, each scored 0–100. Each bar is that input's sub-score; the figure is the points it added to the 100-point composite (weight × sub-score).
- Cash flow +15.4/30.0
- Appreciation +10.0/10.0
- ARV discount +7.5/15.0
- DSCR +4.7/10.0
- 1% rule +3.3/10.0
- Rent growth +2.5/5.0
- Schools +2.5/10.0
- Livability +2.5/5.0
- Condition / age +2.5/5.0
$285,000
🖨 Deal sheet 📄 Offer letter ✓ Due diligence
Listing remarks
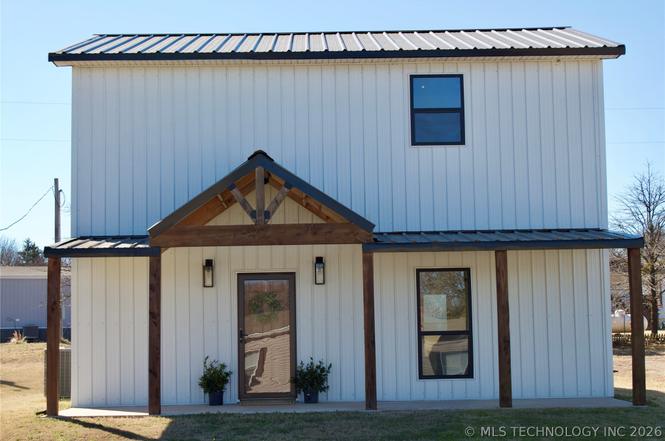
This beautifully designed open-concept living and kitchen space is perfect for entertaining. Exposed pinewood shelves and a custom staircase add warmth and character throughout the home. Upstairs, the spacious bedrooms offer comfort and privacy, while the primary suite features a private balcony ideal for morning coffee or evening sunsets. The full length front and back porches are supported by striking cedar beams, creating inviting outdoor living spaces. Located just 2½ miles from the upcoming Hard Rock Casino and the West Bay Casino, and only minutes from multiple boat ramps, this property sits in a great neighborhood that’s golf cart- and ATV-friendly. Whether you’re
Key facts
- Cedar beams
- Open concept living
- Custom staircase
Tags
Property features AI
Finance
- HOA & community: Sidewalks in the community
Exterior
- Security: Smoke detector(s); No safety shelter
- Utilities: Electricity available; Public water; Aerobic septic
- Home design: 2-story home; Faces north; Slab foundation
- Construction: Built with aluminum siding and wood frame; Metal roof
- Exterior features: Gravel driveway; Sprinkler/irrigation system; Covered porch
Interior
- Kitchen: Dishwasher; Oven; Range; Stove; Refrigerator; Gas water heater; Tankless water heater
- Flooring: Concrete; Tile; Wood veneer
- Bathrooms: 2 full bathrooms
- Heating & cooling: Central heating (propane); Central air conditioning
- Interior features: Ceramic countertops; Ceiling fan(s); Gas oven connection; Programmable thermostat; Vinyl and insulated windows
- Laundry & utility: Washer; Dryer; Electric dryer hookup
Neighborhood map
What this means for you Summary
Snapshot
- This is a 4-bed/2.0-bath other listed at $285k.
Deal economics
- At list price, monthly cash flow is $112 ($1k/yr) — positive.
- The deal already cash-flows at list — no discount required.
- To meet the 1% rule (rent ≥ 1% of price), the offer needs to be $236k (17.1% below list).
- Recommended offer: $236k (17.1% below list) — sets the bar for 1% rule.
Location & tenants
- Location reads 49/100 on livability (#680 in OK) — a working-class tenant base; expect higher turnover. Strengths: cost of living A+, crime A, employment B+; Watch: schools F, amenities F, commute F.
- Kingston (rural): math 27% / reading 32% proficiency, ranked #70 of 270 in OK (top 26%) — low school quality limits family demand, transient renter base, plan for 1-2y turnover; 76% free/reduced lunch — lower-income household profile, screen leases tightly.
- Market conditions: 435 active listings in the ZIP; 42 units permitted in Marshall County in 2024 (0 in 5+ unit buildings).
Forward outlook
- In year one you build about $30k of equity ($2k loan paydown + $28k appreciation (10.0% local appreciation)).
- Marshall County population projected at +22% by 2050 — long-run rental-demand tailwind backs the buy-and-hold thesis.
- At projected returns (10.0% appreciation + 3.0% rent growth), your $80k cash investment doubles in ~3 years — after that, you're playing with house money.
- By year 2, paydown + projected appreciation supports a ~$49k cash-out refi (75% LTV) — recoverable capital for the next deal without selling this one.
Negotiation context
- It's been on market 117 days — a 9% lower offer ($259k) is reasonable based on typical stale-listing flexibility.
Risks & watch-outs
- Climate carrying-cost: moderate wildfire risk; extreme-heat days projected 7→20/yr by 2055 (HVAC capex compounding) — expect insurance premiums to compound above CPI over the hold.
Questions for the listing agent
- It's been on market 117 days. Have you received any prior offers? Is the seller open to a 17% concession, seller financing, or rate buy-down credit?
- Why hasn't it sold? Are there any deal-killer items the seller is aware of (foundation, flood, title, zoning, code violations)?
- Is there a deadline driving the sale (1031 exchange, divorce, estate, relocation)? That informs how much negotiation room exists.
- Schools are F-rated, which usually means shorter tenancies and higher turnover. Who's the typical renter profile here, and what's been the actual vacancy rate?
- What's the average days-on-market for RENTAL listings here right now (not sales)? A rising rental-DOM trend means longer vacancies and softer asking-rent achievability than the comps imply.
- What's the recent tenant-quality profile in this submarket — average credit score on applications, eviction rate, late-payment / NSF rate, and stable-employment percentage? A property-management company in the area should have these aggregated.
- How much new for-sale + rental construction is in the pipeline within 1–3 miles? Heavy new supply typically softens prices + rents 12–24 months out; constrained supply supports both.
Investment metrics
- 1% rule
- 0.83% ✗
- Cap rate
- 6.76%
- Cash-on-cash
- 1.68%
- DSCR
- 1.07
- GRM
- 10.1
CMA / ARV
No comps found within radius.
Projected returns pro-forma
10.0% appreciation · 3.0% rent growth · sell at horizon
- IRR
- 25.5%
- Equity multiple
- 3.03×
- Total profit
- $162,251
- Equity at exit
- $256,751
- IRR
- 22.4%
- Equity multiple
- 6.91×
- Total profit
- $472,004
- Equity at exit
- $553,692
Cash invested: $79,800 (down + closing). Projections, not guarantees.
Landlord ↔ Tenant lean methodology
- Overall (STATE)
- 83 Strongly Landlord-Friendly
- State Oklahoma
- 83 Strongly Landlord-Friendly · R+20
- County
- — inherits STATE
- City
- — inherits STATE
ZIP-level market 73439
- Home prices YoY
- 12.3%
- Active inventory
- 435
- Price-to-rent
- 10.1×
Monthly cashflow live
- Estimated rent
- $2,362 medium interval (Pro) →
- Mortgage (P&I)
- −$1,495
- Tax from tax record
- −$141 /mo · $1,690/yr
- Insurance
- −$119
- HOA
- −$0
- Vacancy / Maint / Mgmt
- −$496
- Net cashflow
- $112
Break-even live
UW: 25.0% down · 7.5% · 30yr · 1.5% tax · 5.0% vac · 8.0% maint · 8.0% mgmt
Financing live
Cash to close
- Down payment
- $71,250
- Closing costs
- $8,550
- Reserves months
- —
- Total cash needed
- —
Loan-product check · same deal, 3 products live
Conventional
25% down · 7.5% · 30yr
- Down + closing
- —
- Monthly P&I
- —
- Monthly cashflow
- —
- DSCR
- —
- Eligible?
- —
Personal DTI + credit; lowest rate.
DSCR
20% down · 8.5% · 30yr
- Down + closing
- —
- Monthly P&I
- —
- Monthly cashflow
- —
- DSCR
- —
- Eligible?
- —
No personal income docs; deal must DSCR.
Hard money
10% down · 12.0% · 12mo
- Down + closing
- —
- Monthly P&I
- —
- Monthly cashflow
- —
- DSCR
- —
- Eligible?
- —
Short-term bridge; refi at stabilization.
Listing history 21 events
-
2026-06-19days on market $285,000 Active 117 DOM
-
2026-06-18days on market $285,000 Active 116 DOM
-
2026-06-17days on market $285,000 Active 115 DOM
-
2026-06-16days on market $285,000 Active 114 DOM
-
2026-06-15days on market $285,000 Active 113 DOM
-
2026-06-14days on market $285,000 Active 111 DOM
-
2026-06-13days on market $285,000 Active 110 DOM
-
2026-06-10days on market $285,000 Active 108 DOM
-
2026-06-09days on market $285,000 Active 107 DOM
-
2026-06-08days on market $285,000 Active 106 DOM
-
2026-06-07days on market $285,000 Active 105 DOM
-
2026-06-05days on market $285,000 Active 102 DOM
-
2026-06-02days on market $285,000 Active 100 DOM
-
2026-06-01days on market $285,000 Active 99 DOM
-
2026-05-31days on market $285,000 Active 98 DOM
-
2026-05-30days on market $285,000 Active 97 DOM
-
2026-05-16price $285,000
-
2026-04-28price $290,000
-
2026-04-14price $305,000
-
2026-03-28price $314,900
-
2026-02-21$319,999 Active
ⓘ Source: listings_history table (triggers on properties + properties_extension) + one-shot
backfill from property_details.listing_events for pre-trigger history.
Tax reassessment forecast OK · Resets to sale price
- Current annual tax
- $1,690 · $141/mo
- Projected year-2 tax
- $2,565 · $214/mo
- Expected delta
- +$875/yr (+$73/mo · 51.8%)
ⓘ Screening estimate from a state-policy table — verify with the county assessor before closing.
Climate risk First Street
- Flood 1/10 Low FEMA zone X · 0% chance over 30 yrs
- Wildfire 5/10 Major
- Heat 6/10 Major 7 d/yr ≥109°F today · 20 d/yr by 30 yrs out
- Wind 4/10 Moderate 15% chance of damaging wind over 30 yrs
- Air quality 3/10 Moderate 3 unhealthy d/yr today · 3 by 30 yrs out
Nearby sold comps map
Loading sold comps map…
Walkable amenities ~0.75 mi
Loading nearby amenities…
Taxation est. · year 1
- Rental income
- $28,346
- − Mortgage interest
- −$15,964
- − Property taxes
- −$1,690
- − Insurance
- −$1,425
- − Repairs & maintenance
- −$2,268
- − Management
- −$2,268
- − Depreciation
- −$8,291
- Taxable loss
- −$3,560
- Est. tax savings @ 24.0%
- +$854
- After-tax cash flow
- $2,198/yr
For passive investors: Depreciation is non-cash, so a rental often shows a tax loss while cash-flowing — sheltering income. Rental losses are passive: they offset passive income freely, and up to $25,000/yr can offset ordinary (W-2) income if you actively participate and your MAGI is under $100k (phasing out to $0 by $150k); unused losses carry forward. On sale, claimed depreciation is recaptured at up to 25%, and gains may owe capital-gains tax (a 1031 exchange can defer both). Figures are a year-1 estimate at your 24.0% rate — not tax advice; consult a CPA.
Schools (NCES district)
- District
- Kingston
- NCES district ID
- 4016590
- Math proficiency
- 27% ▼ -7.00%
- Reading proficiency
- 32% ▼ -7.00%
- Median HH income
- $40,655
- Composite
- 24.88/100
- National rank
- #7585
- State rank
- #70 of 270 in OK
Livability — New Woodville
- Score
- 49/100
- State rank
- #680
- US rank
- #25850
Category grades
Schools grade is shown separately in the Schools card above.
Census & demographics
- Population (ZIP)
- 7,011
Population outlook (Marshall County) Hauer SSP2
- Today (2025)
- 17,405 people
- By 2030
- 18,038 · +3.6%
- By 2040
- 19,513 · +12.1%
- By 2050
- 21,283 · +22.3%
- By 2075
- 27,884 · +60.2%
- By 2100
- 35,435 · +103.6%
Race, ethnicity, and origin ACS 2023
- Neighborhood character
- Predominantly White (75%)
- Race & ethnicity
- White 75% Two or more races 16% Native American 5% Hispanic / Latino 4%
- Common ancestry
- Lithuanian 3% Italian 2% Serbian 1%
- Foreign-born
- 1% · Canada
- Languages at home
- 97% English-only · Spanish 3%
Political lean MEDSL · Marshall
- 2024 margin
- Solid R (+63.4) · D 17.7% · R 81.2% · Other 1.1%
- 2008→2024 swing
- -24.6pp toward R · 2008: -38.8pp · 2024: -63.4pp
- All cycles
- 2024: R+63.4 2020: R+62.5 2016: R+56.6 2012: R+45.7 2008: R+38.8
Not yet ingested
- Civics
- —
Market trends
- HPI YoY
- ▲ 26.96%
- Current HPI
- 246.2253
- Rent YoY
- —
- Metro
- —
- State GDP YoY
- ▲ 1.55%
- F500 in state
- 6
Industry mix (Fortune 500 HQ in OK)
| Industry | F500 HQs | Revenue |
|---|---|---|
| Energy | 3 | $48B |
|
||
Price history
-10.9% since first listed5 events — show timeline
- 2026-05-16 Price Changed $285,000 MLS Technology, Inc.
- 2026-04-28 Price Changed $290,000 MLS Technology, Inc.
- 2026-04-14 Price Changed $305,000 MLS Technology, Inc.
- 2026-03-28 Price Changed $314,900 MLS Technology, Inc.
- 2026-02-21 Listed $319,999 MLS Technology, Inc.
Property tax history
+48.4%/yrLatest (2025): $1,690 · +1479.4% YoY. Source: county tax records.
Cash-flow waterfall
monthlySold comps — $/sqft
last 12 mo · ≤1 miLoading sold comps…