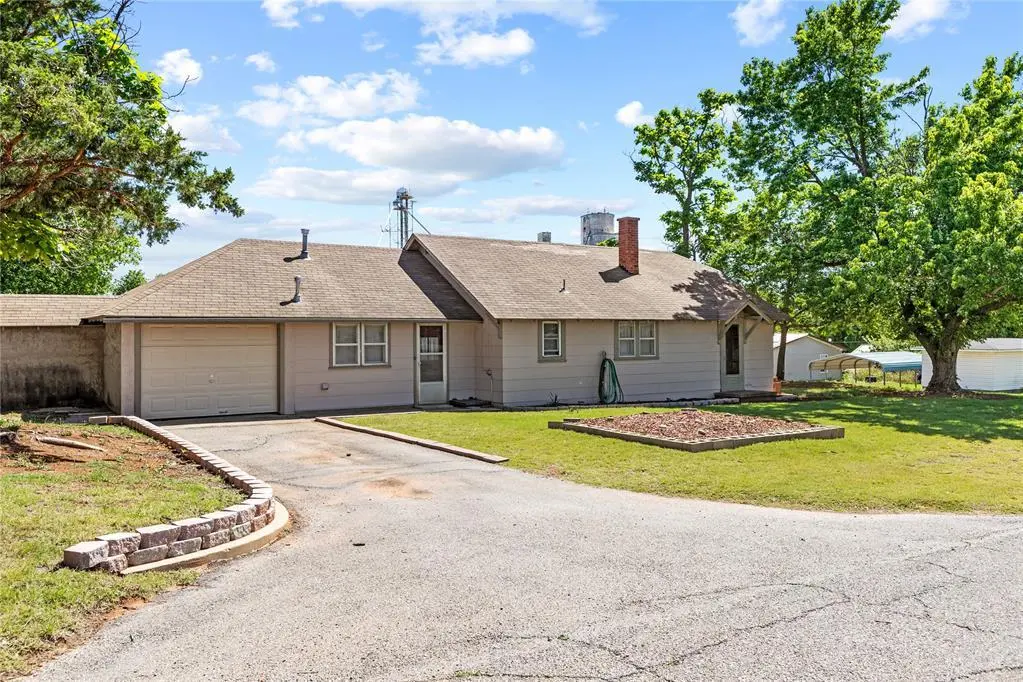
212 E 3rd St · Hydro, OK
Flood risk 1/10 · Minimal
- FEMA flood zone
- X (unshaded)
- Chance of flooding over 30 yrs
- 0.0%
- Est. flood insurance / yr
- $507 – $1,088
Fire risk 5/10 · Moderate
- Est. fire insurance / yr
- $2,463 – $4,575
Heat risk 6/10 · Moderate
- Hot days now (above 107°F)
- 7 days/yr
- Hot days in 30 yrs
- 20 days/yr
Wind risk 2/10 · Minimal
- Chance of severe wind over 30 yrs
- 3.0%
Air-quality risk 1/10 · Minimal
- Unhealthy air days now
- 0 days/yr
- Unhealthy air days in 30 yrs
- 0 days/yr
Risk factors via First Street. Map © Google.
Why this score? — see what drove the C+ grade
The composite is a weighted blend of 9 inputs, each scored 0–100. Each bar is that input's sub-score; the figure is the points it added to the 100-point composite (weight × sub-score).
- Cash flow +27.0/30.0
- DSCR +9.4/10.0
- 1% rule +6.0/10.0
- Appreciation +5.6/10.0
- Livability +3.6/5.0
- Schools +3.5/10.0
- Rent growth +2.5/5.0
- Condition / age +2.5/5.0
- ARV discount +0.0/15.0
$89,000
🖨 Deal sheet 📄 Offer letter ✓ Due diligence
Listing remarks
Affordable living still exists! This move in ready home features cute exterior, 1 bedroom with a closet, but a few other rooms that could be optional bedrooms! The downstairs features a living room, dining room (optional bedroom with storage drawers), nice size kitchen with gas stove and stainless steel fridge! Primary bedroom, bathroom, extra storage room/office/craft area (whatever you want) & laundry area. Upstairs is two bonus rooms (optional bedrooms)! Located on a corner lot with a decent size yard. Backyard also has a storm cellar. This property will be sold "as is" condition!
Key facts
- Decent size yard
- Gas stove
- Move in ready
Tags
Property features AI
Finance
- Other: Below-ground storm shelter
- Financial info: Listing is offered in as-is condition; eligible for cash or conventional financing; Loan qualifying allowed
- HOA & community: No mandatory association dues
Exterior
- Parking: 1-car garage
- Security: No security features listed
- Utilities: Electricity available; Natural gas available; Public utilities
- Home design: Single family residence; One level; North-facing
- Construction: Asbestos and concrete construction materials; Composition roof (roof updated in 2006); Conventional foundation; Existing property
- Exterior features: Corner lot; No additional exterior features listed
Interior
- Kitchen: No kitchen appliance details provided
- Bedrooms: 1 bedroom
- Flooring: No flooring details provided
- Bathrooms: 1 full bathroom
- Heating & cooling: Floor furnace heating; Window unit cooling
- Interior features: No fireplace; No exterior interior features listed
- Laundry & utility: No laundry details provided
Neighborhood map
What this means for you Summary
Snapshot
- This is a 2-bed/1.0-bath single-family listed at $89k.
Deal economics
- At list price, monthly cash flow is $250 ($3k/yr) — positive.
- The deal already cash-flows at list — no discount required.
- Meets the 1% rule at list price ($976 rent vs $89k).
- Recommended offer: $86k (3.0% below list) — sets the bar for market timing.
Location & tenants
- Location reads 72/100 on livability (#25 in OK) — a middle-class / working-renter tenant base. Strengths: crime A+, cost of living A+, housing A+; Watch: amenities F, commute F, employment F.
- Hydro-Eakly (rural): math 43% / reading 41% proficiency, ranked #14 of 270 in OK (top 5%) — families likely to look elsewhere, expect single-tenant / working-renter base with shorter leases.
- Zoned schools: Hydro-Eakly Es (math 57% / reading 47%, grade C-, #34 of 845 statewide, top 5%, 254 students, 0% FRL); Hydro-Eakly Hs (math 44% / reading 34%, grade F, #37 of 447 statewide, top 9%, 135 students, 0% FRL) — zoned schools average 0% FRL vs 52% district-wide (52 pts lower); this property's tenant base skews higher-income than the district average.
- Market conditions: 19 active listings in the ZIP.
Forward outlook
- In year one you build about $2k of equity ($615 loan paydown + $1k appreciation (1.2% local appreciation)).
- Caddo County population projected to shrink 7% by 2050 — rents likely to lag national; underwrite the cash flow, not the appreciation.
- At projected returns (1.2% appreciation + 3.0% rent growth), your $25k cash investment doubles in ~5 years — after that, you're playing with house money.
Negotiation context
- It's been on market 37 days — a 3% lower offer ($86k) is reasonable based on typical stale-listing flexibility.
Risks & watch-outs
- Watch-outs: built in 1940 — expect roof / HVAC / electrical / plumbing capex.
- Climate carrying-cost: moderate wildfire risk; extreme-heat days projected 7→20/yr by 2055 (HVAC capex compounding) — expect insurance premiums to compound above CPI over the hold.
Questions for the listing agent
- It's been on market 37 days. Have you received any prior offers? Is the seller open to a 3% concession, seller financing, or rate buy-down credit?
- Built in 1940 — when were the roof, HVAC, electrical panel, plumbing, and water heater last replaced?
- Is there a deadline driving the sale (1031 exchange, divorce, estate, relocation)? That informs how much negotiation room exists.
- Schools are D-rated, which usually means shorter tenancies and higher turnover. Who's the typical renter profile here, and what's been the actual vacancy rate?
- What's the average days-on-market for RENTAL listings here right now (not sales)? A rising rental-DOM trend means longer vacancies and softer asking-rent achievability than the comps imply.
- What's the recent tenant-quality profile in this submarket — average credit score on applications, eviction rate, late-payment / NSF rate, and stable-employment percentage? A property-management company in the area should have these aggregated.
- How much new for-sale + rental construction is in the pipeline within 1–3 miles? Heavy new supply typically softens prices + rents 12–24 months out; constrained supply supports both.
Investment metrics
- 1% rule
- 1.10% ✓
- Cap rate
- 9.67%
- Cash-on-cash
- 12.05%
- DSCR
- 1.54
- GRM
- 7.6
CMA / ARV
- ARV (on-the-fly)
- $72,624
- Comps found
- 1
Show comp detail 1 sale within ~0.75 mi
| Address | Dist | Beds/Ba | Sqft | Sold | Price | $/sf | Match |
|---|---|---|---|---|---|---|---|
| 414 N Broadway Ave | 0.13mi | 1/1.0 (-1) | 919 (-14%) | 15mo | $62,500 | $68 | 53 |
Match score weights: distance 35% · size 25% · config 20% · recency 20%. Top-matched comps best support the ARV.
Projected returns pro-forma
1.18% appreciation · 3.0% rent growth · sell at horizon
- IRR
- 14.3%
- Equity multiple
- 1.74×
- Total profit
- $18,370
- Equity at exit
- $31,241
- IRR
- 17.6%
- Equity multiple
- 3.17×
- Total profit
- $54,063
- Equity at exit
- $42,187
Cash invested: $24,920 (down + closing). Projections, not guarantees.
Landlord ↔ Tenant lean methodology
- Overall (STATE)
- 83 Strongly Landlord-Friendly
- State Oklahoma
- 83 Strongly Landlord-Friendly · R+20
- County
- — inherits STATE
- City
- — inherits STATE
ZIP-level market 73048
- Home prices YoY
- 0.4%
- Active inventory
- 19
- Price-to-rent
- 7.6×
Monthly cashflow live
- Estimated rent
- $976 medium interval (Pro) →
- Mortgage (P&I)
- −$467
- Tax from tax record
- −$17 /mo · $204/yr
- Insurance
- −$37
- HOA
- −$0
- Vacancy / Maint / Mgmt
- −$205
- Net cashflow
- $250
Break-even live
UW: 25.0% down · 7.5% · 30yr · 1.5% tax · 5.0% vac · 8.0% maint · 8.0% mgmt
Financing live
Cash to close
- Down payment
- $22,250
- Closing costs
- $2,670
- Reserves months
- —
- Total cash needed
- —
Loan-product check · same deal, 3 products live
Conventional
25% down · 7.5% · 30yr
- Down + closing
- —
- Monthly P&I
- —
- Monthly cashflow
- —
- DSCR
- —
- Eligible?
- —
Personal DTI + credit; lowest rate.
DSCR
20% down · 8.5% · 30yr
- Down + closing
- —
- Monthly P&I
- —
- Monthly cashflow
- —
- DSCR
- —
- Eligible?
- —
No personal income docs; deal must DSCR.
Hard money
10% down · 12.0% · 12mo
- Down + closing
- —
- Monthly P&I
- —
- Monthly cashflow
- —
- DSCR
- —
- Eligible?
- —
Short-term bridge; refi at stabilization.
Listing history 16 events
-
2026-06-18days on market $89,000 Active 37 DOM
-
2026-06-17days on market $89,000 Active 36 DOM
-
2026-06-16days on market $89,000 Active 35 DOM
-
2026-06-15days on market $89,000 Active 34 DOM
-
2026-06-13days on market $89,000 Active 32 DOM
-
2026-06-12days on market $89,000 Active 31 DOM
-
2026-06-09days on market $89,000 Active 28 DOM
-
2026-06-08days on market $89,000 Active 27 DOM
-
2026-06-08days on market $89,000 Active 26 DOM
-
2026-06-05days on market $89,000 Active 24 DOM
-
2026-06-04days on market $89,000 Active 22 DOM
-
2026-06-03remarks 592-char remark
-
2026-06-02days on market $89,000 Active 21 DOM
-
2026-06-01days on market $89,000 Active 20 DOM
-
2026-05-31days on market $89,000 Active 19 DOM
-
2026-05-12$89,000 Active
ⓘ Source: listings_history table (triggers on properties + properties_extension) + one-shot
backfill from property_details.listing_events for pre-trigger history.
Tax reassessment forecast OK · Resets to sale price
- Current annual tax
- $204 · $17/mo
- Projected year-2 tax
- $801 · $67/mo
- Expected delta
- +$597/yr (+$50/mo · 292.6%)
ⓘ Screening estimate from a state-policy table — verify with the county assessor before closing.
Climate risk First Street
- Flood 1/10 Low FEMA zone X (unshaded) · 0% chance over 30 yrs
- Wildfire 5/10 Major
- Heat 6/10 Major 7 d/yr ≥107°F today · 20 d/yr by 30 yrs out
- Wind 2/10 Low 3% chance of damaging wind over 30 yrs
- Air quality 1/10 Low 0 unhealthy d/yr today · 0 by 30 yrs out
Nearby sold comps map
Loading sold comps map…
Walkable amenities ~0.75 mi
Loading nearby amenities…
Taxation est. · year 1
- Rental income
- $11,713
- − Mortgage interest
- −$4,985
- − Property taxes
- −$204
- − Insurance
- −$445
- − Repairs & maintenance
- −$937
- − Management
- −$937
- − Depreciation
- −$2,589
- Taxable income
- $1,616
- Est. tax owed @ 24.0%
- −$388
- After-tax cash flow
- $2,616/yr
For passive investors: Depreciation is non-cash, so a rental often shows a tax loss while cash-flowing — sheltering income. Rental losses are passive: they offset passive income freely, and up to $25,000/yr can offset ordinary (W-2) income if you actively participate and your MAGI is under $100k (phasing out to $0 by $150k); unused losses carry forward. On sale, claimed depreciation is recaptured at up to 25%, and gains may owe capital-gains tax (a 1031 exchange can defer both). Figures are a year-1 estimate at your 24.0% rate — not tax advice; consult a CPA.
Schools (NCES district)
- District
- Hydro-Eakly
- NCES district ID
- 4000032
- Math proficiency
- 43% ▼ -11.00%
- Reading proficiency
- 41% ▼ -6.00%
- Median HH income
- $42,179
- Composite
- 35.42/100
- National rank
- #4937
- State rank
- #14 of 270 in OK
Livability — Hydro
- Score
- 72/100
- State rank
- #25
- US rank
- #6136
Category grades
Schools grade is shown separately in the Schools card above.
Census & demographics
- Census place
- Hydro, OK
- Population (ZIP)
- 2,260
Population outlook (Caddo County) Hauer SSP2
- Today (2025)
- 28,391 people
- By 2030
- 27,844 · -1.9%
- By 2040
- 27,057 · -4.7%
- By 2050
- 26,484 · -6.7%
- By 2075
- 26,266 · -7.5%
- By 2100
- 26,077 · -8.2%
Race, ethnicity, and origin ACS 2023
- Neighborhood character
- Predominantly White (81%)
- Race & ethnicity
- White 81% Hispanic / Latino 9% Two or more races 8% Native American 4%
- Hispanic origin (detail)
- Mexican 7%
- Common ancestry
- Iranian 3% Serbian 2% Lithuanian 1%
- Foreign-born
- 5% · Canada
- Languages at home
- 93% English-only · Spanish 6% German/W. Germanic 1%
Political lean MEDSL · Caddo
- 2024 margin
- Solid R (+47.1) · D 25.4% · R 72.5% · Other 2.1%
- 2008→2024 swing
- -16.4pp toward R · 2008: -30.7pp · 2024: -47.1pp
- All cycles
- 2024: R+47.1 2020: R+44.0 2016: R+43.4 2012: R+28.5 2008: R+30.7
Not yet ingested
- Civics
- —
Market trends
- HPI YoY
- ▲ 1.18%
- Current HPI
- 275.5007
- Rent YoY
- —
- Metro
- —
- State GDP YoY
- ▲ 1.55%
- F500 in state
- 6
Industry mix (Fortune 500 HQ in OK)
| Industry | F500 HQs | Revenue |
|---|---|---|
| Energy | 3 | $48B |
|
||
Price history
1 event — show timeline
- 2026-05-12 Listed $89,000 MLSOK
Property tax history
+5.7%/yrLatest (2025): $204 · +7.9% YoY. Source: county tax records.
Cash-flow waterfall
monthlySold comps — $/sqft
last 12 mo · ≤1 miLoading sold comps…