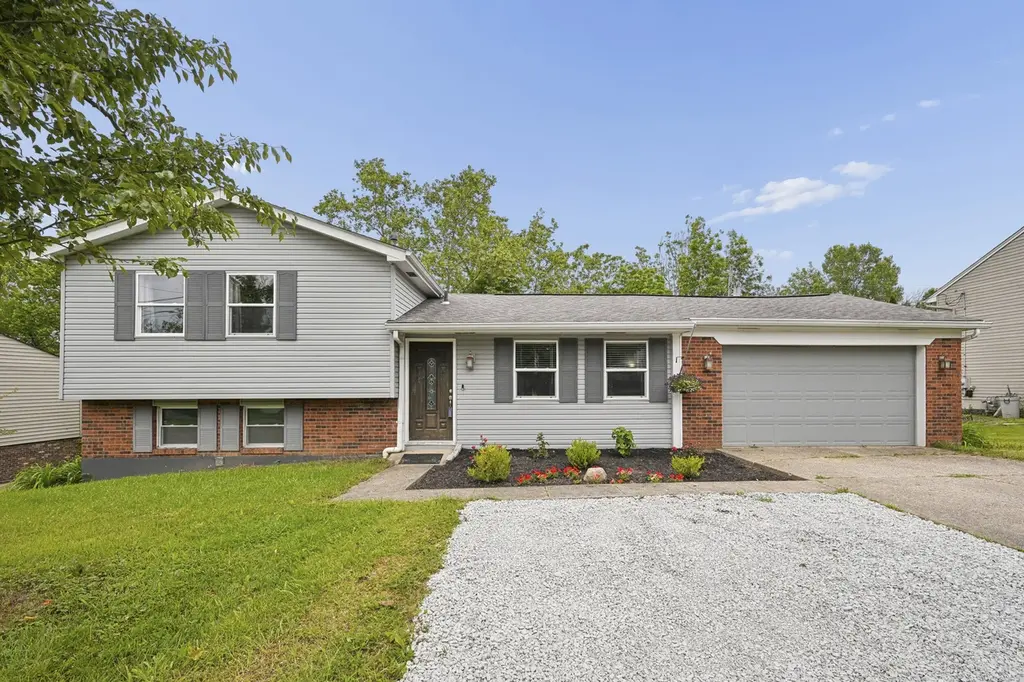
820 Cox Rd · Independence, KY
Flood risk 1/10 · Minimal
- FEMA flood zone
- X (unshaded)
- Chance of flooding over 30 yrs
- 0.0%
- Est. flood insurance / yr
- $507 – $1,088
Fire risk 2/10 · Minimal
- Est. fire insurance / yr
- $839 – $1,559
Heat risk 4/10 · Minor
- Hot days now (above 102°F)
- 7 days/yr
- Hot days in 30 yrs
- 19 days/yr
Wind risk 2/10 · Minimal
- Chance of severe wind over 30 yrs
- 1.0%
Air-quality risk 3/10 · Minor
- Unhealthy air days now
- 2 days/yr
- Unhealthy air days in 30 yrs
- 4 days/yr
Risk factors via First Street. Map © Google.
Why this score? — see what drove the D+ grade
The composite is a weighted blend of 9 inputs, each scored 0–100. Each bar is that input's sub-score; the figure is the points it added to the 100-point composite (weight × sub-score).
- Cash flow +16.1/30.0
- ARV discount +10.1/15.0
- DSCR +5.0/10.0
- Schools +4.0/10.0
- Rent growth +3.8/5.0
- 1% rule +3.7/10.0
- Livability +3.6/5.0
- Condition / age +2.5/5.0
- Appreciation +0.0/10.0
$265,000
🖨 Deal sheet 📄 Offer letter ✓ Due diligence
Listing remarks MLS
USDA Eligible Area/Private Wooded View/Hardwood Great Rm Opens To Granite Eat-In Kitchen/Stainless Steel Appliances/2 Full Baths/Finished Walkout LL Family Rm/Replacement Windows/Forget Crowded Communities!
Key facts
- Modern finishes
- Granite countertops
- 0.36 acre lot
Tags
Property features AI
Exterior
- Parking: Driveway; Garage with front-facing door; Garage door opener; 1-car garage
- Security: Smoke detectors
- Utilities: Public water; Public sewer; No additional utilities listed
- Home design: Single-family residence; Tri-level; Shingle roof; Built in 1983
- Construction: Brick and vinyl siding; Poured concrete foundation
- Exterior features: Patio; Wooded lot; Has a view
Interior
- Kitchen: Stainless steel appliances; Dishwasher; Microwave; Refrigerator
- Bedrooms: Primary bedroom (13 x 10); Bedroom 2 (10 x 10); Bedroom 3 (10 x 10)
- Bathrooms: 2 full bathrooms
- Heating & cooling: Heat pump and electric heating; Central air conditioning
- Interior features: High-speed internet available; Granite countertops; Eat-in kitchen; Attic storage; Ceiling fans
Neighborhood map
What this means for you Summary
Snapshot
- This is a 4-bed/2.0-bath single-family listed at $265k.
Deal economics
- At list price, monthly cash flow is $134 ($2k/yr) — positive.
- The deal already cash-flows at list — no discount required.
- To meet the 1% rule (rent ≥ 1% of price), the offer needs to be $231k (12.9% below list).
- Recommended offer: $231k (12.9% below list) — sets the bar for 1% rule.
- Cap rate 6.9% vs local median 3.7% in Independence — top-decile yield for the area; either an underpriced asset or a hidden risk that comps aren't pricing in. Stress-test before assuming the spread holds.
Location & tenants
- Location reads 72/100 on livability (#130 in KY) — a middle-class / working-renter tenant base. Strengths: crime A+, employment A+, cost of living A+; Watch: amenities F, commute F, health & safety F.
- Kenton County (suburban): math 42% / reading 48% proficiency, ranked #14 of 165 in KY (top 8%) — families likely to look elsewhere, expect single-tenant / working-renter base with shorter leases.
- Zoned schools: White'S Tower Elementary School (math 60% / reading 64%, grade B, #24 of 676 statewide, top 4%, 631 students, 41% FRL); Woodland Middle School (math 38% / reading 50%, grade D, #40 of 217 statewide, top 19%, 616 students, 48% FRL); Scott High School (math 33% / reading 33%, grade F, #94 of 254 statewide, top 37%, 1,071 students, 42% FRL).
- Market conditions: Rents rising fast (+5.4%/yr); 253 active listings in the ZIP; solid renter incomes; 699 units permitted in Kenton County in 2024 (287 in 5+ unit buildings).
Forward outlook
- Local home prices are declining (-3.0%/yr); year-one equity from $2k of loan paydown is wiped out by about $8k of value loss. Plan a longer hold.
- Kenton County population projected at +5% by 2050 — modest demand growth; plan on rents tracking national, not racing it.
Negotiation context
- It's been on market 16 days — a 2% lower offer ($261k) is reasonable based on typical stale-listing flexibility.
- 5 sale attempts since 17y ago with the ask held roughly flat each time — persistent listings suggest the price (not the market) is what's stuck; bring a comps-based counter.
- Current owner paid $150k; list at $265k implies a 77% gain — meaningful room to come down on a strong offer.
Questions for the listing agent
- Is there a deadline driving the sale (1031 exchange, divorce, estate, relocation)? That informs how much negotiation room exists.
- Schools are B-rated — typically a magnet for longer-tenancy family renters. What's the average tenant stay here, and is there a school-zone premium baked into asking?
- The area grade is low — what's the realistic commute time and amenity access for the typical tenant pool here? Any planned neighborhood developments (good or bad) we should know about?
- What's the average days-on-market for RENTAL listings here right now (not sales)? A rising rental-DOM trend means longer vacancies and softer asking-rent achievability than the comps imply.
- What's the recent tenant-quality profile in this submarket — average credit score on applications, eviction rate, late-payment / NSF rate, and stable-employment percentage? A property-management company in the area should have these aggregated.
- How much new for-sale + rental construction is in the pipeline within 1–3 miles? Heavy new supply typically softens prices + rents 12–24 months out; constrained supply supports both.
Investment metrics
- 1% rule
- 0.87% ✗
- Cap rate
- 6.90%
- Cash-on-cash
- 2.17%
- DSCR
- 1.10
- GRM
- 9.6
CMA / ARV
- ARV (on-the-fly)
- $281,078
- Comps found
- 12
Show comp detail 12 sales within ~0.75 mi
| Address | Dist | Beds/Ba | Sqft | Sold | Price | $/sf | Match |
|---|---|---|---|---|---|---|---|
| 4370 Oliver Rd | 0.20mi | 4/1.5 | 1,250 (+6%) | 2mo | $275,000 | $220 | 77 |
| 798 Cox Rd | 0.07mi | 3/1.5 (-1) | 1,097 (-7%) | 2mo | $278,995 | $254 | 76 |
| 764 Cox Rd | 0.21mi | 3/1.5 (-1) | 1,170 (-1%) | 8mo | $260,000 | $222 | 75 |
| 761 Cox Rd | 0.25mi | 3/1.0 (-1) | 1,215 (+3%) | 5mo | $205,000 | $169 | 70 |
| 4414 Mayflower Dr | 0.27mi | 3/1.0 (-1) | 1,274 (+8%) | 7mo | $152,000 | $119 | 60 |
| 756 Ridgepoint Dr | 0.34mi | 3/2.5 (-1) | 1,298 (+10%) | 4mo | $317,000 | $244 | 57 |
| 6382 Waterview Way | 0.54mi | 3/2.5 (-1) | 1,156 (-2%) | 11mo | $295,000 | $255 | 55 |
| 6508 Taylor Mill Rd | 0.66mi | 3/2.5 (-1) | 1,242 (+5%) | 0mo | $290,000 | $233 | 54 |
| 6416 Taylor Mill Rd | 0.57mi | 3/1.0 (-1) | 1,073 (-9%) | 0mo | $255,000 | $238 | 49 |
| 692 Sycamore Dr | 0.62mi | 3/1.0 (-1) | 1,288 (+9%) | 1mo | $275,000 | $214 | 46 |
| 712 Lakefield Dr | 0.71mi | 3/2.5 (-1) | 1,084 (-8%) | 1mo | $280,000 | $258 | 45 |
| 6680 Frontier Rd | 0.69mi | 3/2.0 (-1) | 1,066 (-10%) | 3mo | $282,650 | $265 | 44 |
Match score weights: distance 35% · size 25% · config 20% · recency 20%. Top-matched comps best support the ARV.
Projected returns pro-forma
-3.0% appreciation · 5.37% rent growth · sell at horizon
- IRR
- -10.4%
- Equity multiple
- 0.61×
- Total profit
- $-28,800
- Equity at exit
- $39,512
- IRR
- 1.7%
- Equity multiple
- 1.13×
- Total profit
- $10,011
- Equity at exit
- $22,912
Cash invested: $74,200 (down + closing). Projections, not guarantees.
Landlord ↔ Tenant lean methodology
- Overall (STATE)
- 83 Strongly Landlord-Friendly
- State Kentucky
- 83 Strongly Landlord-Friendly · R+16
- County
- — inherits STATE
- City
- — inherits STATE
ZIP-level market 41051
- Home prices YoY
- -32.6%
- Rents YoY
- 5.4%
- Active inventory
- 253
- Price-to-rent
- 9.6×
Monthly cashflow live
- Estimated rent
- $2,309 medium interval (Pro) →
- Mortgage (P&I)
- −$1,390
- Tax from tax record
- −$190 /mo · $2,279/yr
- Insurance
- −$110
- HOA
- −$0
- Vacancy / Maint / Mgmt
- −$485
- Net cashflow
- $134
Break-even live
UW: 25.0% down · 7.5% · 30yr · 1.5% tax · 5.0% vac · 8.0% maint · 8.0% mgmt
Financing live
Cash to close
- Down payment
- $66,250
- Closing costs
- $7,950
- Reserves months
- —
- Total cash needed
- —
Loan-product check · same deal, 3 products live
Conventional
25% down · 7.5% · 30yr
- Down + closing
- —
- Monthly P&I
- —
- Monthly cashflow
- —
- DSCR
- —
- Eligible?
- —
Personal DTI + credit; lowest rate.
DSCR
20% down · 8.5% · 30yr
- Down + closing
- —
- Monthly P&I
- —
- Monthly cashflow
- —
- DSCR
- —
- Eligible?
- —
No personal income docs; deal must DSCR.
Hard money
10% down · 12.0% · 12mo
- Down + closing
- —
- Monthly P&I
- —
- Monthly cashflow
- —
- DSCR
- —
- Eligible?
- —
Short-term bridge; refi at stabilization.
Listing history 10 events
-
2026-06-18days on market $265,000 Active 16 DOM
-
2026-06-17days on market $265,000 Active 15 DOM
-
2026-06-16days on market $265,000 Active 14 DOM
-
2026-06-15pricedays on market $265,000 Active 13 DOM
-
2026-06-13days on market $275,000 Active 11 DOM
-
2026-06-09days on market $275,000 Active 7 DOM
-
2026-06-08days on market $275,000 Active 6 DOM
-
2026-06-07days on market $275,000 Active 5 DOM
-
2026-06-02remarks 699-char remark
-
2026-06-02$275,000 Active 1 DOM
ⓘ Source: listings_history table (triggers on properties + properties_extension) + one-shot
backfill from property_details.listing_events for pre-trigger history.
Tax reassessment forecast KY · Resets to sale price
- Current annual tax
- $2,279 · $190/mo
- Projected year-2 tax
- $2,279 · $190/mo
- Expected delta
- $0/yr ($0/mo · 0.0%)
ⓘ Screening estimate from a state-policy table — verify with the county assessor before closing.
Climate risk First Street
- Flood 1/10 Low FEMA zone X (unshaded) · 0% chance over 30 yrs
- Wildfire 2/10 Low
- Heat 4/10 Moderate 7 d/yr ≥102°F today · 19 d/yr by 30 yrs out
- Wind 2/10 Low 100% chance of damaging wind over 30 yrs
- Air quality 3/10 Moderate 2 unhealthy d/yr today · 4 by 30 yrs out
Nearby sold comps map
Loading sold comps map…
Walkable amenities ~0.75 mi
Loading nearby amenities…
Taxation est. · year 1
- Rental income
- $27,712
- − Mortgage interest
- −$14,844
- − Property taxes
- −$2,279
- − Insurance
- −$1,325
- − Repairs & maintenance
- −$2,217
- − Management
- −$2,217
- − Depreciation
- −$7,709
- Taxable loss
- −$2,879
- Est. tax savings @ 24.0%
- +$691
- After-tax cash flow
- $2,303/yr
For passive investors: Depreciation is non-cash, so a rental often shows a tax loss while cash-flowing — sheltering income. Rental losses are passive: they offset passive income freely, and up to $25,000/yr can offset ordinary (W-2) income if you actively participate and your MAGI is under $100k (phasing out to $0 by $150k); unused losses carry forward. On sale, claimed depreciation is recaptured at up to 25%, and gains may owe capital-gains tax (a 1031 exchange can defer both). Figures are a year-1 estimate at your 24.0% rate — not tax advice; consult a CPA.
Schools (NCES district)
- District
- Kenton County
- NCES district ID
- 2103090
- Math proficiency
- 42% ▼ -13.00%
- Reading proficiency
- 48% ▼ -14.00%
- Median HH income
- $66,183
- Composite
- 40.17/100
- National rank
- #3789
- State rank
- #14 of 165 in KY
Livability — Independence
- Score
- 72/100
- State rank
- #130
- US rank
- #6165
Category grades
Schools grade is shown separately in the Schools card above.
Census & demographics
- Census place
- Independence, KY
- County
- Kenton County · 142,881 people
- City population
- 33,054
- Metro
- Cincinnati, OH-KY-IN
- Population (ZIP)
- 33,054
- Household income
- $104,201
- Rent vs Own
- Severe rent burden
- 243.0
Population outlook (Kenton County) Hauer SSP2
- Today (2025)
- 174,205 people
- By 2030
- 177,897 · +2.1%
- By 2040
- 182,671 · +4.9%
- By 2050
- 183,543 · +5.4%
- By 2075
- 178,977 · +2.7%
- By 2100
- 159,920 · -8.2%
Race, ethnicity, and origin ACS 2023
- Neighborhood character
- Predominantly White (93%)
- Race & ethnicity
- White 93% Two or more races 3% Hispanic / Latino 2% Black 1% Asian 1%
- Common ancestry
- Italian 3% Lithuanian 3% Slovak 2%
- Foreign-born
- 3% · China, Canada
- Languages at home
- 96% English-only · Spanish 1% Chinese 1% Other Asian/Pacific 1%
Political lean MEDSL · Kenton
- 2024 margin
- Strong R (+21.7) · D 38.2% · R 59.9% · Other 1.9%
- 2008→2024 swing
- -0.9pp no change · 2008: -20.9pp · 2024: -21.7pp
- All cycles
- 2024: R+21.7 2020: R+19.3 2016: R+26.1 2012: R+24.3 2008: R+20.9
Not yet ingested
- Civics
- —
Market trends
- HPI YoY
- ▼ -105.60%
- Current HPI
- 218.492
- Rent YoY
- ▲ 5.37%
- Metro
- Cincinnati, OH-KY-IN
- State GDP YoY
- ▲ 1.81%
- F500 in state
- 4
Industry mix (Fortune 500 HQ in KY)
| Industry | F500 HQs | Revenue |
|---|---|---|
| Healthcare | 1 | $118B |
|
||
| Food / Beverage | 1 | $7B |
|
||
Price history
+273.1% since first listed17 events — show timeline
- 2026-06-02 Listed $275,000 NKMLS
- 2020-03-25 Sold (Public Records) $150,000 Public Records
- 2020-03-20 Sold (MLS) $150,000 NKMLS
- 2020-01-27 Pending — NKMLS
- 2020-01-21 Price Changed $150,000 NKMLS
- 2020-01-09 Price Changed $154,500 NKMLS
- 2019-12-21 Price Changed $159,500 NKMLS
- 2019-11-23 Listed $165,000 NKMLS
- 2014-11-24 Sold (Public Records) $119,900 Public Records
- 2014-11-21 Sold (MLS) $119,900 NKMLS
- 2014-08-21 Listed $119,900 NKMLS
- 2014-07-16 Sold (Public Records) $58,000 Public Records
- 2014-07-11 Sold (MLS) $58,000 NKMLS
- 2014-02-28 Listed $70,000 NKMLS
- 2010-06-30 Listing Removed — NKMLS
- 2009-10-25 Listed $129,500 NKMLS
- 1998-11-23 Sold (Public Records) $73,700 Public Records
Property tax history
+11.0%/yrLatest (2025): $2,279 · +21.8% YoY. Source: county tax records.
Cash-flow waterfall
monthlySold comps — $/sqft
last 12 mo · ≤1 miLoading sold comps…