303 E 57th St Unit 9E · New York, NY
Flood risk 1/10 · Minimal
- FEMA flood zone
- X (unshaded)
- Chance of flooding over 30 yrs
- 0.0%
- Est. flood insurance / yr
- $507 – $1,088
Fire risk 1/10 · Minimal
- Est. fire insurance / yr
- $691 – $1,283
Heat risk 6/10 · Moderate
- Hot days now (above 99°F)
- 7 days/yr
- Hot days in 30 yrs
- 15 days/yr
Wind risk 6/10 · Moderate
- Chance of severe wind over 30 yrs
- 27.0%
Air-quality risk 4/10 · Minor
- Unhealthy air days now
- 5 days/yr
- Unhealthy air days in 30 yrs
- 6 days/yr
Risk factors via First Street. Map © Google.
Why this score? — see what drove the D grade
The composite is a weighted blend of 9 inputs, each scored 0–100. Each bar is that input's sub-score; the figure is the points it added to the 100-point composite (weight × sub-score).
- 1% rule +10.0/10.0
- ARV discount +7.5/15.0
- Appreciation +7.5/10.0
- Schools +5.0/10.0
- Rent growth +4.7/5.0
- Livability +3.8/5.0
- Condition / age +2.5/5.0
- Cash flow +0.5/30.0
- DSCR +0.0/10.0
$325,000
🖨 Deal sheet 📄 Offer letter ✓ Due diligence
Listing remarks
The Excelsior was built for people who refused to choose. Convertible two-bedroom, one-and-a-half-bath apartment. Property features unmatched skyline views, 24 Hour White-glove service concierge and doorman that provide exceptional above and beyond service. In unit Washer and dryer. Private balcony with ample space and views you have to see for youself. Inside: an open living and dining area with a serving hatch to the kitchen (so the cook is never the one missing the conversation), a powder room that keeps the bedroom the bedroom, in-unit washer and dryer, an oversized bedroom with big windows and the closet space you so need. The building features a well equipped fitness center, secure
Key facts
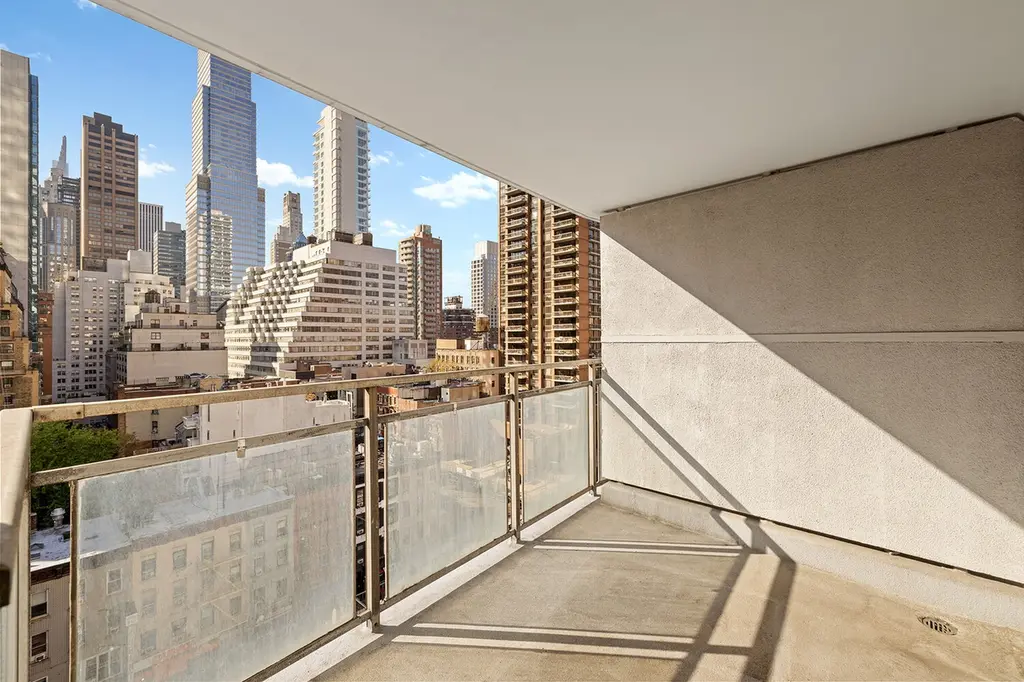
- Skyline views
- Private balcony
- Landscaped gardens
Tags
Property features AI
Finance
- Other: Building allows pets (up to 15 lbs upon approval)
- Financial info: Has land lease (expires 2097-01-01)
- HOA & community: Monthly association fee; Association fee includes building amenities (sauna, pool, spa)
Exterior
- Parking: Has garage
- Security: Concierge
- Home design: Condo in a high-rise building (The Excelsior); Entry on 9th level; 47-story building
- Construction: Elevator served building; Indoor pool; Sauna; Spa/Hot Tub; Bike storage
- Exterior features: Building roof deck; Private outdoor space (terrace) larger than 60 sq ft; West exposure; Has view
Interior
- Kitchen: Dishwasher
- Bedrooms: Total of 4 rooms (bedrooms/other rooms included)
- Bathrooms: 1 full bathroom; 1 half bathroom
- Interior features: Storage; Building other basement
- Laundry & utility: Washer hookup; In-unit laundry possible; Building laundry options
Neighborhood map
What this means for you Summary
Snapshot
- This is a 1-bed/1.5-bath condo listed at $325k.
Deal economics
- At list price, monthly cash flow is $-1k ($-17k/yr) — negative.
- To cash-flow at today's rent, offer at most $120k (63.0% below list).
- Meets the 1% rule at list price ($6k rent vs $325k).
- Recommended offer: $120k (63.0% below list) — sets the bar for cash-flow.
- Cap rate 1.1% vs local median 2.6% in New York — below-typical yield; the buyer is paying a premium for something (appreciation thesis, condition, location) that the cap rate doesn't capture.
Location & tenants
- Location reads 75/100 on livability (#268 in NY, #4,188 nationally) — a middle-class / working-renter tenant base. Strengths: amenities A+, commute A+, health & safety A; Watch: crime F, cost of living F.
- Market conditions: Rents rising fast (+8.7%/yr); 715 active listings in the ZIP; 40 comparable units currently listed for rent nearby; rentals at typical pace (median 15d on market — plan ~3-4 weeks tenant-placement turnaround); high-income renter base; 4,467 units permitted in New York County in 2024 (4,463 in 5+ unit buildings).
- This rent runs 43% of the median local income ($172k/yr) — at the standard rent-burdened threshold; future hikes will face affordability resistance.
Forward outlook
- In year one you build about $18k of equity ($2k loan paydown + $16k appreciation (5.0% local appreciation)).
- New York County population projected at +21% by 2050 — long-run rental-demand tailwind backs the buy-and-hold thesis.
- By year 3, paydown + projected appreciation supports a ~$45k cash-out refi (75% LTV) — recoverable capital for the next deal without selling this one.
Negotiation context
- It's been on market 35 days — a 3% lower offer ($315k) is reasonable based on typical stale-listing flexibility.
- 2 sale attempts with the ask held roughly flat each time — persistent listings suggest the price (not the market) is what's stuck; bring a comps-based counter.
Risks & watch-outs
- Watch-outs: HOA is 66% of rent.
- Climate carrying-cost: major wind risk, 27% chance of damaging wind over 30y; extreme-heat days projected 7→15/yr by 2055 (HVAC capex compounding) — expect insurance premiums to compound above CPI over the hold.
Questions for the listing agent
- What do current leases actually rent for vs. the listed asking? Can we see a recent rent roll and the last 12 months of T-12 income?
- It's been on market 35 days. Have you received any prior offers? Is the seller open to a 63% concession, seller financing, or rate buy-down credit?
- Built in 1968 — when were the roof, HVAC, electrical panel, plumbing, and water heater last replaced?
- What does the HOA fee cover, when was the last increase, and are there any pending special assessments or reserve-fund shortfalls?
- Any open or pending special assessments — roof, HVAC, plumbing, elevator, façade? What's the per-unit balance and payoff schedule, and is the seller paying it off at close or rolling it to the buyer?
- Is there a deadline driving the sale (1031 exchange, divorce, estate, relocation)? That informs how much negotiation room exists.
- Schools are B-rated — typically a magnet for longer-tenancy family renters. What's the average tenant stay here, and is there a school-zone premium baked into asking?
- Crime grade is F in this area — have there been break-ins, vandalism, or insurance claims at this property in the last 3 years? What carrier currently insures it and at what premium?
- The area grade is low — what's the realistic commute time and amenity access for the typical tenant pool here? Any planned neighborhood developments (good or bad) we should know about?
- What's the average days-on-market for RENTAL listings here right now (not sales)? A rising rental-DOM trend means longer vacancies and softer asking-rent achievability than the comps imply.
- What's the recent tenant-quality profile in this submarket — average credit score on applications, eviction rate, late-payment / NSF rate, and stable-employment percentage? A property-management company in the area should have these aggregated.
- How much new apartment / multifamily construction is in the pipeline within 1–3 miles? Heavy new supply (>2% of stock underway) typically softens rents 12–24 months out; light construction supports rent growth.
Investment metrics
- 1% rule
- 1.91% ✓
- Cap rate
- 1.07%
- Cash-on-cash
- -18.67%
- DSCR
- 0.17
- GRM
- 4.4
CMA / ARV
No comps found within radius.
Projected returns pro-forma
4.97% appreciation · 8.0% rent growth · sell at horizon
- IRR
- 3.1%
- Equity multiple
- 1.21×
- Total profit
- $19,459
- Equity at exit
- $183,524
- IRR
- 11.1%
- Equity multiple
- 3.42×
- Total profit
- $220,637
- Equity at exit
- $316,202
Cash invested: $91,000 (down + closing). Projections, not guarantees.
Landlord ↔ Tenant lean methodology
- Overall (CITY)
- 0 Strongly Tenant-Friendly
- State New York
- 15 Strongly Tenant-Friendly · D+10
- County
- — inherits STATE
- City New York
- 0 Strongly Tenant-Friendly · D+34
ZIP-level market 10022
- Home prices YoY
- 2.4%
- Rents YoY
- 8.7%
- Active inventory
- 715
- Price-to-rent
- 4.4×
Monthly cashflow live
- Estimated rent
- $6,195 high interval (Pro) →
- Mortgage (P&I)
- −$1,704
- Tax est. 1.5%
- −$406 /mo · $4,875/yr
- Insurance
- −$135
- HOA
- −$4,064
- Vacancy / Maint / Mgmt
- −$1,301
- Net cashflow
- $-1,416
Break-even live
UW: 25.0% down · 7.5% · 30yr · 1.5% tax · 5.0% vac · 8.0% maint · 8.0% mgmt
Financing live
Cash to close
- Down payment
- $81,250
- Closing costs
- $9,750
- Reserves months
- —
- Total cash needed
- —
Loan-product check · same deal, 3 products live
Conventional
25% down · 7.5% · 30yr
- Down + closing
- —
- Monthly P&I
- —
- Monthly cashflow
- —
- DSCR
- —
- Eligible?
- —
Personal DTI + credit; lowest rate.
DSCR
20% down · 8.5% · 30yr
- Down + closing
- —
- Monthly P&I
- —
- Monthly cashflow
- —
- DSCR
- —
- Eligible?
- —
No personal income docs; deal must DSCR.
Hard money
10% down · 12.0% · 12mo
- Down + closing
- —
- Monthly P&I
- —
- Monthly cashflow
- —
- DSCR
- —
- Eligible?
- —
Short-term bridge; refi at stabilization.
Rent comps 40 comps
| Address | Beds | Baths | Sqft | Rent | $/sqft | DOM | Units | Dist |
|---|---|---|---|---|---|---|---|---|
| 227 E 57th St Unit 14C New York, NY | 1.0 | 1.0 | 780 | $4,750 | $6.09 | 24d | 1 | 0.06mi |
| 300 E 57th St #1714 New York, NY | 1.0 | 1.0 | 820 | $5,800 | $7.07 | 20d | 1 | 0.07mi |
| 252 E 61st St #638 New York, NY | 1.0 | 1.0 | 666 | $5,530 | $8.30 | 1d | 2 | 0.14mi |
| 400 E 57th St #2106 New York, NY | 2.0 | 1.0–2.0 | 903 | $6,610 | $7.32 | 3d | 3 | 0.18mi |
| 400 E 57th St New York, NY | 1.0–2.0 | 1.0–2.0 | 1436 | $4,950 | $3.45 | 24d | 3 | 0.18mi |
| 150 E 57th St New York, NY | 5.0 | 1.0–7.5 | 2750 | $10,504 | $3.82 | 1d | 5 | 0.19mi |
| 220 E 63rd St #567 New York, NY | 1.0 | 1.0 | 800 | $6,460 | $8.07 | 20d | 1 | 0.24mi |
| 250 E 53rd St #403 New York, NY | 1.0 | 1.0 | 823 | $5,850 | $7.11 | 24d | 1 | 0.26mi |
| 301 E 63rd St New York, NY | 2.0 | 1.0 | 975 | $6,650 | $6.82 | 4d | 1 | 0.26mi |
| 412 E 55th St New York, NY | 1.0 | 1.0 | 767 | $5,250 | $6.84 | 24d | 1 | 0.26mi |
| 117 E 57th St New York, NY | 1.0 | 1.0 | 732 | $5,975 | $8.16 | 4d | 2 | 0.27mi |
| 225 E 63rd St #1675 New York, NY | 1.0 | 1.0 | 627 | $5,230 | $8.34 | 24d | 2 | 0.27mi |
| 959 1st Ave Unit 6X New York, NY | 1.0 | 1.0 | 739 | $6,000 | $8.12 | 24d | 1 | 0.30mi |
| 420 E 54th St New York, NY | 3.0 | 1.0–2.5 | 1104 | $7,261 | $6.57 | 1d | 14 | 0.31mi |
| 220 E 65th St New York, NY | 1.0 | 1.0 | 700 | $5,950 | $8.50 | 2d | 1 | 0.32mi |
| 304 E 65th St Unit 11C New York, NY | 1.0 | 1.0 | 770 | $5,450 | $7.08 | 15d | 1 | 0.34mi |
| 323 E 51st St Unit 1024750P New York, NY | 2.0–4.0 | 2.0–3.5 | 2093 | $21,945 | $10.48 | 7d | 2 | 0.34mi |
| 300 E 51st St New York, NY | 2.0 | 1.0–2.0 | 875 | $6,365 | $7.27 | 2d | 3 | 0.36mi |
| 360 E 65th St #1283 New York, NY | 1.0–3.0 | 1.0–2.0 | 1059 | $4,840 | $4.57 | 3d | 3 | 0.37mi |
| 340 E 51st St New York, NY | 2.0 | 1.0–2.0 | 791 | $6,250 | $7.90 | 3d | 3 | 0.37mi |
| 40-44 E 61st St Unit 15B New York, NY | 2.0 | 2.0 | 1200 | $15,000 | $12.50 | 14d | 1 | 0.39mi |
| 400 E 66th St Unit 1016404P New York, NY | 1.0–2.0 | 1.0–2.0 | 791 | $10,597 | $13.40 | 3d | 2 | 0.42mi |
| 138 E 50th St New York, NY | 2.0 | 2.0–2.5 | 1432 | $13,650 | $9.53 | 24d | 1 | 0.45mi |
| 250 E 49th St Unit 4A New York, NY | 1.0 | 1.0 | 802 | $6,400 | $7.98 | 24d | 1 | 0.45mi |
| 220 E 49th St Unit 1021974P New York, NY | 2.0 | 1.0 | 742 | $5,190 | $6.99 | 14d | 1 | 0.47mi |
| 303 Park Ave #2321 New York, NY | 1.0 | 1.5 | 808 | $14,500 | $17.95 | 7d | 1 | 0.52mi |
| 303 Park Ave #2203 New York, NY | 1.0 | 1.5 | 796 | $13,500 | $16.96 | 7d | 1 | 0.52mi |
| 160 E 48th St New York, NY | 3.0 | 1.0–2.0 | 878 | $6,993 | $7.96 | 3d | 9 | 0.53mi |
| 1310 2nd Ave Unit 1224958P New York, NY | 1.0–2.0 | 1.0 | 699 | $5,450 | $7.80 | 1d | 2 | 0.54mi |
| 300 E 69th St Unit 1294661P New York, NY | 2.0 | 1.0 | 839 | $6,870 | $8.19 | 19d | 1 | 0.54mi |
| 885 Main St #705 New York, NY | 2.0 | 2.0 | 1100 | $4,950 | $4.50 | 24d | 1 | 0.55mi |
| 885 Main St Unit 6B New York, NY | 2.0 | 2.0 | 950 | $5,320 | $5.60 | 12d | 1 | 0.55mi |
| 411 E 68th St Unit 1021976P New York, NY | 2.0 | 1.0 | 893 | $6,792 | $7.61 | 22d | 1 | 0.55mi |
| 135 E 47th St Unit 22F New York, NY | 1.0 | 1.0 | 700 | $7,500 | $10.71 | 22d | 1 | 0.57mi |
| 15 W 55th St #736 New York, NY | 2.0–3.0 | 1.0–2.0 | 1250 | $8,550 | $6.84 | 1d | 2 | 0.58mi |
| 1290 1st Ave #1499 New York, NY | 2.0 | 1.0 | 671 | $6,100 | $9.09 | 2d | 2 | 0.59mi |
| 403 E 69th St #1518 New York, NY | 1.0–3.0 | 1.0 | 745 | $3,990 | $5.36 | 24d | 3 | 0.59mi |
| 300 E 46th St New York, NY | 2.0–3.0 | 1.0 | 716 | $4,300 | $6.00 | 24d | 2 | 0.61mi |
| 40 W 55th St Unit 5D New York, NY | 2.0 | 2.5 | 1070 | $6,500 | $6.07 | 24d | 1 | 0.63mi |
| 55 W 55th St Unit 9AA New York, NY | 2.0 | 1.5 | 1000 | $6,000 | $6.00 | 19d | 1 | 0.65mi |
HOA detail condo
- Monthly dues
- $4,064 · $48,768/yr
- Likely covers
- trashgymdoorman
- Assessments
- None detected in remarks — confirm with the listing agent.
Listing history 15 events
-
2026-06-18days on market $325,000 Active 35 DOM
-
2026-06-17days on market $325,000 Active 34 DOM
-
2026-06-16days on market $325,000 Active 33 DOM
-
2026-06-15days on market $325,000 Active 32 DOM
-
2026-06-13days on market $325,000 Active 30 DOM
-
2026-06-10days on market $325,000 Active 26 DOM
-
2026-06-08days on market $325,000 Active 25 DOM
-
2026-06-08days on market $325,000 Active 24 DOM
-
2026-06-04days on market $325,000 Active 21 DOM
-
2026-06-03days on market $325,000 Active 20 DOM
-
2026-06-02days on market $325,000 Active 19 DOM
-
2026-06-01days on market $325,000 Active 18 DOM
-
2026-05-31days on market $325,000 Active 17 DOM
-
2026-05-14$325,000 Active
-
2026-05-14$325,000 Active
ⓘ Source: listings_history table (triggers on properties + properties_extension) + one-shot
backfill from property_details.listing_events for pre-trigger history.
Climate risk First Street
- Flood 1/10 Low FEMA zone X (unshaded) · 0% chance over 30 yrs
- Wildfire 1/10 Low
- Heat 6/10 Major 7 d/yr ≥99°F today · 15 d/yr by 30 yrs out
- Wind 6/10 Major 27% chance of damaging wind over 30 yrs
- Air quality 4/10 Moderate 5 unhealthy d/yr today · 6 by 30 yrs out
Nearby sold comps map
Loading sold comps map…
Walkable amenities ~0.75 mi
Loading nearby amenities…
Taxation est. · year 1
- Rental income
- $74,343
- − Mortgage interest
- −$18,205
- − Property taxes
- −$4,875
- − Insurance
- −$1,625
- − Repairs & maintenance
- −$5,947
- − Management
- −$5,947
- − HOA
- −$48,768
- − Depreciation
- −$9,455
- Taxable loss
- −$20,479
- Est. tax savings @ 24.0%
- +$4,915
- After-tax cash flow
- $-12,074/yr
For passive investors: Depreciation is non-cash, so a rental often shows a tax loss while cash-flowing — sheltering income. Rental losses are passive: they offset passive income freely, and up to $25,000/yr can offset ordinary (W-2) income if you actively participate and your MAGI is under $100k (phasing out to $0 by $150k); unused losses carry forward. On sale, claimed depreciation is recaptured at up to 25%, and gains may owe capital-gains tax (a 1031 exchange can defer both). Figures are a year-1 estimate at your 24.0% rate — not tax advice; consult a CPA.
Schools (NCES district)
No district data.
Livability — New York
- Score
- 75/100
- State rank
- #268
- US rank
- #4188
Category grades
Schools grade is shown separately in the Schools card above.
Census & demographics
- Census place
- New York, NY
- County
- New York County · 1,599,927 people
- City population
- 7,731,280
- Metro
- New York-Newark-Jersey City, NY-NJ-PA
- Population (ZIP)
- 34,049
- Household income
- $172,026
- Rent vs Own
- Severe rent burden
- 2256.0
Population outlook (New York County) Hauer SSP2
- Today (2025)
- 1,825,725 people
- By 2030
- 1,904,611 · +4.3%
- By 2040
- 2,052,719 · +12.4%
- By 2050
- 2,206,601 · +20.9%
- By 2075
- 2,509,427 · +37.4%
- By 2100
- 2,702,933 · +48.0%
Race, ethnicity, and origin ACS 2023
- Neighborhood character
- Predominantly White (73%)
- Race & ethnicity
- White 73% Asian 12% Hispanic / Latino 8% Two or more races 7% Black 2%
- Hispanic origin (detail)
- Mexican 1% Puerto Rican 1% Dominican 1%
- Common ancestry
- Romanian 5% Scotch-Irish 5% Lithuanian 2%
- Foreign-born
- 24% · Canada, China, South Korea
- Languages at home
- 75% English-only · Spanish 6% Other Indo-European 6% Chinese 3%
Political lean MEDSL · New York
- 2024 margin
- Solid D (+64.8) · D 82.4% · R 17.6%
- 2008→2024 swing
- -7.4pp toward R · 2008: 72.2pp · 2024: 64.8pp
- All cycles
- 2024: D+64.8 2020: D+74.5 2016: D+77.2 2012: D+69.6 2008: D+72.2
Not yet ingested
- Civics
- —
Market trends
- HPI YoY
- ▲ 4.97%
- Current HPI
- 215.7225
- Rent YoY
- ▲ 8.69%
- Metro
- New York-Newark-Jersey City, NY-NJ-PA
- State GDP YoY
- ▲ 2.60%
- F500 in state
- 92
Industry mix (Fortune 500 HQ in NY)
| Industry | F500 HQs | Revenue |
|---|---|---|
| Financial Services | 10 | $950B |
|
||
| Consumer Goods | 9 | $162B |
|
||
| Insurance | 4 | $225B |
|
||
| Telecommunications | 2 | $144B |
|
||
| Pharmaceuticals | 2 | $112B |
|
||
| Media / Entertainment | 2 | $69B |
|
||
Price history
+0.0% since first listed2 events — show timeline
- 2026-05-14 Listed $325,000 OneKey® MLS as Distributed by MLS Grid
- 2026-05-14 Listed $325,000 RLS at REBNY
Cash-flow waterfall
monthlySold comps — $/sqft
last 12 mo · ≤1 miLoading sold comps…