1203 Pineland Ave · Venice, FL
Flood risk 6/10 · Moderate
- FEMA flood zone
- AE
- Chance of flooding over 30 yrs
- 0.57%
- Est. flood insurance / yr
- $1,737 – $8,500
Fire risk 1/10 · Minimal
- Est. fire insurance / yr
- $947 – $1,759
Heat risk 10/10 · Severe
- Hot days now (above 107°F)
- 7 days/yr
- Hot days in 30 yrs
- 29 days/yr
Wind risk 10/10 · Severe
- Chance of severe wind over 30 yrs
- 99.0%
Air-quality risk 2/10 · Minimal
- Unhealthy air days now
- 1 days/yr
- Unhealthy air days in 30 yrs
- 1 days/yr
Risk factors via First Street. Map © Google.
Why this score? — see what drove the C- grade
The composite is a weighted blend of 9 inputs, each scored 0–100. Each bar is that input's sub-score; the figure is the points it added to the 100-point composite (weight × sub-score).
- Cash flow +20.0/30.0
- ARV discount +7.5/15.0
- DSCR +6.3/10.0
- Schools +5.4/10.0
- Rent growth +4.7/5.0
- 1% rule +4.5/10.0
- Livability +4.0/5.0
- Condition / age +2.5/5.0
- Appreciation +0.0/10.0
$240,000
🖨 Deal sheet (PDF) 📄 Offer letter ✓ Due diligence
Listing remarks MLS
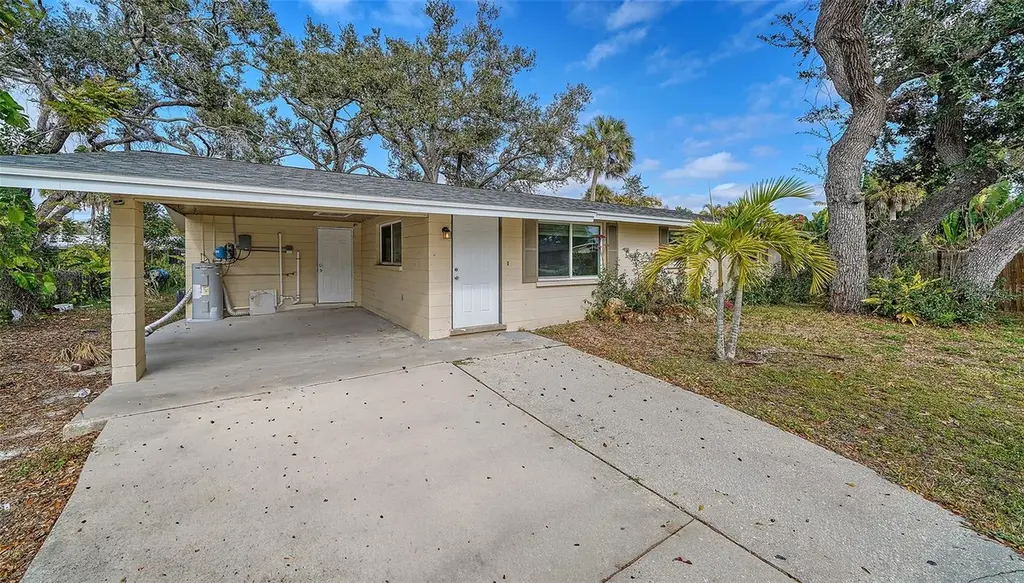
Big improvements are already done - now it’s your turn to add the finishing touch. Explore the possibilities! With a new roof, new windows, new septic, new kitchen, new bathrooms, newer A/C, and newer water heater, this work in progress offers a rare chance to step into value and make it your own.
Key facts
- New appliances
- New bathrooms
- Crown molding
Tags
Neighborhood map
What this means for you Summary
Snapshot
- This is a 3-bed/2.0-bath single-family listed at $240k.
Deal economics
- At list price, monthly cash flow is $-131 ($-2k/yr) — negative.
- To cash-flow at today's rent, offer at most $217k (9.7% below list).
- To meet the 1% rule (rent ≥ 1% of price), the offer needs to be $228k (5.1% below list).
- Recommended offer: $217k (9.7% below list) — sets the bar for cash-flow.
Location & tenants
- Location reads 80/100 on livability (#129 in FL, #1,925 nationally) — a professional / high-income tenant draw. Strengths: crime A+, housing A+, health & safety A+; Watch: amenities D-, commute F.
- Sarasota (urban): math 63% / reading 63% proficiency, ranked #7 of 73 in FL (top 10%) — acceptable for families but not a draw, mixed tenant base, ~2y average lease.
- Zoned schools: Garden Elementary School (math 71% / reading 69%, grade A-, #345 of 2,144 statewide, top 17%, 513 students, 52% FRL); Venice Middle School (math 71% / reading 58%, grade A-, #100 of 571 statewide, top 18%, 761 students, 37% FRL); Venice Senior High School (math 67% / reading 61%, grade B-, #86 of 667 statewide, top 13%, 2,584 students, 31% FRL) — zoned schools at 40% FRL track the district average.
- Market conditions: Rents rising fast (+8.8%/yr); 468 active listings in the ZIP; 7,466 units permitted in Sarasota County in 2024 (2,138 in 5+ unit buildings).
- This rent runs 40% of the median local income ($68k/yr) — at the standard rent-burdened threshold; future hikes will face affordability resistance.
Forward outlook
- Local home prices are declining (-3.0%/yr); year-one equity from $2k of loan paydown is wiped out by about $7k of value loss. Plan a longer hold.
- Sarasota County population projected at +20% by 2050 — long-run rental-demand tailwind backs the buy-and-hold thesis.
Negotiation context
- It's been on market 110 days — a 9% lower offer ($218k) is reasonable based on typical stale-listing flexibility.
- Current owner paid $180k; 33% above their basis — modest negotiation headroom, anchor on the comps not their cost.
Risks & watch-outs
- Watch-outs: flood insurance adds $427/mo.
- Climate carrying-cost: in FEMA flood zone AE (mandatory federal flood insurance); severe wind risk, 99% chance of damaging wind over 30y; extreme-heat days projected 7→29/yr by 2055 (HVAC capex compounding) — expect insurance premiums to compound above CPI over the hold.
Questions for the listing agent
- What do current leases actually rent for vs. the listed asking? Can we see a recent rent roll and the last 12 months of T-12 income?
- It's been on market 110 days. Have you received any prior offers? Is the seller open to a 10% concession, seller financing, or rate buy-down credit?
- Built in 1972 — when were the roof, HVAC, electrical panel, plumbing, and water heater last replaced?
- What's the actual annual flood-insurance premium (NFIP or private), and is the property in a SFHA with mandatory coverage?
- Why hasn't it sold? Are there any deal-killer items the seller is aware of (foundation, flood, title, zoning, code violations)?
- Is there a deadline driving the sale (1031 exchange, divorce, estate, relocation)? That informs how much negotiation room exists.
- Schools are A-rated — typically a magnet for longer-tenancy family renters. What's the average tenant stay here, and is there a school-zone premium baked into asking?
- What's the average days-on-market for RENTAL listings here right now (not sales)? A rising rental-DOM trend means longer vacancies and softer asking-rent achievability than the comps imply.
- What's the recent tenant-quality profile in this submarket — average credit score on applications, eviction rate, late-payment / NSF rate, and stable-employment percentage? A property-management company in the area should have these aggregated.
- How much new for-sale + rental construction is in the pipeline within 1–3 miles? Heavy new supply typically softens prices + rents 12–24 months out; constrained supply supports both.
Investment metrics
- 1% rule
- 0.95% ✗
- Cap rate
- 7.77%
- Cash-on-cash
- 5.27%
- DSCR
- 1.23
- GRM
- 8.8
CMA / ARV
No comps found within radius.
Projected returns pro-forma
-3.0% appreciation · 8.0% rent growth · sell at horizon
- IRR
- -13.8%
- Equity multiple
- 0.48×
- Total profit
- $-35,013
- Equity at exit
- $35,785
- IRR
- 2.4%
- Equity multiple
- 1.21×
- Total profit
- $14,363
- Equity at exit
- $20,751
Cash invested: $67,200 (down + closing). Projections, not guarantees.
Landlord ↔ Tenant lean methodology
- Overall (STATE)
- 87 Strongly Landlord-Friendly
- State Florida
- 87 Strongly Landlord-Friendly · R+3
- County
- — inherits STATE
- City
- — inherits STATE
ZIP-level market 34285
- Rents YoY
- 8.8%
- Active inventory
- 468
- Price-to-rent
- 8.8×
Monthly cashflow live
- Estimated rent
- $2,278 medium interval (Pro) →
- Mortgage (P&I)
- −$1,259
- Tax from tax record
- −$146 /mo · $1,754/yr
- Insurance
- −$100
- Flood insurance flood zone
- −$427 /mo · $5,118/yr
- HOA
- −$0
- Vacancy / Maint / Mgmt
- −$478
- Net cashflow
- $-131
Break-even live
Sensitivity live
| Price | -10% $5 | -5% $-63 | +0% $-131 | +5% $-199 | +10% $-267 |
|---|---|---|---|---|---|
| Rent | -10% $-311 | -5% $-221 | +0% $-131 | +5% $-41 | +10% $49 |
| Rate | -1.0pp $-10 | -0.5pp $-70 | base $-131 | +0.5pp $-194 | +1.0pp $-257 |
UW: 25.0% down · 7.5% · 30yr · 1.5% tax · 5.0% vac · 8.0% maint · 8.0% mgmt
Financing live
Cash to close
- Down payment
- $60,000
- Closing costs
- $7,200
- Reserves months
- —
- Total cash needed
- —
Loan-product check · same deal, 3 products live
Conventional
25% down · 7.5% · 30yr
- Down + closing
- —
- Monthly P&I
- —
- Monthly cashflow
- —
- DSCR
- —
- Eligible?
- —
Personal DTI + credit; lowest rate.
DSCR
20% down · 8.5% · 30yr
- Down + closing
- —
- Monthly P&I
- —
- Monthly cashflow
- —
- DSCR
- —
- Eligible?
- —
No personal income docs; deal must DSCR.
Hard money
10% down · 12.0% · 12mo
- Down + closing
- —
- Monthly P&I
- —
- Monthly cashflow
- —
- DSCR
- —
- Eligible?
- —
Short-term bridge; refi at stabilization.
Listing history 6 events
-
2026-05-18status Pending 304-char remark
Show marketing remark (304 chars)
Big improvements are already done - now it’s your turn to add the finishing touch. Explore the possibilities! With a new roof, new windows, new septic, new kitchen, new bathrooms, newer A/C, and newer water heater, this work in progress offers a rare chance to step into value and make it your own.
-
2026-04-21price $240,000 304-char remark
Show marketing remark (304 chars)
Big improvements are already done - now it’s your turn to add the finishing touch. Explore the possibilities! With a new roof, new windows, new septic, new kitchen, new bathrooms, newer A/C, and newer water heater, this work in progress offers a rare chance to step into value and make it your own.
-
2026-02-24price $260,000 304-char remark
Show marketing remark (304 chars)
Big improvements are already done - now it’s your turn to add the finishing touch. Explore the possibilities! With a new roof, new windows, new septic, new kitchen, new bathrooms, newer A/C, and newer water heater, this work in progress offers a rare chance to step into value and make it your own.
-
2026-01-28$280,000 Active 304-char remark
Show marketing remark (304 chars)
Big improvements are already done - now it’s your turn to add the finishing touch. Explore the possibilities! With a new roof, new windows, new septic, new kitchen, new bathrooms, newer A/C, and newer water heater, this work in progress offers a rare chance to step into value and make it your own.
-
2019-12-31soldstatus $180,000
-
1988-04-15soldstatus $48,500
ⓘ Source: listings_history table (triggers on properties + properties_extension) + one-shot
backfill from property_details.listing_events for pre-trigger history.
Tax reassessment forecast FL · Resets to sale price
- Current annual tax
- $1,754 · $146/mo
- Projected year-2 tax
- $1,992 · $166/mo
- Expected delta
- +$238/yr (+$20/mo · 13.5%)
ⓘ Screening estimate from a state-policy table — verify with the county assessor before closing.
Climate risk First Street
- Flood 6/10 Major FEMA zone AE · 57% chance over 30 yrs
- Wildfire 1/10 Low
- Heat 10/10 Extreme 7 d/yr ≥107°F today · 29 d/yr by 30 yrs out
- Wind 10/10 Extreme 99% chance of damaging wind over 30 yrs
- Air quality 2/10 Low 1 unhealthy d/yr today · 1 by 30 yrs out
Nearby sold comps map
Loading sold comps map…
Walkable amenities ~0.75 mi
Loading nearby amenities…
Taxation est. · year 1
- Rental income
- $27,341
- − Mortgage interest
- −$13,444
- − Property taxes
- −$1,754
- − Insurance
- −$6,319
- − Repairs & maintenance
- −$2,187
- − Management
- −$2,187
- − Depreciation
- −$6,982
- Taxable loss
- −$5,532
- Est. tax savings @ 24.0%
- +$1,328
- After-tax cash flow
- $-249/yr
For passive investors: Depreciation is non-cash, so a rental often shows a tax loss while cash-flowing — sheltering income. Rental losses are passive: they offset passive income freely, and up to $25,000/yr can offset ordinary (W-2) income if you actively participate and your MAGI is under $100k (phasing out to $0 by $150k); unused losses carry forward. On sale, claimed depreciation is recaptured at up to 25%, and gains may owe capital-gains tax (a 1031 exchange can defer both). Figures are a year-1 estimate at your 24.0% rate — not tax advice; consult a CPA.
Schools (NCES district)
- District
- Sarasota
- NCES district ID
- 1201680
- Math proficiency
- 63% ▼ -8.00%
- Reading proficiency
- 63% ▼ -3.00%
- Median HH income
- $51,167
- Composite
- 53.68/100
- National rank
- #1428
- State rank
- #7 of 73 in FL
Livability — Venice
- Score
- 80/100
- State rank
- #129
- US rank
- #1925
Category grades
Schools grade is shown separately in the Schools card above.
Census & demographics
- County
- Sarasota County · 448,376 people
- City population
- 86,541
- Metro
- North Port-Sarasota-Bradenton, FL
- Population (ZIP)
- 18,677
- Household income
- $68,301
- Rent vs Own
- Severe rent burden
- 747.0
Population outlook (Sarasota County) Hauer SSP2
- Today (2025)
- 452,380 people
- By 2030
- 474,175 · +4.8%
- By 2040
- 511,577 · +13.1%
- By 2050
- 541,467 · +19.7%
- By 2075
- 604,947 · +33.7%
- By 2100
- 621,965 · +37.5%
Race, ethnicity, and origin ACS 2023
- Neighborhood character
- Predominantly White (88%)
- Race & ethnicity
- White 88% Two or more races 6% Hispanic / Latino 6% Asian 1%
- Hispanic origin (detail)
- Mexican 1% Puerto Rican 2% Cuban 1%
- Common ancestry
- Romanian 5% Lithuanian 5% Italian 3%
- Foreign-born
- 11% · Canada
- Languages at home
- 88% English-only · Spanish 4% Other Indo-European 2% German/W. Germanic 2%
Political lean MEDSL · Sarasota
- 2024 margin
- R (+18.2) · D 40.5% · R 58.7%
- 2008→2024 swing
- -18.1pp toward R · 2008: -0.1pp · 2024: -18.2pp
- All cycles
- 2024: R+18.2 2020: R+10.4 2016: R+11.6 2012: R+7.4 2008: R+0.1
Not yet ingested
- Civics
- —
Market trends
- HPI YoY
- ▼ -329.42%
- Current HPI
- 264.6389
- Rent YoY
- ▲ 8.78%
- Metro
- North Port-Sarasota-Bradenton, FL
- State GDP YoY
- ▲ 3.28%
- F500 in state
- 36
Industry mix (Fortune 500 HQ in FL)
| Industry | F500 HQs | Revenue |
|---|---|---|
| Industrial Technology | 2 | $29B |
|
||
| Insurance | 2 | $17B |
|
||
| Retail | 1 | $60B |
|
||
| Technology Distribution | 1 | $58B |
|
||
| Homebuilding | 1 | $35B |
|
||
| Technology Manufacturing | 1 | $35B |
|
||
Price history
+394.8% since first listed6 events — show timeline
- 2026-05-18 Pending — Stellar MLS as Distributed by MLS Grid
- 2026-04-21 Price Changed $240,000 Stellar MLS as Distributed by MLS Grid
- 2026-02-24 Price Changed $260,000 Stellar MLS as Distributed by MLS Grid
- 2026-01-28 Listed $280,000 Stellar MLS as Distributed by MLS Grid
- 2019-12-31 Sold (Public Records) $180,000 Public Records
- 1988-04-15 Sold (Public Records) $48,500 Public Records
Property tax history
+3.0%/yrLatest (2025): $1,754 · +4.0% YoY. Source: county tax records.
Cash-flow waterfall
monthlySold comps — $/sqft
last 12 mo · ≤1 miLoading sold comps…