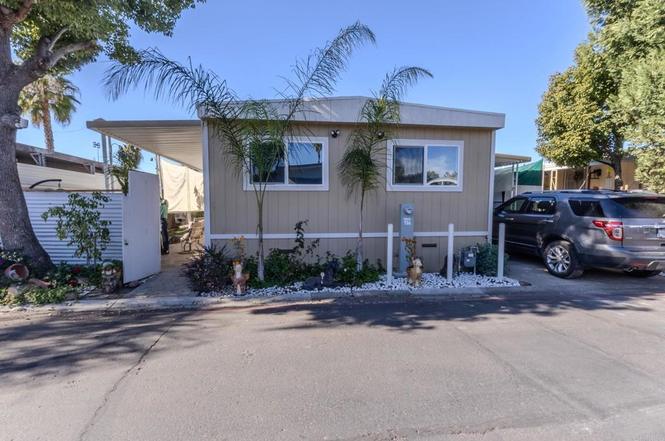
400 Greenfield Dr #136 · Bostonia, CA
Flood risk 1/10 · Minimal
- FEMA flood zone
- X (unshaded)
- Chance of flooding over 30 yrs
- 0.0%
- Est. flood insurance / yr
- $507 – $1,088
Fire risk 1/10 · Minimal
- Est. fire insurance / yr
- $659 – $1,223
Heat risk 5/10 · Moderate
- Hot days now (above 99°F)
- 5 days/yr
- Hot days in 30 yrs
- 14 days/yr
Wind risk 1/10 · Minimal
- Chance of severe wind over 30 yrs
- —
Air-quality risk 3/10 · Minor
- Unhealthy air days now
- 4 days/yr
- Unhealthy air days in 30 yrs
- 4 days/yr
Risk factors via First Street. Map © Google.
Why this score? — see what drove the C+ grade
The composite is a weighted blend of 9 inputs, each scored 0–100. Each bar is that input's sub-score; the figure is the points it added to the 100-point composite (weight × sub-score).
- Cash flow +30.0/30.0
- 1% rule +10.0/10.0
- DSCR +10.0/10.0
- Schools +4.0/10.0
- Livability +3.2/5.0
- Condition / age +2.5/5.0
- Rent growth +2.3/5.0
- ARV discount +0.0/15.0
- Appreciation +0.0/10.0
$149,000
🖨 Deal sheet 📄 Offer letter ✓ Due diligence
Listing remarks
Warm, welcoming, and move-in ready, this updated 3-bedroom, 1-bath mobile home offers the perfect blend of comfort and space. Step inside to an open-concept living space filled with natural light, ideal for everyday living and easy entertaining. Thoughtful updates throughout give the home a fresh, modern feel while keeping it comfortable and functional. One of the true highlights is the oversized carport, offering plenty of space for multiple vehicles—an uncommon bonus. Even better, the private backyard is a rare find for this type of home, providing room to relax, garden, entertain, or create your own outdoor retreat. Move-in ready and full of value, this home offers space, convenien
Key facts
- Oversized carport
- Private backyard
- 17.31 acre lot
Tags
Property features AI
Finance
- Financial info: Lot size reported as 0-1 unit/acre (per public records)
- HOA & community: Land lease in place with amount of $1,867
Exterior
- Parking: 3 uncovered parking spaces (3 total parking spaces); Located in Greenfield Mobile Home Estates
- Utilities: Public sewer
- Home design: Mobile home; Single-story
- Construction: Mobile home dimensions approximately 10' x 40'; Single-story structure
- Exterior features: Community pool; Curbs; Street lighting; Has a view
Interior
- Kitchen: Kitchen
- Bedrooms: Bedrooms on the main level
- Bathrooms: 1 full bathroom
- Heating & cooling: Wall/window cooling
- Interior features: One-level home; Front door entry located on the right side of the home; All bedrooms located on the main level; Living room
- Laundry & utility: Washer hookup; Gas and electric dryer hookup
Neighborhood map
What this means for you Summary
Snapshot
- This is a 2-bed/1.0-bath manufactured listed at $149k.
Deal economics
- At list price, monthly cash flow is $817 ($10k/yr) — positive.
- The deal already cash-flows at list — no discount required.
- Meets the 1% rule at list price ($2k rent vs $149k).
- Recommended offer: $131k (12.0% below list) — sets the bar for market timing.
- Cap rate 12.9% vs local median 6.0% in Bostonia — top-decile yield for the area; either an underpriced asset or a hidden risk that comps aren't pricing in. Stress-test before assuming the spread holds.
Location & tenants
- Location reads 65/100 on livability (#383 in CA) — a middle-class / working-renter tenant base. Strengths: commute A+, housing B+; Watch: schools D, crime F, amenities F.
- Grossmont Union High (suburban): math 31% / reading 60% proficiency, ranked #173 of 517 in CA (top 34%) — families likely to look elsewhere, expect single-tenant / working-renter base with shorter leases; only 17% free/reduced lunch — higher-income household profile.
- Market conditions: Rents soft (-0.8%/yr); 238 active listings in the ZIP; 40 comparable units currently listed for rent nearby; rentals leasing fast (median 2d on market — plan ~1-2 weeks tenant-placement turnaround); 11,759 units permitted in San Diego County in 2024 (7,244 in 5+ unit buildings).
- This rent runs 38% of the median local income ($74k/yr) — at the standard rent-burdened threshold; future hikes will face affordability resistance.
Forward outlook
- Local home prices are declining (-3.0%/yr); year-one equity from $1k of loan paydown is wiped out by about $4k of value loss. Plan a longer hold.
- San Diego County population projected at +20% by 2050 — long-run rental-demand tailwind backs the buy-and-hold thesis.
- At projected returns (-3.0% appreciation + 0.0% rent growth), your $42k cash investment doubles in ~7 years — after that, you're playing with house money.
Negotiation context
- It's been on market 147 days — a 12% lower offer ($131k) is reasonable based on typical stale-listing flexibility.
Risks & watch-outs
- Climate carrying-cost: extreme-heat days projected 5→14/yr by 2055 (HVAC capex compounding) — expect insurance premiums to compound above CPI over the hold.
Questions for the listing agent
- It's been on market 147 days. Have you received any prior offers? Is the seller open to a 12% concession, seller financing, or rate buy-down credit?
- Built in 1971 — when were the roof, HVAC, electrical panel, plumbing, and water heater last replaced?
- Why hasn't it sold? Are there any deal-killer items the seller is aware of (foundation, flood, title, zoning, code violations)?
- Is there a deadline driving the sale (1031 exchange, divorce, estate, relocation)? That informs how much negotiation room exists.
- Schools are D-rated, which usually means shorter tenancies and higher turnover. Who's the typical renter profile here, and what's been the actual vacancy rate?
- Crime grade is F in this area — have there been break-ins, vandalism, or insurance claims at this property in the last 3 years? What carrier currently insures it and at what premium?
- What's the average days-on-market for RENTAL listings here right now (not sales)? A rising rental-DOM trend means longer vacancies and softer asking-rent achievability than the comps imply.
- What's the recent tenant-quality profile in this submarket — average credit score on applications, eviction rate, late-payment / NSF rate, and stable-employment percentage? A property-management company in the area should have these aggregated.
- How much new for-sale + rental construction is in the pipeline within 1–3 miles? Heavy new supply typically softens prices + rents 12–24 months out; constrained supply supports both.
Investment metrics
- 1% rule
- 1.57% ✓
- Cap rate
- 12.87%
- Cash-on-cash
- 23.49%
- DSCR
- 2.04
- GRM
- 5.3
CMA / ARV
- ARV (on-the-fly)
- $100,800
- Comps found
- 7
Show comp detail 7 sales within ~0.75 mi
| Address | Dist | Beds/Ba | Sqft | Sold | Price | $/sf | Match |
|---|---|---|---|---|---|---|---|
| 351 E Bradley Ave #48 | 0.22mi | 2/1.0 | 800 (0%) | 1mo | $79,999 | $100 | 89 |
| 255 E Bradley Ave Spc 79 | 0.24mi | 2/2.0 | 760 (-5%) | 6mo | $95,500 | $126 | 72 |
| 255 E Bradley Ave #11 | 0.22mi | 2/2.0 | 800 (0%) | 17mo | $130,000 | $163 | 71 |
| 255 E Bradley Ave #110 | 0.24mi | 2/1.0 | 728 (-9%) | 14mo | $58,000 | $80 | 62 |
| 450 E Bradley Ave #18 | 0.48mi | 2/2.0 | 747 (-7%) | 7mo | $100,000 | $134 | 57 |
| 450 E Bradley Ave #32 | 0.48mi | 2/2.0 | 745 (-7%) | 14mo | $83,000 | $111 | 51 |
| 351 E Bradley Ave #91 | 0.36mi | 3/1.0 (+1) | 880 (+10%) | 20mo | $140,000 | $159 | 46 |
Match score weights: distance 35% · size 25% · config 20% · recency 20%. Top-matched comps best support the ARV.
Projected returns pro-forma
-3.0% appreciation · 0.0% rent growth · sell at horizon
- IRR
- 13.1%
- Equity multiple
- 1.50×
- Total profit
- $21,045
- Equity at exit
- $22,216
- IRR
- 19.6%
- Equity multiple
- 2.41×
- Total profit
- $58,964
- Equity at exit
- $12,883
Cash invested: $41,720 (down + closing). Projections, not guarantees.
Landlord ↔ Tenant lean methodology
- Overall (STATE)
- 18 Strongly Tenant-Friendly
- State California
- 18 Strongly Tenant-Friendly · D+13
- County
- — inherits STATE
- City
- — inherits STATE
ZIP-level market 92021
- Rents YoY
- -0.8%
- Active inventory
- 238
- Price-to-rent
- 5.3×
Monthly cashflow live
- Estimated rent
- $2,337 high interval (Pro) →
- Mortgage (P&I)
- −$781
- Tax est. 1.5%
- −$186 /mo · $2,235/yr
- Insurance
- −$62
- HOA
- −$0
- Vacancy / Maint / Mgmt
- −$491
- Net cashflow
- $817
Break-even live
UW: 25.0% down · 7.5% · 30yr · 1.5% tax · 5.0% vac · 8.0% maint · 8.0% mgmt
Financing live
Cash to close
- Down payment
- $37,250
- Closing costs
- $4,470
- Reserves months
- —
- Total cash needed
- —
Loan-product check · same deal, 3 products live
Conventional
25% down · 7.5% · 30yr
- Down + closing
- —
- Monthly P&I
- —
- Monthly cashflow
- —
- DSCR
- —
- Eligible?
- —
Personal DTI + credit; lowest rate.
DSCR
20% down · 8.5% · 30yr
- Down + closing
- —
- Monthly P&I
- —
- Monthly cashflow
- —
- DSCR
- —
- Eligible?
- —
No personal income docs; deal must DSCR.
Hard money
10% down · 12.0% · 12mo
- Down + closing
- —
- Monthly P&I
- —
- Monthly cashflow
- —
- DSCR
- —
- Eligible?
- —
Short-term bridge; refi at stabilization.
Rent comps 40 comps
| Address | Beds | Baths | Sqft | Rent | $/sqft | DOM | Units | Dist |
|---|---|---|---|---|---|---|---|---|
| 1237 Graves Ave El Cajon, CA | 1.0–2.0 | 1.0–2.0 | 775 | $2,565 | $3.31 | 1d | 13 | 0.11mi |
| 1261 Victor Ave Unit 9 El Cajon, CA | 2.0 | 2.0 | 810 | $2,195 | $2.71 | 1d | 1 | 0.20mi |
| 425 E Bradley Ave El Cajon, CA | 1.0–2.0 | 1.0 | 771 | $2,350 | $3.05 | 1d | 13 | 0.34mi |
| 1294 N Mollison Ave El Cajon, CA | 1.0–2.0 | 1.0 | 750 | $2,128 | $2.84 | 1d | 8 | 0.38mi |
| 310 E Bradley Ave El Cajon, CA | 1.0–2.0 | 1.0 | 664 | $2,050 | $3.09 | 1d | 1 | 0.43mi |
| 745 E Bradley Ave Unit 46 El Cajon, CA | 3.0 | 1.0 | 806 | $2,298 | $2.85 | 24d | 1 | 0.48mi |
| 360 E Bradley Ave El Cajon, CA | 3.0 | 2.0 | 1116 | $2,934 | $2.63 | 1d | 3 | 0.49mi |
| 1521 Graves Ave El Cajon, CA | 1.0–2.0 | 1.0–2.0 | 730 | $2,632 | $3.61 | 1d | 7 | 0.49mi |
| 1005 N Mollison Ave El Cajon, CA | 2.0 | 1.0 | 750 | $2,195 | $2.93 | 1d | 1 | 0.57mi |
| 848 N Mollison Ave El Cajon, CA | 1.0 | 1.0 | 690 | $2,101 | $3.04 | 1d | 5 | 0.61mi |
| 1696 Buckeye Dr El Cajon, CA | 3.0 | 1.0 | 942 | $2,900 | $3.08 | 1d | 1 | 0.64mi |
| 1430 Diamond Ln El Cajon, CA | 2.0 | 1.0 | 863 | $2,695 | $3.12 | 2d | 1 | 0.64mi |
| 716 Ballantyne St Unit 12 El Cajon, CA | 2.0 | 2.0 | 900 | $2,100 | $2.33 | 1d | 1 | 0.66mi |
| 700 Ballantyne St El Cajon, CA | 1.0–2.0 | 1.0 | 850 | $2,150 | $2.53 | 1d | 5 | 0.66mi |
| 1314 5 D Dr Unit 1318 El Cajon, CA | 3.0 | 1.0 | 960 | $2,600 | $2.71 | 23d | 1 | 0.66mi |
| 798 McClure St Apt 7 El Cajon, CA | 1.0 | 1.0 | 570 | $1,595 | $2.80 | 1d | 1 | 0.74mi |
| 798 McClure St Unit 14 El Cajon, CA | 3.0 | 1.0 | 916 | $2,295 | $2.51 | 1d | 1 | 0.74mi |
| 989 Peach Ave El Cajon, CA | 1.0–3.0 | 1.0–2.0 | 845 | $2,150 | $2.54 | 1d | 11 | 0.75mi |
| 1019 Peach Ave El Cajon, CA | 1.0–2.0 | 1.0–2.0 | 700 | $2,161 | $3.09 | 1d | 8 | 0.81mi |
| 205 Beech St El Cajon, CA | 2.0 | 1.5 | 850 | $2,480 | $2.92 | 1d | 1 | 0.83mi |
| 1038 Peach Ave El Cajon, CA | 2.0 | 1.5 | 850 | $1,978 | $2.33 | 1d | 4 | 0.83mi |
| 1037 Peach Ave El Cajon, CA | 1.0 | 1.0 | 560 | $1,694 | $3.03 | 1d | 4 | 0.85mi |
| 1050 Peach Ave El Cajon, CA | 2.0 | 2.0 | 850 | $3,460 | $4.07 | 4d | 1 | 0.85mi |
| 390 E Madison Ave Unit E El Cajon, CA | 2.0 | 1.5 | 1034 | $2,300 | $2.22 | 3d | 1 | 0.88mi |
| 534 Jeffree St El Cajon, CA | 3.0 | 2.0 | 1118 | $3,895 | $3.48 | 10d | 1 | 0.92mi |
| 534 Jeffree St El Cajon, CA | 3.0 | 2.0 | 1118 | $3,895 | $3.48 | 3d | 1 | 0.92mi |
| 303 E Madison Ave El Cajon, CA | 2.0 | 1.0 | 875 | $1,995 | $2.28 | 1d | 1 | 0.92mi |
| 455 Ballantyne St El Cajon, CA | 2.0 | 1.5 | 925 | $2,195 | $2.37 | 1d | 1 | 0.94mi |
| 505 E Madison Ave #89 El Cajon, CA | 2.0 | 1.5 | 975 | $2,350 | $2.41 | 2d | 1 | 0.95mi |
| 359 Cascade Rd El Cajon, CA | 2.0 | 1.0 | 765 | $2,875 | $3.76 | 7d | 1 | 0.96mi |
| 453 Graves Ave El Cajon, CA | 2.0 | 2.0 | 840 | $2,150 | $2.56 | 1d | 1 | 0.97mi |
| 458 Ballantyne St Unit 15 El Cajon, CA | 2.0 | 1.0 | 760 | $2,100 | $2.76 | 1d | 1 | 0.97mi |
| 545 N Mollison Ave El Cajon, CA | 2.0 | 1.0 | 700 | $2,028 | $2.90 | 1d | 11 | 0.99mi |
| 545 N Mollison Ave El Cajon, CA | 2.0 | 1.0 | 700 | $2,000 | $2.86 | 7d | 9 | 0.99mi |
| 444 Graves Ave El Cajon, CA | 1.0 | 1.0 | 600 | $1,815 | $3.02 | 2d | 1 | 1.01mi |
| 589 N Johnson Ave El Cajon, CA | 2.0 | 1.0–2.0 | 889 | $2,150 | $2.42 | 1d | 1 | 1.02mi |
| 917 E Madison Ave El Cajon, CA | 2.0 | 1.0 | 750 | $2,195 | $2.93 | 1d | 1 | 1.06mi |
| 1221 Oro St El Cajon, CA | 2.0 | 1.5 | 1020 | $2,575 | $2.52 | 1d | 1 | 1.06mi |
| 314 Wisconsin Ave El Cajon, CA | 1.0 | 1.0 | 550 | $1,695 | $3.08 | 1d | 1 | 1.07mi |
| 241 Wisconsin Ave El Cajon, CA | 1.0 | 1.0 | 585 | $1,880 | $3.21 | 1d | 5 | 1.09mi |
Listing history 17 events
-
2026-06-18days on market $149,000 Active 147 DOM
-
2026-06-17days on market $149,000 Active 146 DOM
-
2026-06-16days on market $149,000 Active 145 DOM
-
2026-06-15days on market $149,000 Active 144 DOM
-
2026-06-13days on market $149,000 Active 142 DOM
-
2026-06-13days on market $149,000 Active 141 DOM
-
2026-06-09days on market $149,000 Active 138 DOM
-
2026-06-08days on market $149,000 Active 137 DOM
-
2026-06-07days on market $149,000 Active 136 DOM
-
2026-06-04days on market $149,000 Active 133 DOM
-
2026-06-03days on market $149,000 Active 132 DOM
-
2026-06-02days on market $149,000 Active 131 DOM
-
2026-06-01days on market $149,000 Active 130 DOM
-
2026-05-31days on market $149,000 Active 129 DOM
-
2026-04-01price $149,000
-
2026-03-09price $170,000
-
2026-01-22$185,000 Active
ⓘ Source: listings_history table (triggers on properties + properties_extension) + one-shot
backfill from property_details.listing_events for pre-trigger history.
Climate risk First Street
- Flood 1/10 Low FEMA zone X (unshaded) · 0% chance over 30 yrs
- Wildfire 1/10 Low
- Heat 5/10 Major 5 d/yr ≥99°F today · 14 d/yr by 30 yrs out
- Wind 1/10 Low
- Air quality 3/10 Moderate 4 unhealthy d/yr today · 4 by 30 yrs out
Nearby sold comps map
Loading sold comps map…
Walkable amenities ~0.75 mi
Loading nearby amenities…
Taxation est. · year 1
- Rental income
- $28,044
- − Mortgage interest
- −$8,346
- − Property taxes
- −$2,235
- − Insurance
- −$745
- − Repairs & maintenance
- −$2,243
- − Management
- −$2,243
- − Depreciation
- −$4,335
- Taxable income
- $7,896
- Est. tax owed @ 24.0%
- −$1,895
- After-tax cash flow
- $7,903/yr
For passive investors: Depreciation is non-cash, so a rental often shows a tax loss while cash-flowing — sheltering income. Rental losses are passive: they offset passive income freely, and up to $25,000/yr can offset ordinary (W-2) income if you actively participate and your MAGI is under $100k (phasing out to $0 by $150k); unused losses carry forward. On sale, claimed depreciation is recaptured at up to 25%, and gains may owe capital-gains tax (a 1031 exchange can defer both). Figures are a year-1 estimate at your 24.0% rate — not tax advice; consult a CPA.
Schools (NCES district)
- District
- Grossmont Union High
- NCES district ID
- 0616230
- Math proficiency
- 31% ▼ -1.00%
- Reading proficiency
- 60% ▲ 5.00%
- Median HH income
- $61,801
- Composite
- 40.07/100
- National rank
- #3810
- State rank
- #173 of 517 in CA
Livability — Bostonia
- Score
- 65/100
- State rank
- #383
- US rank
- #13065
Category grades
Schools grade is shown separately in the Schools card above.
Census & demographics
- Census place
- Bostonia, CA
- County
- San Diego County · 3,178,799 people
- Metro
- San Diego-Chula Vista-Carlsbad, CA
- Population (ZIP)
- 70,501
- Household income
- $74,013
- Rent vs Own
- Severe rent burden
- 4178.0
Population outlook (San Diego County) Hauer SSP2
- Today (2025)
- 3,678,185 people
- By 2030
- 3,856,546 · +4.8%
- By 2040
- 4,171,407 · +13.4%
- By 2050
- 4,421,607 · +20.2%
- By 2075
- 4,831,599 · +31.4%
- By 2100
- 4,832,502 · +31.4%
Race, ethnicity, and origin ACS 2023
- Neighborhood character
- Diverse neighborhood (Simpson 0.62)
- Race & ethnicity
- White 54% Hispanic / Latino 28% Two or more races 14% Black 6% Asian 5% Native American 2%
- Hispanic origin (detail)
- Mexican 24%
- Common ancestry
- Arab 6% Italian 2% Lithuanian 2%
- Foreign-born
- 22% · Canada
- Languages at home
- 65% English-only · Spanish 18% Arabic 7% Other Indo-European 3%
Political lean MEDSL · San Diego
- 2024 margin
- D (+16.8) · D 56.9% · R 40.1% · Other 2.9%
- 2008→2024 swing
- +6.6pp toward D · 2008: 10.2pp · 2024: 16.8pp
- All cycles
- 2024: D+16.8 2020: D+22.8 2016: D+17.8 2012: D+5.1 2008: D+10.2
Not yet ingested
- Civics
- —
Market trends
- HPI YoY
- ▼ -654.88%
- Current HPI
- 335.0617
- Rent YoY
- ▼ -0.83%
- Metro
- San Diego-Chula Vista-Carlsbad, CA
- State GDP YoY
- ▲ 3.21%
- F500 in state
- 116
Industry mix (Fortune 500 HQ in CA)
| Industry | F500 HQs | Revenue |
|---|---|---|
| Technology | 27 | $1,492B |
|
||
| Financial Services | 3 | $174B |
|
||
| Retail | 3 | $44B |
|
||
| Insurance | 3 | $26B |
|
||
| Media / Entertainment | 2 | $115B |
|
||
| Pharmaceuticals / Biotech | 2 | $62B |
|
||
Price history
-19.5% since first listed3 events — show timeline
- 2026-04-01 Price Changed $149,000 CRMLS
- 2026-03-09 Price Changed $170,000 CRMLS
- 2026-01-22 Listed $185,000 CRMLS
Property tax history
+3.1%/yrLatest (2013): $214 · +5.4% YoY. Source: county tax records.
Cash-flow waterfall
monthlySold comps — $/sqft
last 12 mo · ≤1 miLoading sold comps…