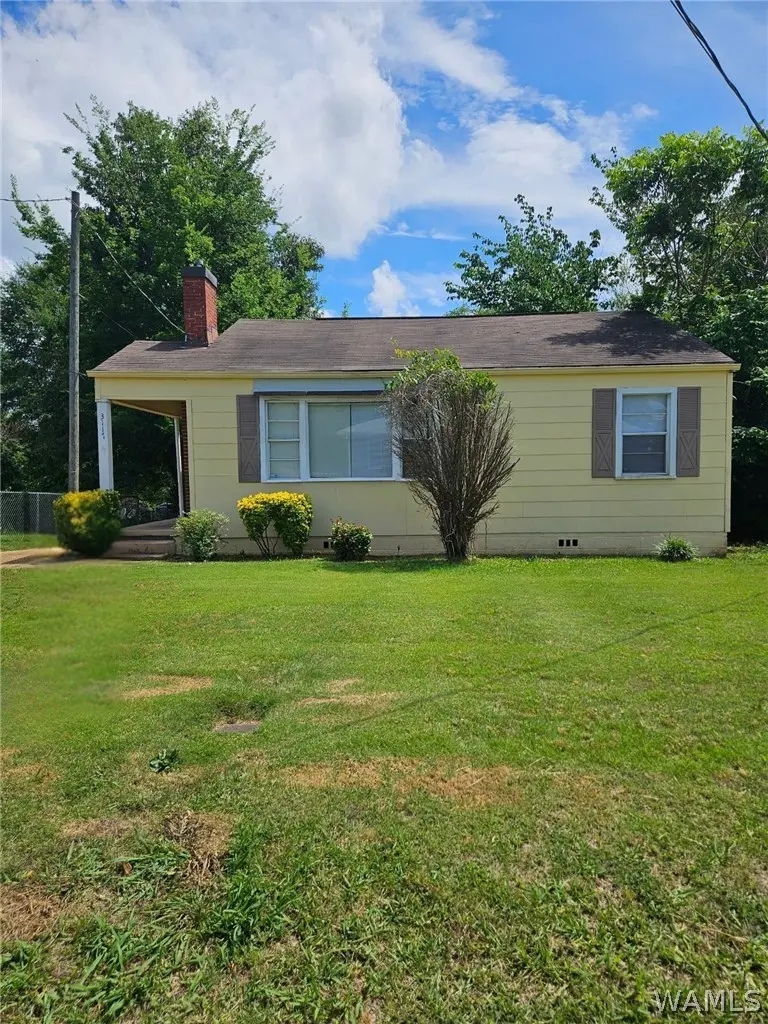
3117 7th St E · Tuscaloosa, AL
Flood risk 1/10 · Minimal
- FEMA flood zone
- X (unshaded)
- Chance of flooding over 30 yrs
- 0.0%
- Est. flood insurance / yr
- $507 – $1,088
Fire risk 3/10 · Minor
- Est. fire insurance / yr
- $916 – $1,700
Heat risk 7/10 · Major
- Hot days now (above 108°F)
- 7 days/yr
- Hot days in 30 yrs
- 20 days/yr
Wind risk 6/10 · Moderate
- Chance of severe wind over 30 yrs
- 60.0%
Air-quality risk 3/10 · Minor
- Unhealthy air days now
- 2 days/yr
- Unhealthy air days in 30 yrs
- 3 days/yr
Risk factors via First Street. Map © Google.
Why this score? — see what drove the B+ grade
The composite is a weighted blend of 9 inputs, each scored 0–100. Each bar is that input's sub-score; the figure is the points it added to the 100-point composite (weight × sub-score).
- Cash flow +30.0/30.0
- ARV discount +13.7/15.0
- 1% rule +10.0/10.0
- DSCR +10.0/10.0
- Rent growth +4.2/5.0
- Livability +3.9/5.0
- Condition / age +2.8/5.0
- Schools +2.5/10.0
- Appreciation +0.0/10.0
$125,000
🖨 Deal sheet (PDF) 📄 Offer letter ✓ Due diligence
Listing remarks
Whether you are a first time homebuyer, down sizing, or an investor building your portfolio, this 2 bedroom 1 bath home in Alberta is one for you to come and see in person. It has fresh paint throughout the interior and is totally electric. All information deemed reliable, but not guaranteed. Buyer(s) and/or Buyer's Agent responsible for verifying all information on property.
Key facts
- 6,970 sq ft lot
- Built 1945
- Listed 31 days
Property features AI
Exterior
- Parking: Concrete driveway
- Utilities: Sewer connected
- Home design: Single-family residence; One story; Residential property in the Abernathy subdivision
- Construction: Frame construction; Other construction materials; Composition/shingle roof
- Exterior features: Paved road access; No pool
Interior
- Bathrooms: 1 full bathroom
- Heating & cooling: Central heating; Central air conditioning
- Interior features: Fireplace (1)
- Laundry & utility: Laundry on the main level; Water heater
Neighborhood map
What this means for you Summary
Snapshot
- This is a 2-bed/1.0-bath single-family listed at $125k. Condition is rated average.
Deal economics
- At list price, monthly cash flow is $616 ($7k/yr) — positive.
- The deal already cash-flows at list — no discount required.
- Meets the 1% rule at list price ($2k rent vs $125k).
- Recommended offer: $121k (3.0% below list) — sets the bar for market timing.
- Cap rate 12.2% vs local median 3.4% in Tuscaloosa — top-decile yield for the area; either an underpriced asset or a hidden risk that comps aren't pricing in. Stress-test before assuming the spread holds.
Location & tenants
- Location reads 77/100 on livability (#9 in AL, #2,909 nationally) — a middle-class / working-renter tenant base. Strengths: amenities A+, health & safety A+, cost of living A; Watch: crime F, employment D-.
- Tuscaloosa City (urban): math 19% / reading 40% proficiency, ranked #74 of 129 in AL (top 57%) — low school quality limits family demand, transient renter base, plan for 1-2y turnover.
- Zoned schools: The Alberta School of Performing Arts (math 10% / reading 37%, grade F, #429 of 627 statewide, top 69%, 671 students, 82% FRL); Northridge Middle School (math 29% / reading 57%, grade D-, #48 of 257 statewide, top 19%, 740 students, 39% FRL); Northridge High School (math 40% / reading 42%, grade F, #31 of 305 statewide, top 10%, 1,145 students, 35% FRL).
- Market conditions: Rents rising fast (+6.8%/yr); 167 active listings in the ZIP; 12 comparable units currently listed for rent nearby; rentals lingering (median 46d on market — plan ~5-8 weeks vacancy on turnover, expect pricing pressure); 50% of comp listings sitting > 30 days — soft ceiling on asking rent; 622 units permitted in Tuscaloosa County in 2024 (69 in 5+ unit buildings).
- At $1,873/mo this rent would consume 46% of the median local household income ($49k/yr) (locally 1531% of renters already pay >50% of income on rent) — very limited rent-growth headroom before tenants either downsize or default.
Forward outlook
- Local home prices are declining (-3.0%/yr); year-one equity from $864 of loan paydown is wiped out by about $4k of value loss. Plan a longer hold.
- Tuscaloosa County population projected at +26% by 2050 — long-run rental-demand tailwind backs the buy-and-hold thesis.
- At projected returns (-3.0% appreciation + 6.8% rent growth), your $35k cash investment doubles in ~5 years — after that, you're playing with house money.
Negotiation context
- It's been on market 31 days — a 3% lower offer ($121k) is reasonable based on typical stale-listing flexibility.
Risks & watch-outs
- Watch-outs: built in 1945 — expect roof / HVAC / electrical / plumbing capex.
- Climate carrying-cost: major wind risk, 60% chance of damaging wind over 30y; extreme-heat days projected 7→20/yr by 2055 (HVAC capex compounding) — expect insurance premiums to compound above CPI over the hold.
Questions for the listing agent
- It's been on market 31 days. Have you received any prior offers? Is the seller open to a 3% concession, seller financing, or rate buy-down credit?
- Built in 1945 — when were the roof, HVAC, electrical panel, plumbing, and water heater last replaced?
- Is there a deadline driving the sale (1031 exchange, divorce, estate, relocation)? That informs how much negotiation room exists.
- Crime grade is F in this area — have there been break-ins, vandalism, or insurance claims at this property in the last 3 years? What carrier currently insures it and at what premium?
- What's the average days-on-market for RENTAL listings here right now (not sales)? A rising rental-DOM trend means longer vacancies and softer asking-rent achievability than the comps imply.
- What's the recent tenant-quality profile in this submarket — average credit score on applications, eviction rate, late-payment / NSF rate, and stable-employment percentage? A property-management company in the area should have these aggregated.
- How much new for-sale + rental construction is in the pipeline within 1–3 miles? Heavy new supply typically softens prices + rents 12–24 months out; constrained supply supports both.
Investment metrics
- 1% rule
- 1.50% ✓
- Cap rate
- 12.21%
- Cash-on-cash
- 21.12%
- DSCR
- 1.94
- GRM
- 5.6
CMA / ARV
- ARV (on-the-fly)
- $144,960
- Comps found
- 12
Show comp detail 12 sales within ~0.75 mi
| Address | Dist | Beds/Ba | Sqft | Sold | Price | $/sf | Match |
|---|---|---|---|---|---|---|---|
| 703 31st Ave E | 0.03mi | 2/1.0 | 896 (-7%) | 6mo | $130,000 | $145 | 82 |
| 714 31st Ave E | 0.06mi | 2/1.0 | 820 (-15%) | 13mo | $149,900 | $183 | 62 |
| 4 The Knl | 0.39mi | 2/1.0 | 1,034 (+8%) | 11mo | $140,000 | $135 | 59 |
| 513 31st Ave E | 0.11mi | 3/1.0 (+1) | 1,100 (+15%) | 12mo | $199,000 | $181 | 56 |
| 601 30th Ave E | 0.11mi | 3/1.0 (+1) | 1,088 (+13%) | 17mo | $110,000 | $101 | 54 |
| 2320 10th St E | 0.70mi | 2/2.0 | 987 (+3%) | 9mo | $182,000 | $184 | 52 |
| 426 25th Ave E | 0.48mi | 3/1.0 (+1) | 896 (-7%) | 22mo | $88,000 | $98 | 43 |
| 1200 25th St | 0.68mi | 2/1.0 | 827 (-14%) | 3mo | $90,000 | $109 | 43 |
| 2433 4th St E | 0.53mi | 3/1.5 (+1) | 1,016 (+6%) | 21mo | $100,000 | $98 | 41 |
| 2624 3rd St E | 0.47mi | 3/2.0 (+1) | 1,092 (+14%) | 8mo | $165,000 | $151 | 40 |
| 3701 Crescent Gardens Dr | 0.51mi | 3/2.0 (+1) | 1,103 (+15%) | 3mo | $193,000 | $175 | 40 |
| 3645 Crescent Gardens Dr | 0.50mi | 3/2.0 (+1) | 1,104 (+15%) | 15mo | $178,685 | $162 | 30 |
Match score weights: distance 35% · size 25% · config 20% · recency 20%. Top-matched comps best support the ARV.
Projected returns pro-forma
-3.0% appreciation · 6.81% rent growth · sell at horizon
- IRR
- 17.8%
- Equity multiple
- 1.76×
- Total profit
- $26,455
- Equity at exit
- $18,638
- IRR
- 28.9%
- Equity multiple
- 4.05×
- Total profit
- $106,755
- Equity at exit
- $10,808
Cash invested: $35,000 (down + closing). Projections, not guarantees.
Landlord ↔ Tenant lean methodology
- Overall (STATE)
- 90 Strongly Landlord-Friendly
- State Alabama
- 90 Strongly Landlord-Friendly · R+15
- County
- — inherits STATE
- City
- — inherits STATE
ZIP-level market 35404
- Rents YoY
- 6.8%
- Active inventory
- 167
- Price-to-rent
- 5.6×
Monthly cashflow live
- Estimated rent
- $1,873 high interval (Pro) →
- Mortgage (P&I)
- −$656
- Tax est. 1.5%
- −$156 /mo · $1,875/yr
- Insurance
- −$52
- HOA
- −$0
- Vacancy / Maint / Mgmt
- −$393
- Net cashflow
- $616
Break-even live
Sensitivity live
| Price | -10% $702 | -5% $659 | +0% $616 | +5% $573 | +10% $530 |
|---|---|---|---|---|---|
| Rent | -10% $468 | -5% $542 | +0% $616 | +5% $690 | +10% $764 |
| Rate | -1.0pp $679 | -0.5pp $648 | base $616 | +0.5pp $584 | +1.0pp $551 |
UW: 25.0% down · 7.5% · 30yr · 1.5% tax · 5.0% vac · 8.0% maint · 8.0% mgmt
Financing live
Cash to close
- Down payment
- $31,250
- Closing costs
- $3,750
- Reserves months
- —
- Total cash needed
- —
Loan-product check · same deal, 3 products live
Conventional
25% down · 7.5% · 30yr
- Down + closing
- —
- Monthly P&I
- —
- Monthly cashflow
- —
- DSCR
- —
- Eligible?
- —
Personal DTI + credit; lowest rate.
DSCR
20% down · 8.5% · 30yr
- Down + closing
- —
- Monthly P&I
- —
- Monthly cashflow
- —
- DSCR
- —
- Eligible?
- —
No personal income docs; deal must DSCR.
Hard money
10% down · 12.0% · 12mo
- Down + closing
- —
- Monthly P&I
- —
- Monthly cashflow
- —
- DSCR
- —
- Eligible?
- —
Short-term bridge; refi at stabilization.
Rent comps 12 comps
| Address | Beds | Baths | Sqft | Rent | $/sqft | DOM | Units | Dist |
|---|---|---|---|---|---|---|---|---|
| 419 30th Ave E Tuscaloosa, AL | 1.0–2.0 | 1.0–2.0 | 852 | $2,400 | $2.82 | 45d | 5 | 0.15mi |
| 419 30th Ave E Tuscaloosa, AL | 1.0–2.0 | 1.0–2.0 | 852 | $2,200 | $2.58 | 15d | 7 | 0.15mi |
| 3550 Crescent Gardens Dr Tuscaloosa, AL | 3.0 | 2.0 | 1116 | $1,575 | $1.41 | 45d | 1 | 0.43mi |
| 931 Crescent Ridge Rd E Tuscaloosa, AL | 2.0 | 1.5 | 850 | $995 | $1.17 | 45d | 1 | 0.55mi |
| 922 23rd Ave E Tuscaloosa, AL | 1.0–2.0 | 1.0–2.0 | 1092 | $2,300 | $2.11 | 15d | 4 | 0.73mi |
| 936 22nd Ave E Tuscaloosa, AL | 1.0–2.0 | 1.0–2.0 | 906 | $2,000 | $2.21 | 15d | 4 | 0.81mi |
| 933 21st Ave E Tuscaloosa, AL | 1.0–2.0 | 1.0–2.0 | 906 | $2,150 | $2.37 | 45d | 2 | 0.84mi |
| 2501 Veterans Memorial Pkwy Tuscaloosa, AL | 2.0 | 2.0 | 1018 | $875 | $0.86 | 46d | 1 | 0.96mi |
| 2501 Veterans Memorial Pkwy Tuscaloosa, AL | 2.0 | 2.0 | 1078 | $975 | $0.90 | 15d | 1 | 0.96mi |
| 4220 Keene Dr Tuscaloosa, AL | 2.0–3.0 | 2.0 | 1119 | $750 | $0.67 | 23d | 1 | 1.16mi |
| 1515 Kicker Rd Tuscaloosa, AL | 1.0–2.0 | 1.0–2.0 | 1050 | $1,025 | $0.98 | 45d | 1 | 1.22mi |
| 30 Beverly Hts Tuscaloosa, AL | 3.0 | 2.0 | 1100 | $2,100 | $1.91 | 15d | 1 | 1.27mi |
Listing history 18 events
-
2026-06-21days on market $125,000 Active 31 DOM
-
2026-06-18days on market $125,000 Active 28 DOM
-
2026-06-17days on market $125,000 Active 27 DOM
-
2026-06-16days on market $125,000 Active 26 DOM
-
2026-06-15days on market $125,000 Active 25 DOM
-
2026-06-14days on market $125,000 Active 23 DOM
-
2026-06-13days on market $125,000 Active 22 DOM
-
2026-06-10days on market $125,000 Active 20 DOM
-
2026-06-09days on market $125,000 Active 19 DOM
-
2026-06-08days on market $125,000 Active 18 DOM
-
2026-06-07days on market $125,000 Active 17 DOM
-
2026-06-05days on market $125,000 Active 14 DOM
-
2026-06-03days on market $125,000 Active 13 DOM
-
2026-06-02days on market $125,000 Active 12 DOM
-
2026-06-01days on market $125,000 Active 11 DOM
-
2026-05-31days on market $125,000 Active 10 DOM
-
2026-05-30days on market $125,000 Active 9 DOM
-
2026-05-20$125,000 Active
ⓘ Source: listings_history table (triggers on properties + properties_extension) + one-shot
backfill from property_details.listing_events for pre-trigger history.
Climate risk First Street
- Flood 1/10 Low FEMA zone X (unshaded) · 0% chance over 30 yrs
- Wildfire 3/10 Moderate
- Heat 7/10 Severe 7 d/yr ≥108°F today · 20 d/yr by 30 yrs out
- Wind 6/10 Major 60% chance of damaging wind over 30 yrs
- Air quality 3/10 Moderate 2 unhealthy d/yr today · 3 by 30 yrs out
Nearby sold comps map
Loading sold comps map…
Walkable amenities ~0.75 mi
Loading nearby amenities…
Taxation est. · year 1
- Rental income
- $22,477
- − Mortgage interest
- −$7,002
- − Property taxes
- −$1,875
- − Insurance
- −$625
- − Repairs & maintenance
- −$1,798
- − Management
- −$1,798
- − Depreciation
- −$3,636
- Taxable income
- $5,743
- Est. tax owed @ 24.0%
- −$1,378
- After-tax cash flow
- $6,013/yr
For passive investors: Depreciation is non-cash, so a rental often shows a tax loss while cash-flowing — sheltering income. Rental losses are passive: they offset passive income freely, and up to $25,000/yr can offset ordinary (W-2) income if you actively participate and your MAGI is under $100k (phasing out to $0 by $150k); unused losses carry forward. On sale, claimed depreciation is recaptured at up to 25%, and gains may owe capital-gains tax (a 1031 exchange can defer both). Figures are a year-1 estimate at your 24.0% rate — not tax advice; consult a CPA.
Condition & rehab AI · 12 photos
This 2-bedroom home has fresh paint throughout and is totally electric, making it a good investment opportunity. Minor repairs and updates to the kitchen and bathroom would significantly enhance its resale and rental value.
Repairs flagged
- Minor kitchen cabinets — dated cabinetry
- Minor bathroom fixtures — standard fixtures
- Minor exterior siding — some discoloration
Value-add opportunities
- Resale update kitchen cabinets — modernizing kitchen
- Resale update bathroom fixtures — modernizing bathroom
- Resale paint exterior — enhancing curb appeal
- Both replace carpet — improving comfort and appearance
Renovation cost estimate screening
| Repair item | Severity | Est. cost |
|---|---|---|
| kitchen cabinets · dated cabinetry | Minor | $500–3,000 |
| bathroom fixtures · standard fixtures | Minor | $500–3,000 |
| exterior siding · some discoloration | Minor | $500–3,000 |
| Total estimated repair cost · 3 items | $1,500–9,000 |
Value-add ROI direction
- Resale update kitchen cabinets — modernizing kitchen ↑
- Resale update bathroom fixtures — modernizing bathroom ↑
- Resale paint exterior — enhancing curb appeal ↑
- Both replace carpet — improving comfort and appearance ↑
ⓘ Cost ranges are severity-bucket heuristics (US national rule-of-thumb). Get contractor quotes + a written scope before underwriting a rehab budget.
Schools (NCES district)
- District
- Tuscaloosa City
- NCES district ID
- 0103360
- Math proficiency
- 19% ▼ -24.00%
- Reading proficiency
- 40% ▼ -1.00%
- Median HH income
- $37,474
- Composite
- 24.51/100
- National rank
- #7647
- State rank
- #74 of 129 in AL
Livability — Tuscaloosa
- Score
- 77/100
- State rank
- #9
- US rank
- #2909
Category grades
Schools grade is shown separately in the Schools card above.
Census & demographics
- Census place
- Tuscaloosa, AL
- County
- Tuscaloosa County · 206,491 people
- City population
- 134,228
- Metro
- Tuscaloosa, AL
- Population (ZIP)
- 22,445
- Household income
- $48,932
- Rent vs Own
- Severe rent burden
- 1531.0
Population outlook (Tuscaloosa County) Hauer SSP2
- Today (2025)
- 228,293 people
- By 2030
- 240,551 · +5.4%
- By 2040
- 263,856 · +15.6%
- By 2050
- 286,491 · +25.5%
- By 2075
- 335,783 · +47.1%
- By 2100
- 370,520 · +62.3%
Race, ethnicity, and origin ACS 2023
- Neighborhood character
- Diverse neighborhood (Simpson 0.59)
- Race & ethnicity
- Black 46% White 44% Hispanic / Latino 8% Two or more races 5% Asian 1%
- Hispanic origin (detail)
- Mexican 8%
- Common ancestry
- Italian 2% Slovak 1% Serbian 1%
- Foreign-born
- 6% · Canada, South Korea
- Languages at home
- 91% English-only · Spanish 7%
Political lean MEDSL · Tuscaloosa
- 2024 margin
- Strong R (+20.4) · D 39.4% · R 59.8%
- 2008→2024 swing
- -4.4pp toward R · 2008: -16.0pp · 2024: -20.4pp
- All cycles
- 2024: R+20.4 2020: R+14.8 2016: R+19.5 2012: R+17.4 2008: R+16.0
Not yet ingested
- Civics
- —
Market trends
- HPI YoY
- ▼ -103.00%
- Current HPI
- 170.026
- Rent YoY
- ▲ 6.81%
- Metro
- Tuscaloosa, AL
- State GDP YoY
- ▲ 2.94%
- F500 in state
- 4
Industry mix (Fortune 500 HQ in AL)
| Industry | F500 HQs | Revenue |
|---|---|---|
| Financial Services | 1 | $8B |
|
||
| Healthcare | 1 | $5B |
|
||
Price history
1 event — show timeline
- 2026-05-20 Listed $125,000 WAMLS
Cash-flow waterfall
monthlySold comps — $/sqft
last 12 mo · ≤1 miLoading sold comps…