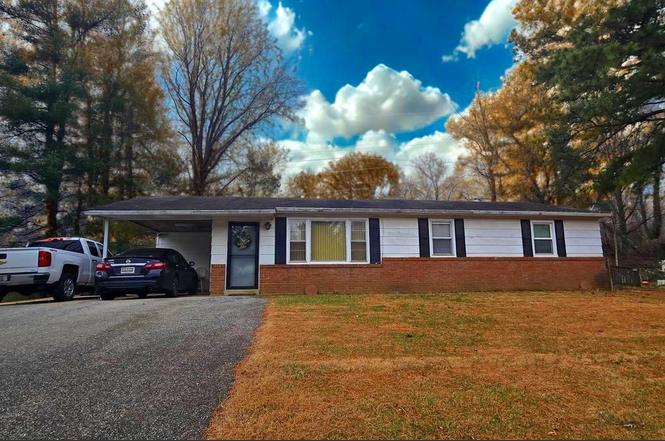
2209 Brown Station Rd · Brown Station, MD
Flood risk 1/10 · Minimal
- FEMA flood zone
- X (unshaded)
- Chance of flooding over 30 yrs
- 0.0%
- Est. flood insurance / yr
- $507 – $1,088
Fire risk 4/10 · Minor
- Est. fire insurance / yr
- $755 – $1,403
Heat risk 8/10 · Major
- Hot days now (above 103°F)
- 7 days/yr
- Hot days in 30 yrs
- 16 days/yr
Wind risk 5/10 · Moderate
- Chance of severe wind over 30 yrs
- 25.0%
Air-quality risk 4/10 · Minor
- Unhealthy air days now
- 4 days/yr
- Unhealthy air days in 30 yrs
- 5 days/yr
Risk factors via First Street. Map © Google.
Why this score? — see what drove the C grade
The composite is a weighted blend of 9 inputs, each scored 0–100. Each bar is that input's sub-score; the figure is the points it added to the 100-point composite (weight × sub-score).
- Cash flow +26.0/30.0
- DSCR +8.7/10.0
- ARV discount +7.5/15.0
- 1% rule +6.9/10.0
- Rent growth +3.6/5.0
- Livability +2.5/5.0
- Condition / age +2.5/5.0
- Schools +1.7/10.0
- Appreciation +0.0/10.0
$243,250
🖨 Deal sheet (PDF) 📄 Offer letter ✓ Due diligence
Listing remarks
Welcome to 2209 Brown Station Road! This is a short sale opportunity on a 3-bedroom, 2-bath rambler offering a single-level traditional floor plan and great potential. The property requires updates and renovations and is ideal for buyers looking to customize or improve a home. There is an added bonus room currently used as a den in addition to an attached shed that adds functional space and offers potential for enhancement into a sunroom or multipurpose area. Use and conversion subject to buyer due diligence and local requirements. Features include a functional layout with well-proportioned rooms and the convenience of one-level living. Property is being sold strictly as-is; seller will mak
Key facts
- 0.46 acre lot
- Parking
- Built 1962
Neighborhood map
What this means for you Summary
Snapshot
- This is a 3-bed/2.0-bath single-family listed at $243k.
Deal economics
- At list price, monthly cash flow is $603 ($7k/yr) — positive.
- The deal already cash-flows at list — no discount required.
- Meets the 1% rule at list price ($3k rent vs $243k).
Location & tenants
- Location reads: area grade C — affects rentability + tenant quality, not the cash-flow math above.
- Prince George'S County Public Schools (suburban): math 8% / reading 24% proficiency, ranked #21 of 24 in MD (top 88%) — low school quality limits family demand, transient renter base, plan for 1-2y turnover.
- Zoned schools: Arrowhead Elementary (math 2% / reading 8%, grade F, #766 of 860 statewide, top 93%, 406 students, 76% FRL); James Madison Middle (math 4% / reading 27%, grade F, #190 of 225 statewide, top 85%, 873 students, 62% FRL); Largo High (math 14% / reading 38%, grade F, #162 of 222 statewide, top 73%, 939 students, 66% FRL).
- Market conditions: Rents rising fast (+4.5%/yr); 330 active listings in the ZIP; 3 comparable units currently listed for rent nearby; rentals at typical pace (median 26d on market — plan ~3-4 weeks tenant-placement turnaround); high-income renter base; 1,481 units permitted in Prince George's County in 2024 (0 in 5+ unit buildings).
Forward outlook
- Local home prices are declining (-3.0%/yr); year-one equity from $2k of loan paydown is wiped out by about $7k of value loss. Plan a longer hold.
- Prince George's County population projected at +18% by 2050 — long-run rental-demand tailwind backs the buy-and-hold thesis.
- At projected returns (-3.0% appreciation + 4.5% rent growth), your $68k cash investment doubles in ~9 years — after that, you're playing with house money.
Negotiation context
- Only 3 days on market — expect competitive offers; lowballing is unlikely to land.
- Current owner paid $125k; list at $243k implies a 95% gain — meaningful room to come down on a strong offer.
Risks & watch-outs
- Climate carrying-cost: moderate wind risk, 25% chance of damaging wind over 30y; extreme-heat days projected 7→16/yr by 2055 (HVAC capex compounding) — expect insurance premiums to compound above CPI over the hold.
Questions for the listing agent
- Built in 1962 — when were the roof, HVAC, electrical panel, plumbing, and water heater last replaced?
- Is there a deadline driving the sale (1031 exchange, divorce, estate, relocation)? That informs how much negotiation room exists.
- What's the average days-on-market for RENTAL listings here right now (not sales)? A rising rental-DOM trend means longer vacancies and softer asking-rent achievability than the comps imply.
- What's the recent tenant-quality profile in this submarket — average credit score on applications, eviction rate, late-payment / NSF rate, and stable-employment percentage? A property-management company in the area should have these aggregated.
- How much new for-sale + rental construction is in the pipeline within 1–3 miles? Heavy new supply typically softens prices + rents 12–24 months out; constrained supply supports both.
Investment metrics
- 1% rule
- 1.19% ✓
- Cap rate
- 9.27%
- Cash-on-cash
- 10.62%
- DSCR
- 1.47
- GRM
- 7.0
CMA / ARV
No comps found within radius.
Projected returns pro-forma
-3.0% appreciation · 4.49% rent growth · sell at horizon
- IRR
- 1.3%
- Equity multiple
- 1.05×
- Total profit
- $3,423
- Equity at exit
- $36,269
- IRR
- 12.4%
- Equity multiple
- 2.05×
- Total profit
- $71,256
- Equity at exit
- $21,032
Cash invested: $68,110 (down + closing). Projections, not guarantees.
Landlord ↔ Tenant lean methodology
- Overall (STATE)
- 27 Tenant-Leaning
- State Maryland
- 27 Tenant-Leaning · D+14
- County
- — inherits STATE
- City
- — inherits STATE
ZIP-level market 20774
- Rents YoY
- 4.5%
- Active inventory
- 330
- Price-to-rent
- 7.0×
Monthly cashflow live
- Estimated rent
- $2,899 medium interval (Pro) →
- Mortgage (P&I)
- −$1,276
- Tax from tax record
- −$311 /mo · $3,729/yr
- Insurance
- −$101
- HOA
- −$0
- Vacancy / Maint / Mgmt
- −$609
- Net cashflow
- $603
Break-even live
Sensitivity live
| Price | -10% $740 | -5% $671 | +0% $603 | +5% $534 | +10% $465 |
|---|---|---|---|---|---|
| Rent | -10% $374 | -5% $488 | +0% $603 | +5% $717 | +10% $832 |
| Rate | -1.0pp $725 | -0.5pp $664 | base $603 | +0.5pp $540 | +1.0pp $475 |
UW: 25.0% down · 7.5% · 30yr · 1.5% tax · 5.0% vac · 8.0% maint · 8.0% mgmt
Financing live
Cash to close
- Down payment
- $60,812
- Closing costs
- $7,298
- Reserves months
- —
- Total cash needed
- —
Loan-product check · same deal, 3 products live
Conventional
25% down · 7.5% · 30yr
- Down + closing
- —
- Monthly P&I
- —
- Monthly cashflow
- —
- DSCR
- —
- Eligible?
- —
Personal DTI + credit; lowest rate.
DSCR
20% down · 8.5% · 30yr
- Down + closing
- —
- Monthly P&I
- —
- Monthly cashflow
- —
- DSCR
- —
- Eligible?
- —
No personal income docs; deal must DSCR.
Hard money
10% down · 12.0% · 12mo
- Down + closing
- —
- Monthly P&I
- —
- Monthly cashflow
- —
- DSCR
- —
- Eligible?
- —
Short-term bridge; refi at stabilization.
Rent comps 3 comps
| Address | Beds | Baths | Sqft | Rent | $/sqft | DOM | Units | Dist |
|---|---|---|---|---|---|---|---|---|
| 1306 Wembley Dr Upper Marlboro, MD | 4.0 | 2.0 | 1280 | $3,550 | $2.77 | 12d | 1 | 1.14mi |
| 12250 Open View Ln #811 Upper Marlboro, MD | 2.0 | 2.5 | 1570 | $2,625 | $1.67 | 45d | 1 | 1.40mi |
| 1001 Treeland Way #501 Upper Marlboro, MD | 2.0 | 2.5 | 1570 | $2,700 | $1.72 | 25d | 1 | 1.42mi |
Listing history 6 events
-
2026-01-15status Pending
-
2026-01-12historical
-
2026-01-10$243,250 Active
-
2026-01-09historical $243,250
-
1996-07-01soldstatus $125,000
-
1987-04-10soldstatus $89,995
ⓘ Source: listings_history table (triggers on properties + properties_extension) + one-shot
backfill from property_details.listing_events for pre-trigger history.
Tax reassessment forecast MD · Partial reset (capped growth)
- Current annual tax
- $3,729 · $311/mo
- Projected year-2 tax
- $3,729 · $311/mo
- Expected delta
- $0/yr ($0/mo · 0.0%)
ⓘ Screening estimate from a state-policy table — verify with the county assessor before closing.
Climate risk First Street
- Flood 1/10 Low FEMA zone X (unshaded) · 0% chance over 30 yrs
- Wildfire 4/10 Moderate
- Heat 8/10 Severe 7 d/yr ≥103°F today · 16 d/yr by 30 yrs out
- Wind 5/10 Major 25% chance of damaging wind over 30 yrs
- Air quality 4/10 Moderate 4 unhealthy d/yr today · 5 by 30 yrs out
Nearby sold comps map
Loading sold comps map…
Walkable amenities ~0.75 mi
Loading nearby amenities…
Taxation est. · year 1
- Rental income
- $34,790
- − Mortgage interest
- −$13,626
- − Property taxes
- −$3,729
- − Insurance
- −$1,216
- − Repairs & maintenance
- −$2,783
- − Management
- −$2,783
- − Depreciation
- −$7,076
- Taxable income
- $3,576
- Est. tax owed @ 24.0%
- −$858
- After-tax cash flow
- $6,373/yr
For passive investors: Depreciation is non-cash, so a rental often shows a tax loss while cash-flowing — sheltering income. Rental losses are passive: they offset passive income freely, and up to $25,000/yr can offset ordinary (W-2) income if you actively participate and your MAGI is under $100k (phasing out to $0 by $150k); unused losses carry forward. On sale, claimed depreciation is recaptured at up to 25%, and gains may owe capital-gains tax (a 1031 exchange can defer both). Figures are a year-1 estimate at your 24.0% rate — not tax advice; consult a CPA.
Schools (NCES district)
- District
- Prince George'S County Public Schools
- NCES district ID
- 2400510
- Math proficiency
- 8% ▼ -11.00%
- Reading proficiency
- 24% ▼ -9.00%
- Median HH income
- $73,967
- Composite
- 16.82/100
- National rank
- #9151
- State rank
- #21 of 24 in MD
Livability — Brown Station
No livability data for this city. (Only ~50 U.S. cities are tracked.)
Census & demographics
- Census place
- Brown Station, MD
- County
- Prince Georges County · 919,866 people
- Metro
- Washington-Arlington-Alexandria, DC-VA-MD-WV
- Population (ZIP)
- 51,816
- Household income
- $128,259
- Rent vs Own
- Severe rent burden
- 773.0
Population outlook (Prince George's County) Hauer SSP2
- Today (2025)
- 1,005,426 people
- By 2030
- 1,048,416 · +4.3%
- By 2040
- 1,123,425 · +11.7%
- By 2050
- 1,183,220 · +17.7%
- By 2075
- 1,306,202 · +29.9%
- By 2100
- 1,408,179 · +40.1%
Race, ethnicity, and origin ACS 2023
- Neighborhood character
- Predominantly Black (85%)
- Race & ethnicity
- Black 85% Two or more races 5% White 4% Hispanic / Latino 4% Asian 2%
- Common ancestry
- Lithuanian 1% Hispanic 1%
- Foreign-born
- 16% · Canada, United Kingdom
- Languages at home
- 86% English-only · Spanish 4% French/Haitian/Cajun 3% Tagalog/Filipino 1%
Political lean MEDSL · Prince George's
- 2024 margin
- Solid D (+75.2) · D 86.3% · R 11.2% · Other 2.5%
- 2008→2024 swing
- -3.3pp toward R · 2008: 78.5pp · 2024: 75.2pp
- All cycles
- 2024: D+75.2 2020: D+80.5 2016: D+81.0 2012: D+80.9 2008: D+78.5
Not yet ingested
- Civics
- —
Market trends
- HPI YoY
- ▼ -277.06%
- Current HPI
- 264.2372
- Rent YoY
- ▲ 4.49%
- Metro
- Washington-Arlington-Alexandria, DC-VA-MD-WV
- State GDP YoY
- ▲ 2.97%
- F500 in state
- 12
Industry mix (Fortune 500 HQ in MD)
| Industry | F500 HQs | Revenue |
|---|---|---|
| Aerospace / Defense | 1 | $71B |
|
||
| Utilities | 1 | $25B |
|
||
| Hotels | 1 | $24B |
|
||
| Consumer Goods | 1 | $7B |
|
||
| Real Estate | 1 | $6B |
|
||
| Chemicals | 1 | $2B |
|
||
Price history
+170.3% since first listed6 events — show timeline
- 2026-01-15 Pending — BRIGHT MLS
- 2026-01-12 Listing Removed — BRIGHT MLS
- 2026-01-10 Listed $243,250 BRIGHT MLS
- 2026-01-09 Coming Soon $243,250 BRIGHT MLS
- 1996-07-01 Sold (Public Records) $125,000 Public Records
- 1987-04-10 Sold (Public Records) $89,995 Public Records
Property tax history
+5.0%/yrLatest (2025): $3,729 · +5.7% YoY. Source: county tax records.
Cash-flow waterfall
monthlySold comps — $/sqft
last 12 mo · ≤1 miLoading sold comps…