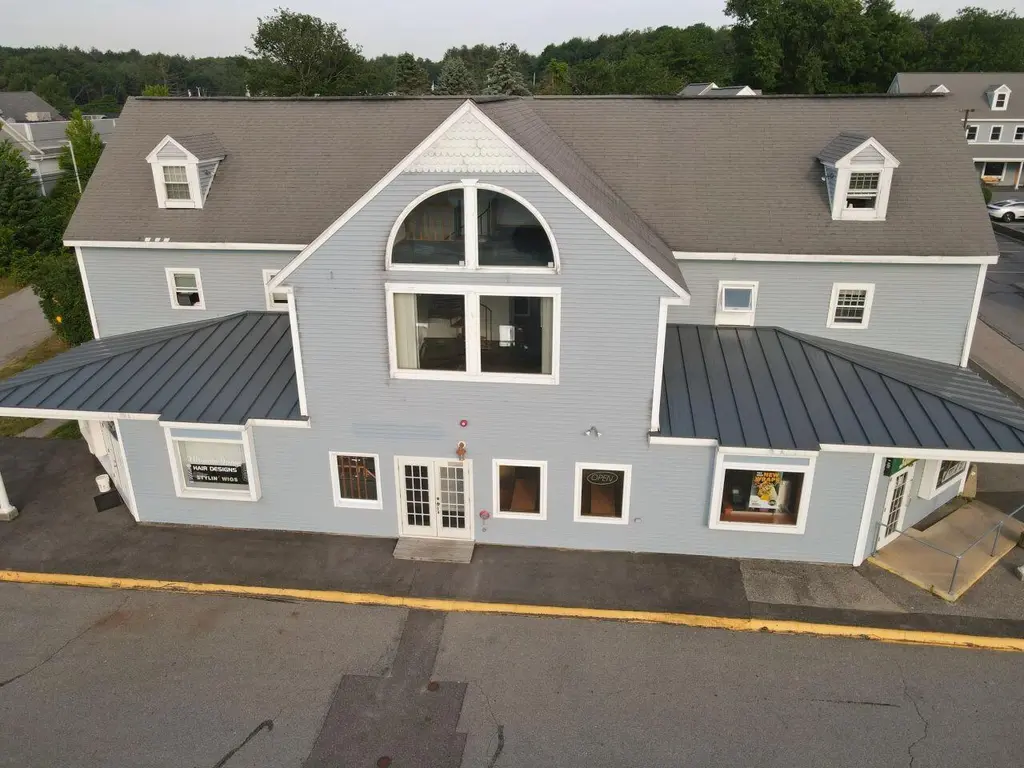
952 Post Rd #7 · Wells, ME
Flood risk 1/10 · Minimal
- FEMA flood zone
- X
- Chance of flooding over 30 yrs
- 0.0%
- Est. flood insurance / yr
- $507 – $1,088
Fire risk 2/10 · Minimal
- Est. fire insurance / yr
- $669 – $1,243
Heat risk 5/10 · Moderate
- Hot days now (above 87°F)
- 7 days/yr
- Hot days in 30 yrs
- 18 days/yr
Wind risk 6/10 · Moderate
- Chance of severe wind over 30 yrs
- 61.0%
Air-quality risk 2/10 · Minimal
- Unhealthy air days now
- 1 days/yr
- Unhealthy air days in 30 yrs
- 2 days/yr
Risk factors via First Street. Map © Google.
Why this score? — see what drove the B- grade
The composite is a weighted blend of 9 inputs, each scored 0–100. Each bar is that input's sub-score; the figure is the points it added to the 100-point composite (weight × sub-score).
- Cash flow +30.0/30.0
- 1% rule +10.0/10.0
- DSCR +10.0/10.0
- Schools +7.6/10.0
- Rent growth +2.5/5.0
- Livability +2.5/5.0
- Condition / age +2.5/5.0
- ARV discount +1.9/15.0
- Appreciation +0.0/10.0
$319,900
🖨 Deal sheet 📄 Offer letter ✓ Due diligence
Listing remarks
Refreshed 2nd story 2 level condo at Colonial Square at the heart of Wells retail district and minutes from area Beaches, and the local town vibe. The unit is a spacious open cathedral ceiling space with 2 bedrooms on one level and a large open living, dining and kitchen area plus a main bathroom and laundry area. The kitchen boasts stainless appliances and granite counters. A large 3rd floor space can be flex space for a 3rd BR , office or den. The cool Interior is complimented with light wood grain laminate floors and a calming light gray wall surface. Bonus for 1 year for the lucky owner a 1 year Gym membership at Millers Gym, right in the same complex. Live and work and work out right i
Key facts
- $460 HOA
- 21 parking spots
- Built 1987
Property features AI
Finance
- Other: Zoning: GB
- HOA & community: Community of 6 units; Monthly association fee of $460; No dogs allowed
Exterior
- Parking: On-site paved parking with 21+ spaces (common)
- Security: Fire system
- Utilities: Public water; Public sewer; Electric water heater (electric); Utilities currently on
- Home design: Condominium; Multi-level; Building faces the road; Built in 1987
- Construction: Wood frame construction with clapboard and vinyl siding; Composition shingle roof; Slab foundation
- Exterior features: Deck; Level lot; Sidewalks; Located in a business district, intown and near shopping, near public beach and golf course; Near turnpike/interstate and railroad; Retail strip nearby; Paved road
Interior
- Kitchen: Electric range; Microwave; Dishwasher; Refrigerator
- Bedrooms: Bedroom 1 on the first floor with closet; Bedroom 2 on the first floor with closet; Bonus room on the second floor
- Flooring: Laminate; Tile
- Bathrooms: 1 full bathroom
- Heating & cooling: Direct vent heater; Heat pump; Wall unit cooling; Circuit breaker electrical
- Interior features: First-floor bedroom; Bathtub; One-floor living; Internet access available; 5 total rooms
- Laundry & utility: Washer and dryer included; Laundry on the main level
Neighborhood map
What this means for you Summary
Snapshot
- This is a 2-bed/1.0-bath condo listed at $320k.
Deal economics
- At list price, monthly cash flow is $4k ($47k/yr) — positive.
- The deal already cash-flows at list — no discount required.
- Meets the 1% rule at list price ($8k rent vs $320k).
- Recommended offer: $310k (3.0% below list) — sets the bar for market timing.
Location & tenants
- Location reads: area grade B — affects rentability + tenant quality, not the cash-flow math above.
- Wells-Ogunquit CSD (rural): math 87% / reading 90% proficiency, ranked #32 of 112 in ME (top 29%) — strong family-tenant draw, lease renewals of 3-5y typical; only 17% free/reduced lunch — higher-income household profile.
- Market conditions: 267 active listings in the ZIP; 1 comparable units currently listed for rent nearby; 1,386 units permitted in York County in 2024 (338 in 5+ unit buildings).
Forward outlook
- Local home prices are declining (-3.0%/yr); year-one equity from $2k of loan paydown is wiped out by about $10k of value loss. Plan a longer hold.
- At projected returns (-3.0% appreciation + 3.0% rent growth), your $90k cash investment doubles in ~3 years — after that, you're playing with house money.
Negotiation context
- It's been on market 35 days — a 3% lower offer ($310k) is reasonable based on typical stale-listing flexibility.
- 10 sale attempts since 10y ago with the ask held roughly flat each time — persistent listings suggest the price (not the market) is what's stuck; bring a comps-based counter.
Risks & watch-outs
- Climate carrying-cost: major wind risk, 61% chance of damaging wind over 30y; extreme-heat days projected 7→18/yr by 2055 (HVAC capex compounding) — expect insurance premiums to compound above CPI over the hold.
Questions for the listing agent
- It's been on market 35 days. Have you received any prior offers? Is the seller open to a 3% concession, seller financing, or rate buy-down credit?
- What does the HOA fee cover, when was the last increase, and are there any pending special assessments or reserve-fund shortfalls?
- Any open or pending special assessments — roof, HVAC, plumbing, elevator, façade? What's the per-unit balance and payoff schedule, and is the seller paying it off at close or rolling it to the buyer?
- Is there a deadline driving the sale (1031 exchange, divorce, estate, relocation)? That informs how much negotiation room exists.
- What's the average days-on-market for RENTAL listings here right now (not sales)? A rising rental-DOM trend means longer vacancies and softer asking-rent achievability than the comps imply.
- What's the recent tenant-quality profile in this submarket — average credit score on applications, eviction rate, late-payment / NSF rate, and stable-employment percentage? A property-management company in the area should have these aggregated.
- How much new apartment / multifamily construction is in the pipeline within 1–3 miles? Heavy new supply (>2% of stock underway) typically softens rents 12–24 months out; light construction supports rent growth.
Investment metrics
- 1% rule
- 2.50% ✓
- Cap rate
- 20.90%
- Cash-on-cash
- 52.16%
- DSCR
- 3.32
- GRM
- 3.3
CMA / ARV
- ARV (median comp)
- $284,305
- List price
- $319,900
- Delta
- 12.52%
- Verdict
- OVERPRICED
- Comps
- 20 within 1.0 mi
Projected returns pro-forma
-3.0% appreciation · 3.0% rent growth · sell at horizon
- IRR
- 50.1%
- Equity multiple
- 3.19×
- Total profit
- $196,404
- Equity at exit
- $47,698
- IRR
- 55.6%
- Equity multiple
- 6.49×
- Total profit
- $491,368
- Equity at exit
- $27,659
Cash invested: $89,572 (down + closing). Projections, not guarantees.
Landlord ↔ Tenant lean methodology
- Overall (STATE)
- 41 Moderately Tenant-Leaning
- State Maine
- 41 Moderately Tenant-Leaning · D+2
- County
- — inherits STATE
- City
- — inherits STATE
ZIP-level market 04090
- Home prices YoY
- -20.0%
- Active inventory
- 267
- Price-to-rent
- 3.3×
Monthly cashflow live
- Estimated rent
- $7,992 medium interval (Pro) →
- Mortgage (P&I)
- −$1,678
- Tax from tax record
- −$149 /mo · $1,789/yr
- Insurance
- −$133
- HOA
- −$460
- Vacancy / Maint / Mgmt
- −$1,678
- Net cashflow
- $3,894
Break-even live
UW: 25.0% down · 7.5% · 30yr · 1.5% tax · 5.0% vac · 8.0% maint · 8.0% mgmt
Financing live
Cash to close
- Down payment
- $79,975
- Closing costs
- $9,597
- Reserves months
- —
- Total cash needed
- —
Loan-product check · same deal, 3 products live
Conventional
25% down · 7.5% · 30yr
- Down + closing
- —
- Monthly P&I
- —
- Monthly cashflow
- —
- DSCR
- —
- Eligible?
- —
Personal DTI + credit; lowest rate.
DSCR
20% down · 8.5% · 30yr
- Down + closing
- —
- Monthly P&I
- —
- Monthly cashflow
- —
- DSCR
- —
- Eligible?
- —
No personal income docs; deal must DSCR.
Hard money
10% down · 12.0% · 12mo
- Down + closing
- —
- Monthly P&I
- —
- Monthly cashflow
- —
- DSCR
- —
- Eligible?
- —
Short-term bridge; refi at stabilization.
Rent comps 1 comps
| Address | Beds | Baths | Sqft | Rent | $/sqft | DOM | Units | Dist |
|---|---|---|---|---|---|---|---|---|
| 392 Post Rd Unit 1532216P Wells, ME | 2.0 | 1.0 | 710 | $7,992 | $11.26 | 21d | 1 | 1.37mi |
HOA detail condo
- Monthly dues
- $460 · $5,520/yr
- Likely covers
- gym
- Assessments
- None detected in remarks — confirm with the listing agent.
Listing history 33 events
-
2026-06-18days on market $319,900 Active 35 DOM
-
2026-06-17days on market $319,900 Active 34 DOM
-
2026-06-16days on market $319,900 Active 33 DOM
-
2026-06-15days on market $319,900 Active 32 DOM
-
2026-06-14days on market $319,900 Active 30 DOM
-
2026-06-13days on market $319,900 Active 29 DOM
-
2026-06-10days on market $319,900 Active 27 DOM
-
2026-06-09days on market $319,900 Active 26 DOM
-
2026-06-08days on market $319,900 Active 25 DOM
-
2026-06-07days on market $319,900 Active 24 DOM
-
2026-06-05days on market $319,900 Active 21 DOM
-
2026-06-03days on market $319,900 Active 20 DOM
-
2026-06-02days on market $319,900 Active 19 DOM
-
2026-06-01days on market $319,900 Active 18 DOM
-
2026-05-31days on market $319,900 Active 17 DOM
-
2026-05-30days on market $319,900 Active 16 DOM
-
2026-05-15historical $2,500
-
2026-05-14$319,900 Active 981-char remark
-
2026-05-13$2,500
-
2024-09-18historical $2,500
-
2024-06-21$2,500
-
2023-12-11soldstatus $299,900 Closed 321-char remark
-
2023-12-07status Pending 321-char remark
-
2023-11-24status Pending 321-char remark
-
2023-11-21historical Active Under Contract 321-char remark
-
2023-11-13price $299,900 321-char remark
-
2023-10-16$335,000 Active 321-char remark
-
2019-12-09soldstatus $196,000 Closed
-
2019-11-08status Pending - Continue to Show
-
2019-10-28$199,000 Active
-
2019-04-05soldstatus $193,000 Closed
-
2019-03-20status Pending
-
2019-03-09$199,000 Active
ⓘ Source: listings_history table (triggers on properties + properties_extension) + one-shot
backfill from property_details.listing_events for pre-trigger history.
Tax reassessment forecast ME · Partial reset (capped growth)
- Current annual tax
- $1,789 · $149/mo
- Projected year-2 tax
- $3,070 · $256/mo
- Expected delta
- +$1,281/yr (+$107/mo · 71.6%)
ⓘ Screening estimate from a state-policy table — verify with the county assessor before closing.
Climate risk First Street
- Flood 1/10 Low FEMA zone X · 0% chance over 30 yrs
- Wildfire 2/10 Low
- Heat 5/10 Major 7 d/yr ≥87°F today · 18 d/yr by 30 yrs out
- Wind 6/10 Major 61% chance of damaging wind over 30 yrs
- Air quality 2/10 Low 1 unhealthy d/yr today · 2 by 30 yrs out
Nearby sold comps map
Loading sold comps map…
Walkable amenities ~0.75 mi
Loading nearby amenities…
Taxation est. · year 1
- Rental income
- $95,904
- − Mortgage interest
- −$17,919
- − Property taxes
- −$1,789
- − Insurance
- −$1,600
- − Repairs & maintenance
- −$7,672
- − Management
- −$7,672
- − HOA
- −$5,520
- − Depreciation
- −$9,306
- Taxable income
- $44,425
- Est. tax owed @ 24.0%
- −$10,662
- After-tax cash flow
- $36,063/yr
For passive investors: Depreciation is non-cash, so a rental often shows a tax loss while cash-flowing — sheltering income. Rental losses are passive: they offset passive income freely, and up to $25,000/yr can offset ordinary (W-2) income if you actively participate and your MAGI is under $100k (phasing out to $0 by $150k); unused losses carry forward. On sale, claimed depreciation is recaptured at up to 25%, and gains may owe capital-gains tax (a 1031 exchange can defer both). Figures are a year-1 estimate at your 24.0% rate — not tax advice; consult a CPA.
Schools (NCES district)
- District
- Wells-Ogunquit CSD
- NCES district ID
- 2313490
- Math proficiency
- 87% ▲ 42.00%
- Reading proficiency
- 90% ▲ 26.00%
- Median HH income
- $61,341
- Composite
- 75.79/100
- National rank
- #125
- State rank
- #32 of 112 in ME
Livability — Wells
No livability data for this city. (Only ~50 U.S. cities are tracked.)
Census & demographics
- Population (ZIP)
- 11,544
Population outlook (York County) Hauer SSP2
- Today (2025)
- 209,961 people
- By 2030
- 212,816 · +1.4%
- By 2040
- 214,360 · +2.1%
- By 2050
- 210,350 · +0.2%
- By 2075
- 201,686 · -3.9%
- By 2100
- 183,392 · -12.7%
Race, ethnicity, and origin ACS 2023
- Neighborhood character
- Predominantly White (89%)
- Race & ethnicity
- White 89% Two or more races 5% Black 3% Asian 1%
- Common ancestry
- Lithuanian 11% Romanian 3% Slovak 3%
- Foreign-born
- 5% · Canada, China
- Languages at home
- 94% English-only · Other Indo-European 1% French/Haitian/Cajun 1% Other Asian/Pacific 1%
Political lean MEDSL · York
- 2024 margin
- D (+10.5) · D 54.3% · R 43.8% · Other 1.9%
- 2008→2024 swing
- -10.1pp toward R · 2008: 20.5pp · 2024: 10.5pp
- All cycles
- 2024: D+10.5 2020: D+12.6 2016: D+4.8 2012: D+16.4 2008: D+20.5
Not yet ingested
- Civics
- —
Market trends
- HPI YoY
- ▼ -103.52%
- Current HPI
- 413.9951
- Rent YoY
- —
- Metro
- —
- State GDP YoY
- —
- F500 in state
- 0
Price history
-95.8% since first listed26 events — show timeline
- 2026-05-15 Rental Removed $2,500 RENTSPREE
- 2026-05-14 Listed $319,900 MREIS
- 2026-05-13 Listed for Rent $2,500 RENTSPREE
- 2024-11-15 Delisted — MREIS
- 2024-10-22 Listed $330,000 MREIS
- 2024-09-18 Rental Removed $2,500 RENTSPREE
- 2024-06-21 Listed for Rent $2,500 RENTSPREE
- 2024-06-13 Delisted — MREIS
- 2024-05-16 Pending — MREIS
- 2024-05-11 Relisted — MREIS
- 2024-05-02 Delisted — MREIS
- 2024-04-11 Listed $330,000 MREIS
- 2023-12-11 Sold (MLS) $299,900 MREIS
- 2023-12-07 Pending — MREIS
- 2023-11-24 Pending — MREIS
- 2023-11-21 Contingent — MREIS
- 2023-11-13 Price Changed $299,900 MREIS
- 2023-10-16 Listed $335,000 MREIS
- 2019-12-09 Sold (MLS) $196,000 MREIS
- 2019-11-08 Pending — MREIS
- 2019-10-28 Listed $199,000 MREIS
- 2019-04-05 Sold (MLS) $193,000 MREIS
- 2019-03-20 Pending — MREIS
- 2019-03-09 Listed $199,000 MREIS
- 2017-01-03 Delisted — MREIS
- 2016-06-17 Listed $59,000 MREIS
Property tax history
+12.3%/yrLatest (2025): $1,789 · +18.3% YoY. Source: county tax records.
Cash-flow waterfall
monthlySold comps — $/sqft
last 12 mo · ≤1 miLoading sold comps…