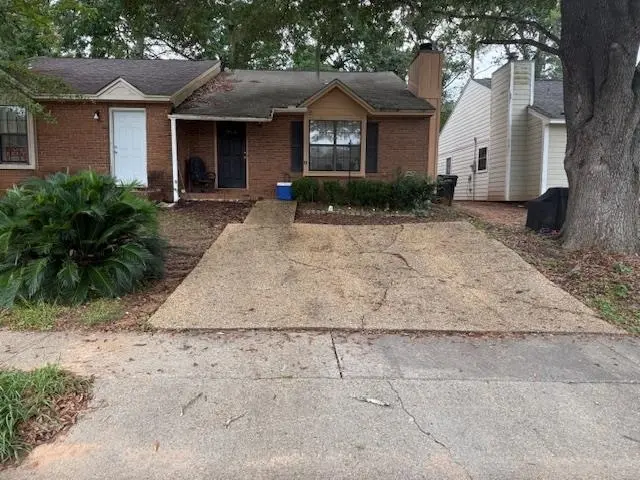
1210 Copper Creek Dr · Tallahassee, FL
Flood risk 1/10 · Minimal
- FEMA flood zone
- X (unshaded)
- Chance of flooding over 30 yrs
- 0.0%
- Est. flood insurance / yr
- $507 – $1,088
Fire risk 4/10 · Minor
- Est. fire insurance / yr
- $947 – $1,759
Heat risk 8/10 · Major
- Hot days now (above 108°F)
- 7 days/yr
- Hot days in 30 yrs
- 20 days/yr
Wind risk 9/10 · Severe
- Chance of severe wind over 30 yrs
- 99.0%
Air-quality risk 4/10 · Minor
- Unhealthy air days now
- 6 days/yr
- Unhealthy air days in 30 yrs
- 7 days/yr
Risk factors via First Street. Map © Google.
Why this score? — see what drove the F grade
The composite is a weighted blend of 9 inputs, each scored 0–100. Each bar is that input's sub-score; the figure is the points it added to the 100-point composite (weight × sub-score).
- Cash flow +12.3/30.0
- Schools +4.3/10.0
- Livability +4.3/5.0
- Rent growth +3.9/5.0
- DSCR +3.6/10.0
- 1% rule +3.3/10.0
- Condition / age +2.5/5.0
- ARV discount +0.0/15.0
- Appreciation +0.0/10.0
$195,000
🖨 Deal sheet (PDF) 📄 Offer letter ✓ Due diligence
Listing remarks
One or more photos is virtually enhanced. SELLER WILL PAY $5000 IN CLOSING COSTS OR UPDATES! Price Reduced for a Quick Sale at $195,000 Conveniently Located in the Copper Creek Subdivision 2BR/2BA Townhome Great opportunity to add your personal touch to this well-located townhome featuring 2 bedrooms, 2 baths, and a privacy-fenced backyard with a nice outdoor space for relaxing or play. The home has a great floor plan and is the largest townhome in Copper Creek neighborhood, (approx. 24 sq. ft. larger than recent sales). Bay window in kitchen for natural light. Wood-burning fireplace, inside laundry room, exterior painted in 2025 and fan above stove is vented to the outside. New HVAC in 202
Key facts
- Outdoor space
- Inside laundry room
- Parking
Tags
Property features AI
Finance
- Financial info: Offered for sale
Exterior
- Parking: Driveway
- Utilities: Publicly maintained road access
- Home design: Single-story; Brick construction
- Construction: Brick exterior
- Exterior features: Patio
Interior
- Kitchen: Dishwasher; Disposal; Microwave; Oven; Range; Refrigerator
- Bedrooms: Bedroom 2 (11x10)
- Flooring: Carpet
- Bathrooms: 2 full bathrooms
- Heating & cooling: Heat pump heating; Central air; Ceiling fans
- Interior features: Fireplace; Carpet flooring
Neighborhood map
What this means for you Summary
Snapshot
- This is a 2-bed/2.0-bath townhouse listed at $195k.
Deal economics
- At list price, monthly cash flow is $-37 ($-448/yr) — negative.
- To cash-flow at today's rent, offer at most $188k (3.4% below list).
- To meet the 1% rule (rent ≥ 1% of price), the offer needs to be $163k (16.5% below list).
- Recommended offer: $163k (16.5% below list) — sets the bar for 1% rule.
- Cap rate 6.1% vs local median 4.2% in Tallahassee — top-decile yield for the area; either an underpriced asset or a hidden risk that comps aren't pricing in. Stress-test before assuming the spread holds.
Location & tenants
- Location reads 86/100 on livability (#19 in FL, #429 nationally) — a professional / high-income tenant draw. Strengths: amenities A+, commute A+, health & safety A+; Watch: employment D.
- Leon (urban): math 48% / reading 53% proficiency, ranked #33 of 73 in FL (top 45%) — acceptable for families but not a draw, mixed tenant base, ~2y average lease.
- Zoned schools: Apalachee Elementary School (math 31% / reading 36%, grade F, #1,758 of 2,144 statewide, top 83%, 544 students, 72% FRL); Fairview Middle School (math 44% / reading 46%, grade D, #310 of 571 statewide, top 56%, 747 students, 58% FRL); Lincoln High School (math 37% / reading 54%, grade D-, #223 of 667 statewide, top 34%, 1,861 students, 28% FRL).
- Market conditions: Rents rising fast (+5.5%/yr); 118 active listings in the ZIP; 8 comparable units currently listed for rent nearby; rentals at typical pace (median 16d on market — plan ~3-4 weeks tenant-placement turnaround); solid renter incomes; 1,765 units permitted in Leon County in 2024 (975 in 5+ unit buildings).
Forward outlook
- Local home prices are declining (-3.0%/yr); year-one equity from $1k of loan paydown is wiped out by about $6k of value loss. Plan a longer hold.
- Leon County population projected at +23% by 2050 — long-run rental-demand tailwind backs the buy-and-hold thesis.
Negotiation context
- It's been on market 20 days — a 2% lower offer ($192k) is reasonable based on typical stale-listing flexibility.
- Current owner paid $70k; list at $195k implies a 180% gain — meaningful room to come down on a strong offer.
Risks & watch-outs
- Climate carrying-cost: severe wind risk, 99% chance of damaging wind over 30y; extreme-heat days projected 7→20/yr by 2055 (HVAC capex compounding) — expect insurance premiums to compound above CPI over the hold.
Questions for the listing agent
- What do current leases actually rent for vs. the listed asking? Can we see a recent rent roll and the last 12 months of T-12 income?
- Is there a deadline driving the sale (1031 exchange, divorce, estate, relocation)? That informs how much negotiation room exists.
- Schools are B-rated — typically a magnet for longer-tenancy family renters. What's the average tenant stay here, and is there a school-zone premium baked into asking?
- The area grade is low — what's the realistic commute time and amenity access for the typical tenant pool here? Any planned neighborhood developments (good or bad) we should know about?
- What's the average days-on-market for RENTAL listings here right now (not sales)? A rising rental-DOM trend means longer vacancies and softer asking-rent achievability than the comps imply.
- What's the recent tenant-quality profile in this submarket — average credit score on applications, eviction rate, late-payment / NSF rate, and stable-employment percentage? A property-management company in the area should have these aggregated.
- How much new for-sale + rental construction is in the pipeline within 1–3 miles? Heavy new supply typically softens prices + rents 12–24 months out; constrained supply supports both.
Investment metrics
- 1% rule
- 0.83% ✗
- Cap rate
- 6.06%
- Cash-on-cash
- -0.82%
- DSCR
- 0.96
- GRM
- 10.0
CMA / ARV
- ARV (on-the-fly)
- $140,352
- Comps found
- 12
Show comp detail 12 sales within ~0.75 mi
| Address | Dist | Beds/Ba | Sqft | Sold | Price | $/sf | Match |
|---|---|---|---|---|---|---|---|
| 1053 Copper Creek Dr | 0.21mi | 2/2.0 | 1,008 (-2%) | 3mo | $208,000 | $206 | 84 |
| 1064 Copper Creek Dr Unit B | 0.23mi | 2/2.0 | 1,008 (-2%) | 3mo | $204,000 | $202 | 83 |
| 3742 Rockbrook Dr | 0.27mi | 2/2.0 | 1,000 (-3%) | 1mo | $120,000 | $120 | 81 |
| 1029 Copper Creek Dr | 0.24mi | 2/2.0 | 1,008 (-2%) | 5mo | $200,000 | $198 | 81 |
| 3706 Aksarben Dr | 0.21mi | 2/1.5 | 992 (-4%) | 2mo | $135,000 | $136 | 80 |
| 1018 Crossing Brook Way | 0.22mi | 2/1.0 | 992 (-4%) | 2mo | $128,000 | $129 | 78 |
| 3708 Rockbrook Dr Unit B | 0.27mi | 2/1.5 | 960 (-7%) | 4mo | $137,000 | $143 | 71 |
| 3729 Sutor Ct | 0.12mi | 2/1.0 | 920 (-11%) | 4mo | $117,500 | $128 | 69 |
| 3725 Sutor Ct | 0.12mi | 2/1.0 | 912 (-12%) | 4mo | $117,500 | $129 | 67 |
| 1560 Twin Lakes Cir | 0.40mi | 2/1.5 | 1,096 (+6%) | 4mo | $83,000 | $76 | 66 |
| 1218 Brafforton Dr | 0.61mi | 2/2.0 | 1,008 (-2%) | 3mo | $215,000 | $213 | 65 |
| 1556 Twin Lakes Cir | 0.42mi | 2/1.5 | 1,096 (+6%) | 4mo | $145,000 | $132 | 65 |
Match score weights: distance 35% · size 25% · config 20% · recency 20%. Top-matched comps best support the ARV.
Projected returns pro-forma
-3.0% appreciation · 5.55% rent growth · sell at horizon
- IRR
- -14.9%
- Equity multiple
- 0.46×
- Total profit
- $-29,686
- Equity at exit
- $29,075
- IRR
- -2.5%
- Equity multiple
- 0.81×
- Total profit
- $-10,361
- Equity at exit
- $16,860
Cash invested: $54,600 (down + closing). Projections, not guarantees.
Landlord ↔ Tenant lean methodology
- Overall (STATE)
- 87 Strongly Landlord-Friendly
- State Florida
- 87 Strongly Landlord-Friendly · R+3
- County
- — inherits STATE
- City
- — inherits STATE
ZIP-level market 32311
- Home prices YoY
- -27.5%
- Rents YoY
- 5.5%
- Active inventory
- 118
- Price-to-rent
- 10.0×
Monthly cashflow live
- Estimated rent
- $1,627 high interval (Pro) →
- Mortgage (P&I)
- −$1,023
- Tax from tax record
- −$219 /mo · $2,631/yr
- Insurance
- −$81
- HOA
- −$0
- Vacancy / Maint / Mgmt
- −$342
- Net cashflow
- $-37
Break-even live
Sensitivity live
| Price | -10% $73 | -5% $18 | +0% $-37 | +5% $-93 | +10% $-148 |
|---|---|---|---|---|---|
| Rent | -10% $-166 | -5% $-102 | +0% $-37 | +5% $27 | +10% $91 |
| Rate | -1.0pp $61 | -0.5pp $12 | base $-37 | +0.5pp $-88 | +1.0pp $-139 |
UW: 25.0% down · 7.5% · 30yr · 1.5% tax · 5.0% vac · 8.0% maint · 8.0% mgmt
Financing live
Cash to close
- Down payment
- $48,750
- Closing costs
- $5,850
- Reserves months
- —
- Total cash needed
- —
Loan-product check · same deal, 3 products live
Conventional
25% down · 7.5% · 30yr
- Down + closing
- —
- Monthly P&I
- —
- Monthly cashflow
- —
- DSCR
- —
- Eligible?
- —
Personal DTI + credit; lowest rate.
DSCR
20% down · 8.5% · 30yr
- Down + closing
- —
- Monthly P&I
- —
- Monthly cashflow
- —
- DSCR
- —
- Eligible?
- —
No personal income docs; deal must DSCR.
Hard money
10% down · 12.0% · 12mo
- Down + closing
- —
- Monthly P&I
- —
- Monthly cashflow
- —
- DSCR
- —
- Eligible?
- —
Short-term bridge; refi at stabilization.
Rent comps 8 comps
| Address | Beds | Baths | Sqft | Rent | $/sqft | DOM | Units | Dist |
|---|---|---|---|---|---|---|---|---|
| 3909 Reserve Dr Tallahassee, FL | 1.0–3.0 | 1.0–2.0 | 1220 | $1,588 | $1.30 | 15d | 1 | 0.21mi |
| 3373 Apalachee Pkwy Tallahassee, FL | 1.0–2.0 | 1.0–2.0 | 779 | $1,258 | $1.61 | 15d | 1 | 0.54mi |
| 3148 Dick Wilson Blvd Tallahassee, FL | 1.0–3.0 | 1.0–2.0 | 1536 | $1,782 | $1.16 | 15d | 14 | 0.78mi |
| 1736 Augustine Pl Tallahassee, FL | 3.0 | 2.0 | 1400 | $2,000 | $1.43 | 23d | 1 | 1.35mi |
| 1497 Wooster Dr Tallahassee, FL | 2.0–3.0 | 2.0–3.0 | 1238 | $1,810 | $1.46 | 15d | 6 | 1.42mi |
| 2750 Old Saint Augustine Rd Tallahassee, FL | 1.0–3.0 | 1.0–2.0 | 1230 | $1,589 | $1.29 | 23d | 2 | 1.42mi |
| 2912 Capital Park Dr Tallahassee, FL | 3.0 | 2.0 | 1236 | $1,650 | $1.33 | 15d | 1 | 1.44mi |
| 2850 Apalachee Pkwy Tallahassee, FL | 1.0 | 1.0 | 750 | $1,395 | $1.86 | 15d | 46 | 1.46mi |
Listing history 16 events
-
2026-06-22days on market $195,000 Active 20 DOM
-
2026-06-18days on market $195,000 Active 17 DOM
-
2026-06-17days on market $195,000 Active 16 DOM
-
2026-06-16days on market $195,000 Active 15 DOM
-
2026-06-15days on market $195,000 Active 14 DOM
-
2026-06-14days on market $195,000 Active 12 DOM
-
2026-06-10days on market $195,000 Active 9 DOM
-
2026-06-09days on market $195,000 Active 8 DOM
-
2026-06-08days on market $195,000 Active 7 DOM
-
2026-06-07days on market $195,000 Active 6 DOM
-
2026-06-05remarks 699-char remark
-
2026-06-05days on market $195,000 Active 3 DOM
-
2026-06-03days on market $195,000 Active 2 DOM
-
2026-06-03remarks 686-char remark
-
2026-06-02remarks 664-char remark
-
2026-06-02$195,000 Active 1 DOM
ⓘ Source: listings_history table (triggers on properties + properties_extension) + one-shot
backfill from property_details.listing_events for pre-trigger history.
Tax reassessment forecast FL · Resets to sale price
- Current annual tax
- $2,631 · $219/mo
- Projected year-2 tax
- $2,631 · $219/mo
- Expected delta
- $0/yr ($0/mo · 0.0%)
ⓘ Screening estimate from a state-policy table — verify with the county assessor before closing.
Climate risk First Street
- Flood 1/10 Low FEMA zone X (unshaded) · 0% chance over 30 yrs
- Wildfire 4/10 Moderate
- Heat 8/10 Severe 7 d/yr ≥108°F today · 20 d/yr by 30 yrs out
- Wind 9/10 Extreme 99% chance of damaging wind over 30 yrs
- Air quality 4/10 Moderate 6 unhealthy d/yr today · 7 by 30 yrs out
Nearby sold comps map
Loading sold comps map…
Walkable amenities ~0.75 mi
Loading nearby amenities…
Taxation est. · year 1
- Rental income
- $19,530
- − Mortgage interest
- −$10,923
- − Property taxes
- −$2,631
- − Insurance
- −$975
- − Repairs & maintenance
- −$1,562
- − Management
- −$1,562
- − Depreciation
- −$5,673
- Taxable loss
- −$3,796
- Est. tax savings @ 24.0%
- +$911
- After-tax cash flow
- $463/yr
For passive investors: Depreciation is non-cash, so a rental often shows a tax loss while cash-flowing — sheltering income. Rental losses are passive: they offset passive income freely, and up to $25,000/yr can offset ordinary (W-2) income if you actively participate and your MAGI is under $100k (phasing out to $0 by $150k); unused losses carry forward. On sale, claimed depreciation is recaptured at up to 25%, and gains may owe capital-gains tax (a 1031 exchange can defer both). Figures are a year-1 estimate at your 24.0% rate — not tax advice; consult a CPA.
Schools (NCES district)
- District
- Leon
- NCES district ID
- 1201110
- Math proficiency
- 48% ▼ -13.00%
- Reading proficiency
- 53% ▼ -5.00%
- Median HH income
- $46,339
- Composite
- 42.84/100
- National rank
- #3131
- State rank
- #33 of 73 in FL
Livability — Tallahassee
- Score
- 86/100
- State rank
- #19
- US rank
- #429
Category grades
Schools grade is shown separately in the Schools card above.
Census & demographics
- Census place
- Tallahassee, FL
- County
- Leon County · 294,472 people
- City population
- 294,472
- Metro
- Tallahassee, FL
- Population (ZIP)
- 21,905
- Household income
- $81,243
- Rent vs Own
- Severe rent burden
- 795.0
Population outlook (Leon County) Hauer SSP2
- Today (2025)
- 315,507 people
- By 2030
- 330,677 · +4.8%
- By 2040
- 358,465 · +13.6%
- By 2050
- 386,804 · +22.6%
- By 2075
- 465,480 · +47.5%
- By 2100
- 519,959 · +64.8%
Race, ethnicity, and origin ACS 2023
- Neighborhood character
- Diverse neighborhood (Simpson 0.64)
- Race & ethnicity
- White 52% Black 27% Two or more races 10% Hispanic / Latino 9% Asian 6%
- Hispanic origin (detail)
- Mexican 2% Puerto Rican 1% Cuban 1%
- Common ancestry
- Romanian 2% Serbian 2% Slovak 2%
- Foreign-born
- 11% · Canada, Jamaica
- Languages at home
- 86% English-only · Spanish 6% Other Indo-European 3% Other Asian/Pacific 2%
Political lean MEDSL · Leon
- 2024 margin
- Strong D (+21.8) · D 60.3% · R 38.5% · Other 1.2%
- 2008→2024 swing
- -2.5pp toward R · 2008: 24.3pp · 2024: 21.8pp
- All cycles
- 2024: D+21.8 2020: D+28.3 2016: D+25.1 2012: D+23.6 2008: D+24.3
Not yet ingested
- Civics
- —
Market trends
- HPI YoY
- ▼ -90.68%
- Current HPI
- 238.8804
- Rent YoY
- ▲ 5.55%
- Metro
- Tallahassee, FL
- State GDP YoY
- ▲ 3.28%
- F500 in state
- 36
Industry mix (Fortune 500 HQ in FL)
| Industry | F500 HQs | Revenue |
|---|---|---|
| Industrial Technology | 2 | $29B |
|
||
| Insurance | 2 | $17B |
|
||
| Retail | 1 | $60B |
|
||
| Technology Distribution | 1 | $58B |
|
||
| Homebuilding | 1 | $35B |
|
||
| Technology Manufacturing | 1 | $35B |
|
||
Price history
+209.5% since first listed3 events — show timeline
- 2026-06-01 Listed $195,000 CATRS
- 2001-06-06 Sold (Public Records) $69,600 Public Records
- 2000-04-10 Sold (Public Records) $63,000 Public Records
Property tax history
+9.1%/yrLatest (2025): $2,631 · +8.9% YoY. Source: county tax records.
Cash-flow waterfall
monthlySold comps — $/sqft
last 12 mo · ≤1 miLoading sold comps…