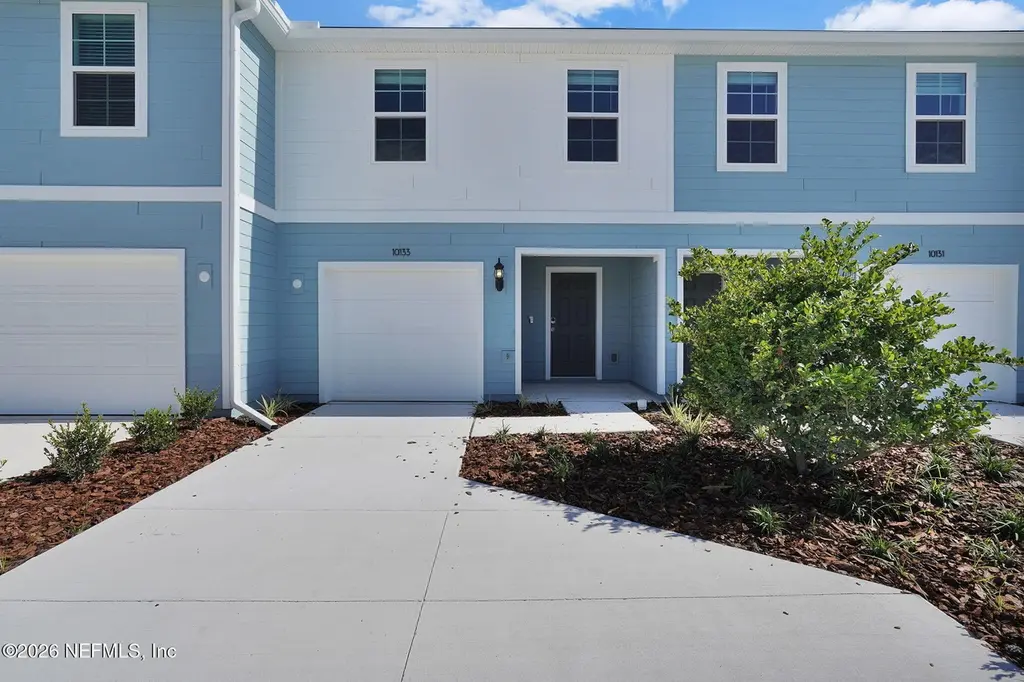
10133 Whistling Pine Ct · Jacksonville, FL
Flood risk No data
- FEMA flood zone
- —
- Chance of flooding over 30 yrs
- —
- Est. flood insurance / yr
- —
Fire risk No data
- Est. fire insurance / yr
- —
Heat risk No data
- Hot days now (above threshold)
- —
- Hot days in 30 yrs
- —
Wind risk No data
- Chance of severe wind over 30 yrs
- —
Air-quality risk No data
- Unhealthy air days now
- —
- Unhealthy air days in 30 yrs
- —
Risk factors via First Street. Map © Google.
Why this score? — see what drove the D- grade
The composite is a weighted blend of 9 inputs, each scored 0–100. Each bar is that input's sub-score; the figure is the points it added to the 100-point composite (weight × sub-score).
- Cash flow +10.9/30.0
- ARV discount +5.0/15.0
- Livability +4.2/5.0
- Condition / age +4.0/5.0
- Schools +3.9/10.0
- DSCR +3.2/10.0
- Rent growth +3.0/5.0
- 1% rule +2.9/10.0
- Appreciation +0.0/10.0
$246,890
🖨 Deal sheet (PDF) 📄 Offer letter ✓ Due diligence
Listing remarks
Step into this newly built Landmark townhome showcasing a timeless traditional exterior and a well-planned layout. With 3 bedrooms, 2.5 bathrooms, and an open-concept design, this home is ideal for both everyday living and hosting guests. The kitchen features stainless steel appliances--including an electric range, dishwasher, and microwave--paired with rich Sarsaparilla cabinetry, stylish quartz countertops, a walk-in pantry, and a spacious center island that flows seamlessly into the gathering room and café area. From the main living space, you can step out onto your private patio or head upstairs to find a versatile loft along with all bedrooms conveniently located on the same lev
Key facts
- Newly built
- Open concept design
- $195 HOA
Tags
Neighborhood map
What this means for you Summary
Snapshot
- This is a 3-bed/3.0-bath townhouse listed at $247k. Condition is rated good.
Deal economics
- At list price, monthly cash flow is $-109 ($-1k/yr) — negative.
- To cash-flow at today's rent, offer at most $228k (7.8% below list).
- To meet the 1% rule (rent ≥ 1% of price), the offer needs to be $196k (20.6% below list).
- Recommended offer: $196k (20.6% below list) — sets the bar for 1% rule.
- Cap rate 5.8% vs local median 3.9% in Jacksonville — top-decile yield for the area; either an underpriced asset or a hidden risk that comps aren't pricing in. Stress-test before assuming the spread holds.
Location & tenants
- Location reads 83/100 on livability (#50 in FL, #911 nationally) — a professional / high-income tenant draw. Strengths: amenities A+, commute A+, housing A+.
- Duval (urban): math 46% / reading 45% proficiency, ranked #48 of 73 in FL (top 66%) — families likely to look elsewhere, expect single-tenant / working-renter base with shorter leases.
- Zoned schools: Crystal Springs Elementary School (math 51% / reading 41%, grade D-, #1,234 of 2,144 statewide, top 58%, 907 students, 66% FRL); Charger Academy (math 33% / reading 26%, grade F, #469 of 571 statewide, top 84%, 961 students, 71% FRL); Edward H. White High School (math 31% / reading 25%, grade F, #464 of 667 statewide, top 70%, 1,538 students, 64% FRL) — zoned schools average 67% FRL vs 49% district-wide (18 pts higher); higher-poverty schools than district average — tighter screening recommended.
- Market conditions: Rents rising (+2.1%/yr); 219 active listings in the ZIP; 8 comparable units currently listed for rent nearby; rentals at typical pace (median 26d on market — plan ~3-4 weeks tenant-placement turnaround); solid renter incomes; 6,503 units permitted in Duval County in 2024 (1,131 in 5+ unit buildings).
Forward outlook
- Local home prices are declining (-3.0%/yr); year-one equity from $2k of loan paydown is wiped out by about $7k of value loss. Plan a longer hold.
- Duval County population projected at +19% by 2050 — long-run rental-demand tailwind backs the buy-and-hold thesis.
Negotiation context
- Only 7 days on market — expect competitive offers; lowballing is unlikely to land.
Questions for the listing agent
- What do current leases actually rent for vs. the listed asking? Can we see a recent rent roll and the last 12 months of T-12 income?
- What does the HOA fee cover, when was the last increase, and are there any pending special assessments or reserve-fund shortfalls?
- Is there a deadline driving the sale (1031 exchange, divorce, estate, relocation)? That informs how much negotiation room exists.
- Schools are B-rated — typically a magnet for longer-tenancy family renters. What's the average tenant stay here, and is there a school-zone premium baked into asking?
- The area grade is low — what's the realistic commute time and amenity access for the typical tenant pool here? Any planned neighborhood developments (good or bad) we should know about?
- What's the average days-on-market for RENTAL listings here right now (not sales)? A rising rental-DOM trend means longer vacancies and softer asking-rent achievability than the comps imply.
- What's the recent tenant-quality profile in this submarket — average credit score on applications, eviction rate, late-payment / NSF rate, and stable-employment percentage? A property-management company in the area should have these aggregated.
- How much new for-sale + rental construction is in the pipeline within 1–3 miles? Heavy new supply typically softens prices + rents 12–24 months out; constrained supply supports both.
Investment metrics
- 1% rule
- 0.79% ✗
- Cap rate
- 5.76%
- Cash-on-cash
- -1.90%
- DSCR
- 0.92
- GRM
- 10.5
CMA / ARV
- ARV (on-the-fly)
- $233,688
- Comps found
- 12
Show comp detail 12 sales within ~0.75 mi
| Address | Dist | Beds/Ba | Sqft | Sold | Price | $/sf | Match |
|---|---|---|---|---|---|---|---|
| 10130 Whistling Pne Ct | 0.03mi | 3/2.5 | 1,526 (+2%) | 1mo | $238,390 | $156 | 93 |
| 1856 Normandy Pines Ln | 0.04mi | 3/2.5 | 1,526 (+2%) | 1mo | $238,390 | $156 | 92 |
| 10126 Whistling Pne Ct | 0.03mi | 3/2.5 | 1,526 (+2%) | 1mo | $242,890 | $159 | 92 |
| 1880 Normandy Pines Ln | 0.05mi | 3/2.5 | 1,526 (+2%) | 1mo | $239,390 | $157 | 92 |
| 1860 Normandy Pines Ln | 0.04mi | 3/2.5 | 1,526 (+2%) | 2mo | $241,390 | $158 | 91 |
| 10124 Whistling Pne Ct | 0.03mi | 3/2.5 | 1,536 (+2%) | 1mo | $257,000 | $167 | 91 |
| 1872 Normandy Pines Ln | 0.04mi | 3/2.5 | 1,526 (+2%) | 3mo | $228,000 | $149 | 91 |
| 1876 Normandy Pines Ln | 0.04mi | 3/2.5 | 1,526 (+2%) | 3mo | $231,000 | $151 | 91 |
| 1874 Normandy Pines Ln | 0.04mi | 3/2.5 | 1,526 (+2%) | 3mo | $232,890 | $153 | 90 |
| 10129 Treasure Oaks Ct | 0.05mi | 3/2.5 | 1,526 (+2%) | 4mo | $227,890 | $149 | 89 |
| 1870 Normandy Pines Ln | 0.04mi | 3/2.5 | 1,526 (+2%) | 5mo | $236,000 | $155 | 89 |
| 10113 Treasure Oaks Ct | 0.06mi | 3/2.5 | 1,526 (+2%) | 5mo | $227,000 | $149 | 88 |
Match score weights: distance 35% · size 25% · config 20% · recency 20%. Top-matched comps best support the ARV.
Projected returns pro-forma
-3.0% appreciation · 2.12% rent growth · sell at horizon
- IRR
- -20.4%
- Equity multiple
- 0.30×
- Total profit
- $-48,698
- Equity at exit
- $36,812
- IRR
- -15.5%
- Equity multiple
- 0.16×
- Total profit
- $-58,318
- Equity at exit
- $21,347
Cash invested: $69,129 (down + closing). Projections, not guarantees.
Landlord ↔ Tenant lean methodology
- Overall (STATE)
- 87 Strongly Landlord-Friendly
- State Florida
- 87 Strongly Landlord-Friendly · R+3
- County
- — inherits STATE
- City
- — inherits STATE
ZIP-level market 32221
- Home prices YoY
- -19.2%
- Rents YoY
- 2.1%
- Active inventory
- 219
- Price-to-rent
- 10.5×
Monthly cashflow live
- Estimated rent
- $1,960 high interval (Pro) →
- Mortgage (P&I)
- −$1,295
- Tax from tax record
- −$65 /mo · $781/yr
- Insurance
- −$103
- HOA
- −$195
- Lot rent
- −$0
- Vacancy / Maint / Mgmt
- −$412
- Net cashflow
- $-109
Break-even live
Sensitivity live
| Price | -10% $30 | -5% $-40 | +0% $-109 | +5% $-179 | +10% $-249 |
|---|---|---|---|---|---|
| Rent | -10% $-264 | -5% $-187 | +0% $-109 | +5% $-32 | +10% $45 |
| Rate | -1.0pp $15 | -0.5pp $-47 | base $-109 | +0.5pp $-173 | +1.0pp $-239 |
UW: 25.0% down · 7.5% · 30yr · 1.5% tax · 5.0% vac · 8.0% maint · 8.0% mgmt
Financing live
Cash to close
- Down payment
- $61,722
- Closing costs
- $7,407
- Reserves months
- —
- Total cash needed
- —
Loan-product check · same deal, 3 products live
Conventional
25% down · 7.5% · 30yr
- Down + closing
- —
- Monthly P&I
- —
- Monthly cashflow
- —
- DSCR
- —
- Eligible?
- —
Personal DTI + credit; lowest rate.
DSCR
20% down · 8.5% · 30yr
- Down + closing
- —
- Monthly P&I
- —
- Monthly cashflow
- —
- DSCR
- —
- Eligible?
- —
No personal income docs; deal must DSCR.
Hard money
10% down · 12.0% · 12mo
- Down + closing
- —
- Monthly P&I
- —
- Monthly cashflow
- —
- DSCR
- —
- Eligible?
- —
Short-term bridge; refi at stabilization.
Rent comps 8 comps
| Address | Beds | Baths | Sqft | Rent | $/sqft | DOM | Units | Dist |
|---|---|---|---|---|---|---|---|---|
| 2120 Blair Rd Jacksonville, FL | 3.0 | 2.0 | 1272 | $1,675 | $1.32 | 26d | 1 | 0.37mi |
| 2081 Chaffee Rd S #19 Jacksonville, FL | 3.0 | 2.0 | 1152 | $1,619 | $1.41 | 26d | 1 | 0.80mi |
| 2081 Chaffee Rd S #72 Jacksonville, FL | 2.0 | 2.0 | 1216 | $1,309 | $1.08 | 26d | 1 | 0.81mi |
| 10161 Meadow Pointe Dr Jacksonville, FL | 3.0 | 2.0 | 1810 | $2,035 | $1.12 | 18d | 1 | 1.05mi |
| 2167 Kistlers Ridge Way Jacksonville, FL | 4.0 | 2.0 | 1456 | $1,900 | $1.30 | 16d | 1 | 1.24mi |
| 9183 Raptor Dr Jacksonville, FL | 3.0 | 2.0 | 1091 | $1,724 | $1.58 | 6d | 1 | 1.28mi |
| 2210 Kistlers Ridge Way Jacksonville, FL | 4.0 | 2.0 | 1456 | $1,846 | $1.27 | 26d | 1 | 1.30mi |
| 9101 Normandy Blvd Jacksonville, FL | 2.0–3.0 | 1.0–2.0 | 994 | $1,629 | $1.64 | 5d | 1 | 1.38mi |
HOA detail
- Monthly dues
- $195 · $2,340/yr
- Likely covers
- electric
Listing history 2 events
-
2026-04-23status Pending
-
2026-04-16$246,890 Active
ⓘ Source: listings_history table (triggers on properties + properties_extension) + one-shot
backfill from property_details.listing_events for pre-trigger history.
Tax reassessment forecast FL · Resets to sale price
- Current annual tax
- $781 · $65/mo
- Projected year-2 tax
- $2,049 · $171/mo
- Expected delta
- +$1,269/yr (+$106/mo · 162.5%)
ⓘ Screening estimate from a state-policy table — verify with the county assessor before closing.
Nearby sold comps map
Loading sold comps map…
Walkable amenities ~0.75 mi
Loading nearby amenities…
Taxation est. · year 1
- Rental income
- $23,517
- − Mortgage interest
- −$13,830
- − Property taxes
- −$781
- − Insurance
- −$1,234
- − Repairs & maintenance
- −$1,881
- − Management
- −$1,881
- − HOA
- −$2,340
- − Depreciation
- −$7,182
- Taxable loss
- −$5,613
- Est. tax savings @ 24.0%
- +$1,347
- After-tax cash flow
- $34/yr
For passive investors: Depreciation is non-cash, so a rental often shows a tax loss while cash-flowing — sheltering income. Rental losses are passive: they offset passive income freely, and up to $25,000/yr can offset ordinary (W-2) income if you actively participate and your MAGI is under $100k (phasing out to $0 by $150k); unused losses carry forward. On sale, claimed depreciation is recaptured at up to 25%, and gains may owe capital-gains tax (a 1031 exchange can defer both). Figures are a year-1 estimate at your 24.0% rate — not tax advice; consult a CPA.
Condition & rehab AI · 12 photos
This newly built townhome is in excellent condition with a good condition score of 80. It features a modern kitchen, bathrooms with Vikrell surrounds, and tile flooring throughout. The home is move-in ready with no visible repairs or maintenance needed. The highest-ROI updates to increase its value include painting the interior walls, landscaping improvements, and adding smart home features.
Value-add opportunities
- Both Painting the interior walls — Fresh paint can enhance the home's curb appeal and interior aesthetics.
- Both Landscaping improvements — Enhanced landscaping can improve the home's curb appeal and attract potential buyers.
- Both Adding smart home features — Smart home features can increase the home's value and appeal to tech-savvy buyers.
- Resale Upgrading the kitchen backsplash — A new backsplash can refresh the kitchen and make it more appealing to potential buyers.
- Resale Upgrading the bathroom fixtures — Modern fixtures can enhance the bathroom's appeal and make it more attractive to potential buyers.
Renovation cost estimate screening
Value-add ROI direction
- Both Painting the interior walls — Fresh paint can enhance the home's curb appeal and interior aesthetics. ↑
- Both Landscaping improvements — Enhanced landscaping can improve the home's curb appeal and attract potential buyers. ↑
- Both Adding smart home features — Smart home features can increase the home's value and appeal to tech-savvy buyers. ↑
- Resale Upgrading the kitchen backsplash — A new backsplash can refresh the kitchen and make it more appealing to potential buyers. ↑
- Resale Upgrading the bathroom fixtures — Modern fixtures can enhance the bathroom's appeal and make it more attractive to potential buyers. ↑
ⓘ Cost ranges are severity-bucket heuristics (US national rule-of-thumb). Get contractor quotes + a written scope before underwriting a rehab budget.
Schools (NCES district)
- District
- Duval
- NCES district ID
- 1200480
- Math proficiency
- 46% ▼ -11.00%
- Reading proficiency
- 45% ▼ -4.00%
- Median HH income
- $48,987
- Composite
- 38.97/100
- National rank
- #4076
- State rank
- #48 of 73 in FL
Livability — Jacksonville
- Score
- 83/100
- State rank
- #50
- US rank
- #911
Category grades
Schools grade is shown separately in the Schools card above.
Census & demographics
- Census place
- Jacksonville, FL
- County
- Duval County · 1,015,274 people
- City population
- 979,034
- Metro
- Jacksonville, FL
- Population (ZIP)
- 32,833
- Household income
- $82,969
- Rent vs Own
- Severe rent burden
- 516.0
Population outlook (Duval County) Hauer SSP2
- Today (2025)
- 1,013,010 people
- By 2030
- 1,059,228 · +4.6%
- By 2040
- 1,141,439 · +12.7%
- By 2050
- 1,205,258 · +19.0%
- By 2075
- 1,324,282 · +30.7%
- By 2100
- 1,319,620 · +30.3%
Race, ethnicity, and origin ACS 2023
- Neighborhood character
- Diverse neighborhood (Simpson 0.65)
- Race & ethnicity
- White 48% Black 33% Hispanic / Latino 9% Two or more races 6% Asian 4%
- Hispanic origin (detail)
- Mexican 2% Puerto Rican 5%
- Common ancestry
- Italian 3% Slovak 2% Hispanic 1%
- Foreign-born
- 9% · Canada, Vietnam
- Languages at home
- 88% English-only · Spanish 6% French/Haitian/Cajun 2% Vietnamese 2%
Political lean MEDSL · Duval
- 2024 margin
- Toss-up / Even · D 48.7% · R 50.1% · Other 1.2%
- 2008→2024 swing
- +0.4pp no change · 2008: -1.9pp · 2024: -1.5pp
- All cycles
- 2024: R+1.5 2020: D+3.8 2016: R+1.5 2012: R+3.6 2008: R+1.9
Not yet ingested
- Civics
- —
Market trends
- HPI YoY
- ▼ -62.74%
- Current HPI
- 263.7591
- Rent YoY
- ▲ 2.12%
- Metro
- Jacksonville, FL
- State GDP YoY
- ▲ 3.28%
- F500 in state
- 36
Industry mix (Fortune 500 HQ in FL)
| Industry | F500 HQs | Revenue |
|---|---|---|
| Industrial Technology | 2 | $29B |
|
||
| Insurance | 2 | $17B |
|
||
| Retail | 1 | $60B |
|
||
| Technology Distribution | 1 | $58B |
|
||
| Homebuilding | 1 | $35B |
|
||
| Technology Manufacturing | 1 | $35B |
|
||
Price history
2 events — show timeline
- 2026-04-23 Pending — realMLS
- 2026-04-16 Listed $246,890 realMLS
Cash-flow waterfall
monthlySold comps — $/sqft
last 12 mo · ≤1 miLoading sold comps…