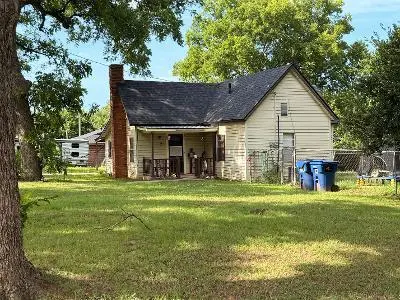
807 E Kean St · Wynnewood, OK
Flood risk 1/10 · Minimal
- FEMA flood zone
- X (unshaded)
- Chance of flooding over 30 yrs
- 0.0%
- Est. flood insurance / yr
- $507 – $1,088
Fire risk 6/10 · Moderate
- Est. fire insurance / yr
- $2,463 – $4,575
Heat risk 6/10 · Moderate
- Hot days now (above 109°F)
- 7 days/yr
- Hot days in 30 yrs
- 18 days/yr
Wind risk 4/10 · Minor
- Chance of severe wind over 30 yrs
- 9.0%
Air-quality risk 2/10 · Minimal
- Unhealthy air days now
- 0 days/yr
- Unhealthy air days in 30 yrs
- 1 days/yr
Risk factors via First Street. Map © Google.
Why this score? — see what drove the B- grade
The composite is a weighted blend of 9 inputs, each scored 0–100. Each bar is that input's sub-score; the figure is the points it added to the 100-point composite (weight × sub-score).
- Cash flow +21.6/30.0
- ARV discount +15.0/15.0
- Appreciation +8.9/10.0
- DSCR +6.9/10.0
- 1% rule +4.6/10.0
- Livability +3.1/5.0
- Rent growth +2.5/5.0
- Condition / age +2.5/5.0
- Schools +1.5/10.0
$99,500
🖨 Deal sheet 📄 Offer letter ✓ Due diligence
Listing remarks
Welcome to this charming home built in 1950. Situated on a spacious corner lot, this 3 bedroom, 1 bath home offers a comfortable space to call home. Inside you will find a large kitchen with plenty of space for cooking, gathering, and entertaining. Two large bedrooms with walk-in closets provide ample storage. A third bonus area could be used as a third bedroom or office. Outside enjoy the large, fenced backyard and storage building. This home is full of possibilities and is too cute to miss!
Key facts
- Storage building
- Walk-in closets
- Large kitchen
Tags
Property features AI
Finance
- Other: Corner-lot directions available: From the stoplight in Wynnewood travel east on Robert S Kerr Blvd to Clayton St, turn right and continue to the intersection of Clayton and Kean; the home is on the corner; Occupied; Active listing; Days on market: 1; Current price listed (provided by listing): $99,500
- Financial info: Loan qualification allowed; Not assumable
- HOA & community: No mandatory association dues
Exterior
- Utilities: Manual geocode (location verified); Homestead not claimed
- Home design: Single family residence; One story; Residential property; Existing structure
- Construction: Frame construction; Composition roof; Conventional foundation; Built prior to or by appraisal (living area source: Appraisal)
- Exterior features: Outbuildings; Corner lot
Interior
- Bedrooms: 2 bedrooms
- Bathrooms: 1 full bathroom
- Heating & cooling: Electric heating
- Interior features: One living area; Electric fireplace
Neighborhood map
What this means for you Summary
Snapshot
- This is a 2-bed/1.0-bath single-family listed at $100k.
Deal economics
- At list price, monthly cash flow is $151 ($2k/yr) — positive.
- The deal already cash-flows at list — no discount required.
- To meet the 1% rule (rent ≥ 1% of price), the offer needs to be $96k (3.7% below list).
- Recommended offer: $96k (3.7% below list) — sets the bar for 1% rule.
- Cap rate 8.1% vs local median 5.9% in Wynnewood — top-decile yield for the area; either an underpriced asset or a hidden risk that comps aren't pricing in. Stress-test before assuming the spread holds.
Location & tenants
- Location reads 62/100 on livability (#253 in OK) — a middle-class / working-renter tenant base. Strengths: cost of living A+, housing A+; Watch: employment D, amenities F, commute F.
- Wynnewood (rural): math 13% / reading 22% proficiency, ranked #198 of 270 in OK (top 73%) — low school quality limits family demand, transient renter base, plan for 1-2y turnover.
- Zoned schools: Central Es (math 17% / reading 27%, grade F, #413 of 845 statewide, top 54%, 277 students, 0% FRL); Wynnewood Hs (math 5% / reading 24%, grade F, #332 of 447 statewide, top 78%, 210 students, 0% FRL) — zoned schools average 0% FRL vs 51% district-wide (51 pts lower); this property's tenant base skews higher-income than the district average.
- Market conditions: 55 active listings in the ZIP; 1 units permitted in Garvin County in 2024 (0 in 5+ unit buildings).
Forward outlook
- In year one you build about $9k of equity ($688 loan paydown + $8k appreciation (7.9% local appreciation)).
- Garvin County population projected at +8% by 2050 — modest demand growth; plan on rents tracking national, not racing it.
- At projected returns (7.9% appreciation + 3.0% rent growth), your $28k cash investment doubles in ~3 years — after that, you're playing with house money.
- By year 5, paydown + projected appreciation supports a ~$39k cash-out refi (75% LTV) — recoverable capital for the next deal without selling this one.
Negotiation context
- It's been on market 16 days — a 2% lower offer ($98k) is reasonable based on typical stale-listing flexibility.
- Current owner paid $34k; list at $100k implies a 197% gain — meaningful room to come down on a strong offer.
Risks & watch-outs
- Watch-outs: built in 1950 — expect roof / HVAC / electrical / plumbing capex.
- Climate carrying-cost: major wildfire risk; extreme-heat days projected 7→18/yr by 2055 (HVAC capex compounding) — expect insurance premiums to compound above CPI over the hold.
Questions for the listing agent
- Built in 1950 — when were the roof, HVAC, electrical panel, plumbing, and water heater last replaced?
- Is there a deadline driving the sale (1031 exchange, divorce, estate, relocation)? That informs how much negotiation room exists.
- Schools are F-rated, which usually means shorter tenancies and higher turnover. Who's the typical renter profile here, and what's been the actual vacancy rate?
- What's the average days-on-market for RENTAL listings here right now (not sales)? A rising rental-DOM trend means longer vacancies and softer asking-rent achievability than the comps imply.
- What's the recent tenant-quality profile in this submarket — average credit score on applications, eviction rate, late-payment / NSF rate, and stable-employment percentage? A property-management company in the area should have these aggregated.
- How much new for-sale + rental construction is in the pipeline within 1–3 miles? Heavy new supply typically softens prices + rents 12–24 months out; constrained supply supports both.
Investment metrics
- 1% rule
- 0.96% ✗
- Cap rate
- 8.11%
- Cash-on-cash
- 6.49%
- DSCR
- 1.29
- GRM
- 8.7
CMA / ARV
- ARV (on-the-fly)
- $140,544
- Comps found
- 8
Show comp detail 8 sales within ~0.75 mi
| Address | Dist | Beds/Ba | Sqft | Sold | Price | $/sf | Match |
|---|---|---|---|---|---|---|---|
| 1006 E Chickasaw | 0.23mi | 2/1.0 | 981 (-11%) | 8mo | $43,000 | $44 | 65 |
| 403 S Howell Ave | 0.15mi | 3/2.0 (+1) | 1,120 (+2%) | 22mo | $108,000 | $96 | 63 |
| 710 E Juanita | 0.15mi | 3/2.0 (+1) | 1,208 (+10%) | 24mo | $80,000 | $66 | 48 |
| 1403 E Jennings St | 0.61mi | 3/1.0 (+1) | 1,146 (+4%) | 22mo | $147,000 | $128 | 41 |
| 1304 E Lawrence St | 0.38mi | 3/2.0 (+1) | 1,202 (+10%) | 22mo | $165,000 | $137 | 39 |
| 201 E Lawrence St | 0.48mi | 1/1.0 (-1) | 984 (-10%) | 24mo | $45,000 | $46 | 35 |
| 608 S Gardner Ave | 0.44mi | 3/2.0 (+1) | 1,228 (+12%) | 19mo | $170,000 | $138 | 35 |
| 303 E Robert S Kerr | 0.48mi | 2/2.5 | 1,258 (+15%) | 20mo | $161,000 | $128 | 30 |
Match score weights: distance 35% · size 25% · config 20% · recency 20%. Top-matched comps best support the ARV.
Projected returns pro-forma
7.9% appreciation · 3.0% rent growth · sell at horizon
- IRR
- 24.8%
- Equity multiple
- 2.79×
- Total profit
- $49,908
- Equity at exit
- $74,910
- IRR
- 22.4%
- Equity multiple
- 5.94×
- Total profit
- $137,578
- Equity at exit
- $148,050
Cash invested: $27,860 (down + closing). Projections, not guarantees.
Landlord ↔ Tenant lean methodology
- Overall (STATE)
- 83 Strongly Landlord-Friendly
- State Oklahoma
- 83 Strongly Landlord-Friendly · R+20
- County
- — inherits STATE
- City
- — inherits STATE
ZIP-level market 73098
- Home prices YoY
- 2.9%
- Active inventory
- 55
- Price-to-rent
- 8.7×
Monthly cashflow live
- Estimated rent
- $958 medium interval (Pro) →
- Mortgage (P&I)
- −$522
- Tax from tax record
- −$43 /mo · $516/yr
- Insurance
- −$41
- HOA
- −$0
- Vacancy / Maint / Mgmt
- −$201
- Net cashflow
- $151
Break-even live
UW: 25.0% down · 7.5% · 30yr · 1.5% tax · 5.0% vac · 8.0% maint · 8.0% mgmt
Financing live
Cash to close
- Down payment
- $24,875
- Closing costs
- $2,985
- Reserves months
- —
- Total cash needed
- —
Loan-product check · same deal, 3 products live
Conventional
25% down · 7.5% · 30yr
- Down + closing
- —
- Monthly P&I
- —
- Monthly cashflow
- —
- DSCR
- —
- Eligible?
- —
Personal DTI + credit; lowest rate.
DSCR
20% down · 8.5% · 30yr
- Down + closing
- —
- Monthly P&I
- —
- Monthly cashflow
- —
- DSCR
- —
- Eligible?
- —
No personal income docs; deal must DSCR.
Hard money
10% down · 12.0% · 12mo
- Down + closing
- —
- Monthly P&I
- —
- Monthly cashflow
- —
- DSCR
- —
- Eligible?
- —
Short-term bridge; refi at stabilization.
Listing history 12 events
-
2026-06-18days on market $99,500 Active 16 DOM
-
2026-06-17days on market $99,500 Active 15 DOM
-
2026-06-16days on market $99,500 Active 14 DOM
-
2026-06-15days on market $99,500 Active 13 DOM
-
2026-06-13days on market $99,500 Active 11 DOM
-
2026-06-12days on market $99,500 Active 10 DOM
-
2026-06-09days on market $99,500 Active 7 DOM
-
2026-06-08days on market $99,500 Active 6 DOM
-
2026-06-08days on market $99,500 Active 5 DOM
-
2026-06-07days on market $99,500 Active 4 DOM
-
2026-06-03remarks 497-char remark
-
2026-06-03$99,500 Active 1 DOM
ⓘ Source: listings_history table (triggers on properties + properties_extension) + one-shot
backfill from property_details.listing_events for pre-trigger history.
Tax reassessment forecast OK · Resets to sale price
- Current annual tax
- $516 · $43/mo
- Projected year-2 tax
- $895 · $75/mo
- Expected delta
- +$379/yr (+$32/mo · 73.5%)
ⓘ Screening estimate from a state-policy table — verify with the county assessor before closing.
Climate risk First Street
- Flood 1/10 Low FEMA zone X (unshaded) · 0% chance over 30 yrs
- Wildfire 6/10 Major
- Heat 6/10 Major 7 d/yr ≥109°F today · 18 d/yr by 30 yrs out
- Wind 4/10 Moderate 9% chance of damaging wind over 30 yrs
- Air quality 2/10 Low 0 unhealthy d/yr today · 1 by 30 yrs out
Nearby sold comps map
Loading sold comps map…
Walkable amenities ~0.75 mi
Loading nearby amenities…
Taxation est. · year 1
- Rental income
- $11,498
- − Mortgage interest
- −$5,574
- − Property taxes
- −$516
- − Insurance
- −$498
- − Repairs & maintenance
- −$920
- − Management
- −$920
- − Depreciation
- −$2,895
- Taxable income
- $176
- Est. tax owed @ 24.0%
- −$42
- After-tax cash flow
- $1,766/yr
For passive investors: Depreciation is non-cash, so a rental often shows a tax loss while cash-flowing — sheltering income. Rental losses are passive: they offset passive income freely, and up to $25,000/yr can offset ordinary (W-2) income if you actively participate and your MAGI is under $100k (phasing out to $0 by $150k); unused losses carry forward. On sale, claimed depreciation is recaptured at up to 25%, and gains may owe capital-gains tax (a 1031 exchange can defer both). Figures are a year-1 estimate at your 24.0% rate — not tax advice; consult a CPA.
Schools (NCES district)
- District
- Wynnewood
- NCES district ID
- 4033300
- Math proficiency
- 13% ▼ -7.00%
- Reading proficiency
- 22% ▼ -2.00%
- Median HH income
- $42,075
- Composite
- 15.05/100
- National rank
- #9352
- State rank
- #198 of 270 in OK
Livability — Wynnewood
- Score
- 62/100
- State rank
- #253
- US rank
- #16754
Category grades
Schools grade is shown separately in the Schools card above.
Census & demographics
- Census place
- Wynnewood, OK
- Population (ZIP)
- 3,382
Population outlook (Garvin County) Hauer SSP2
- Today (2025)
- 28,277 people
- By 2030
- 28,619 · +1.2%
- By 2040
- 29,478 · +4.2%
- By 2050
- 30,384 · +7.5%
- By 2075
- 34,074 · +20.5%
- By 2100
- 36,099 · +27.7%
Race, ethnicity, and origin ACS 2023
- Neighborhood character
- Predominantly White (74%)
- Race & ethnicity
- White 74% Two or more races 14% Hispanic / Latino 9% Native American 3% Black 2%
- Hispanic origin (detail)
- Mexican 8%
- Common ancestry
- Slovak 3% European 3% Serbian 2%
- Foreign-born
- 4% · Canada
- Languages at home
- 96% English-only · Spanish 3% German/W. Germanic 1%
Political lean MEDSL · Garvin
- 2024 margin
- Solid R (+66.1) · D 16.4% · R 82.5% · Other 1.1%
- 2008→2024 swing
- -22.5pp toward R · 2008: -43.6pp · 2024: -66.1pp
- All cycles
- 2024: R+66.1 2020: R+64.2 2016: R+60.7 2012: R+46.1 2008: R+43.6
Not yet ingested
- Civics
- —
Market trends
- HPI YoY
- ▲ 7.90%
- Current HPI
- 280.5166
- Rent YoY
- —
- Metro
- —
- State GDP YoY
- ▲ 1.55%
- F500 in state
- 6
Industry mix (Fortune 500 HQ in OK)
| Industry | F500 HQs | Revenue |
|---|---|---|
| Energy | 3 | $48B |
|
||
Price history
-53.8% since first listed3 events — show timeline
- 2026-06-01 Listed $99,500 MLSOK
- 2006-03-07 Sold (Public Records) $33,500 Public Records
- 1999-03-10 Sold (Public Records) $215,500 Public Records
Property tax history
+5.9%/yrLatest (2025): $516 · +13.2% YoY. Source: county tax records.
Cash-flow waterfall
monthlySold comps — $/sqft
last 12 mo · ≤1 miLoading sold comps…