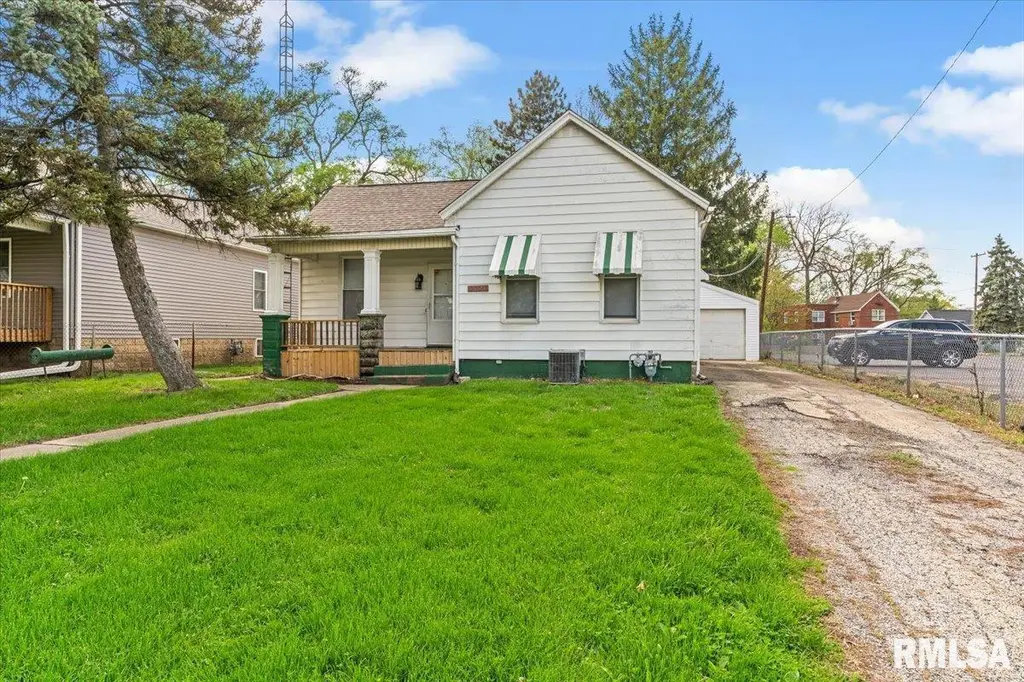
2021 N Peoria Rd · Springfield, IL
Flood risk 1/10 · Minimal
- FEMA flood zone
- X (unshaded)
- Chance of flooding over 30 yrs
- 0.0%
- Est. flood insurance / yr
- $473 – $860
Fire risk 1/10 · Minimal
- Est. fire insurance / yr
- $804 – $1,492
Heat risk 4/10 · Minor
- Hot days now (above 104°F)
- 7 days/yr
- Hot days in 30 yrs
- 20 days/yr
Wind risk 2/10 · Minimal
- Chance of severe wind over 30 yrs
- 1.0%
Air-quality risk 2/10 · Minimal
- Unhealthy air days now
- 1 days/yr
- Unhealthy air days in 30 yrs
- 1 days/yr
Risk factors via First Street. Map © Google.
Why this score? — see what drove the B- grade
The composite is a weighted blend of 9 inputs, each scored 0–100. Each bar is that input's sub-score; the figure is the points it added to the 100-point composite (weight × sub-score).
- Cash flow +27.9/30.0
- DSCR +9.9/10.0
- 1% rule +8.4/10.0
- ARV discount +7.5/15.0
- Livability +4.0/5.0
- Rent growth +3.7/5.0
- Condition / age +2.5/5.0
- Schools +1.7/10.0
- Appreciation +0.0/10.0
$84,900
🖨 Deal sheet (PDF) 📄 Offer letter ✓ Due diligence
Listing remarks MLS
Affordable 2-bedroom/1 bath home walking distance to the state fairgrounds offering a fenced-in yard, 2-car garage, and front porch. Whether you're buying your first home or expanding your portfolio, this one fits. Previously operated as a rental with reliable occupancy, offering great potential for investors. Updates include: new porch floor, remodeled bathroom, new siding and roof on two-car garage, new entry door to garage. With its flexible layout, the dining room could be transformed into a larger more functional kitchen, while the existing small kitchen space presents a perfect opportunity for a convenient main-level laundry/mud room. Schedule a showing today.
Key facts
- New siding
- Remodeled bathroom
- Front porch
Tags
Neighborhood map
What this means for you Summary
Snapshot
- This is a 2-bed/1.0-bath other listed at $85k.
Deal economics
- At list price, monthly cash flow is $262 ($3k/yr) — positive.
- The deal already cash-flows at list — no discount required.
- Meets the 1% rule at list price ($1k rent vs $85k).
- Recommended offer: $84k (1.5% below list) — sets the bar for market timing.
- Cap rate 10.0% vs local median 4.9% in Springfield — top-decile yield for the area; either an underpriced asset or a hidden risk that comps aren't pricing in. Stress-test before assuming the spread holds.
Location & tenants
- Location reads 79/100 on livability (#122 in IL, #2,138 nationally) — a middle-class / working-renter tenant base. Strengths: amenities A+, commute A+, cost of living A+; Watch: crime F.
- Springfield SD 186 (urban): math 17% / reading 22% proficiency, ranked #438 of 620 in IL (top 71%) — low school quality limits family demand, transient renter base, plan for 1-2y turnover; 64% free/reduced lunch — lower-income household profile, screen leases tightly.
- Zoned schools: Ridgely Elem School (math 2% / reading 8%, grade F, #1,741 of 2,056 statewide, top 93%, 311 students, 0% FRL); Washington Middle School (math 3% / reading 6%, grade F, #650 of 665 statewide, top 98%, 531 students, 0% FRL); Lanphier High School (math 10% / reading 16%, grade F, #501 of 693 statewide, top 73%, 1,058 students, 0% FRL) — zoned schools average 0% FRL vs 64% district-wide (64 pts lower); this property's tenant base skews higher-income than the district average.
- Zoned-school proficiency averages 8% at this address vs 20% district-wide (-12 pts) — the specific schools serving this property underperform the Springfield SD 186 average; the district grade overstates school quality for this exact location.
- Market conditions: Rents rising fast (+5.0%/yr); 137 active listings in the ZIP; 8 comparable units currently listed for rent nearby; rentals lingering (median 45d on market — plan ~5-8 weeks vacancy on turnover, expect pricing pressure); 50% of comp listings sitting > 30 days — soft ceiling on asking rent; 225 units permitted in Sangamon County in 2024 (48 in 5+ unit buildings).
Forward outlook
- Local home prices are declining (-3.0%/yr); year-one equity from $587 of loan paydown is wiped out by about $3k of value loss. Plan a longer hold.
- Sangamon County population projected to shrink 9% by 2050 — rents likely to lag national; underwrite the cash flow, not the appreciation.
- At projected returns (-3.0% appreciation + 5.0% rent growth), your $24k cash investment doubles in ~8 years — after that, you're playing with house money.
Negotiation context
- It's been on market 20 days — a 2% lower offer ($84k) is reasonable based on typical stale-listing flexibility.
- 2 sale attempts since 17y ago with the ask held roughly flat each time — persistent listings suggest the price (not the market) is what's stuck; bring a comps-based counter.
- Current owner paid $25k; list at $85k implies a 240% gain — meaningful room to come down on a strong offer.
Risks & watch-outs
- Watch-outs: built in 1873 — expect roof / HVAC / electrical / plumbing capex.
Questions for the listing agent
- Built in 1873 — when were the roof, HVAC, electrical panel, plumbing, and water heater last replaced?
- Is there a deadline driving the sale (1031 exchange, divorce, estate, relocation)? That informs how much negotiation room exists.
- Schools are D-rated, which usually means shorter tenancies and higher turnover. Who's the typical renter profile here, and what's been the actual vacancy rate?
- Crime grade is F in this area — have there been break-ins, vandalism, or insurance claims at this property in the last 3 years? What carrier currently insures it and at what premium?
- What's the average days-on-market for RENTAL listings here right now (not sales)? A rising rental-DOM trend means longer vacancies and softer asking-rent achievability than the comps imply.
- What's the recent tenant-quality profile in this submarket — average credit score on applications, eviction rate, late-payment / NSF rate, and stable-employment percentage? A property-management company in the area should have these aggregated.
- How much new for-sale + rental construction is in the pipeline within 1–3 miles? Heavy new supply typically softens prices + rents 12–24 months out; constrained supply supports both.
Investment metrics
- 1% rule
- 1.34% ✓
- Cap rate
- 9.99%
- Cash-on-cash
- 13.22%
- DSCR
- 1.59
- GRM
- 6.2
CMA / ARV
No comps found within radius.
Projected returns pro-forma
-3.0% appreciation · 4.95% rent growth · sell at horizon
- IRR
- 5.6%
- Equity multiple
- 1.22×
- Total profit
- $5,252
- Equity at exit
- $12,659
- IRR
- 16.8%
- Equity multiple
- 2.51×
- Total profit
- $35,999
- Equity at exit
- $7,341
Cash invested: $23,772 (down + closing). Projections, not guarantees.
Landlord ↔ Tenant lean methodology
- Overall (STATE)
- 43 Moderately Tenant-Leaning
- State Illinois
- 43 Moderately Tenant-Leaning · D+7
- County
- — inherits STATE
- City
- — inherits STATE
ZIP-level market 62702
- Home prices YoY
- -34.9%
- Rents YoY
- 5.0%
- Active inventory
- 137
- Price-to-rent
- 6.2×
Monthly cashflow live
- Estimated rent
- $1,142 high interval (Pro) →
- Mortgage (P&I)
- −$445
- Tax from tax record
- −$159 /mo · $1,912/yr
- Insurance
- −$35
- HOA
- −$0
- Vacancy / Maint / Mgmt
- −$240
- Net cashflow
- $262
Break-even live
Sensitivity live
| Price | -10% $310 | -5% $286 | +0% $262 | +5% $238 | +10% $214 |
|---|---|---|---|---|---|
| Rent | -10% $172 | -5% $217 | +0% $262 | +5% $307 | +10% $352 |
| Rate | -1.0pp $305 | -0.5pp $283 | base $262 | +0.5pp $240 | +1.0pp $217 |
UW: 25.0% down · 7.5% · 30yr · 1.5% tax · 5.0% vac · 8.0% maint · 8.0% mgmt
Financing live
Cash to close
- Down payment
- $21,225
- Closing costs
- $2,547
- Reserves months
- —
- Total cash needed
- —
Loan-product check · same deal, 3 products live
Conventional
25% down · 7.5% · 30yr
- Down + closing
- —
- Monthly P&I
- —
- Monthly cashflow
- —
- DSCR
- —
- Eligible?
- —
Personal DTI + credit; lowest rate.
DSCR
20% down · 8.5% · 30yr
- Down + closing
- —
- Monthly P&I
- —
- Monthly cashflow
- —
- DSCR
- —
- Eligible?
- —
No personal income docs; deal must DSCR.
Hard money
10% down · 12.0% · 12mo
- Down + closing
- —
- Monthly P&I
- —
- Monthly cashflow
- —
- DSCR
- —
- Eligible?
- —
Short-term bridge; refi at stabilization.
Rent comps 8 comps
| Address | Beds | Baths | Sqft | Rent | $/sqft | DOM | Units | Dist |
|---|---|---|---|---|---|---|---|---|
| 3501 E Ridgely Ave Unit FR21 Springfield, IL | 3.0 | 2.0 | 1216 | $1,129 | $0.93 | 22d | 1 | 0.82mi |
| 1413 N 5th St Springfield, IL | 3.0 | 1.0 | 1200 | $1,200 | $1.00 | 22d | 1 | 0.82mi |
| 201 Eastman Ave Springfield, IL | 2.0 | 1.0 | 812 | $950 | $1.17 | 45d | 1 | 0.98mi |
| 1127 N 6th St Unit 2 Springfield, IL | 1.0 | 1.0 | 900 | $900 | $1.00 | 45d | 1 | 1.00mi |
| 1224 N Rutledge St Springfield, IL | 2.0 | 2.0 | 1200 | $1,400 | $1.17 | 22d | 1 | 1.20mi |
| 2281 E Keys Ave Springfield, IL | 2.0 | 1.0 | 800 | $1,200 | $1.50 | 45d | 1 | 1.21mi |
| 920 N 19th St Springfield, IL | 3.0 | 1.0 | 1000 | $1,100 | $1.10 | 22d | 1 | 1.23mi |
| 401 W Elliott Ave Unit A Springfield, IL | 3.0 | 1.0 | 1100 | $1,300 | $1.18 | 45d | 1 | 1.41mi |
Listing history 6 events
-
2026-05-06status Pending 676-char remark
Show marketing remark (676 chars)
Affordable 2-bedroom/1 bath home walking distance to the state fairgrounds offering a fenced-in yard, 2-car garage, and front porch. Whether you're buying your first home or expanding your portfolio, this one fits. Previously operated as a rental with reliable occupancy, offering great potential for investors. Updates include: new porch floor, remodeled bathroom, new siding and roof on two-car garage, new entry door to garage. With its flexible layout, the dining room could be transformed into a larger more functional kitchen, while the existing small kitchen space presents a perfect opportunity for a convenient main-level laundry/mud room. Schedule a showing today.
-
2026-04-16$84,900 Active 676-char remark
Show marketing remark (676 chars)
Affordable 2-bedroom/1 bath home walking distance to the state fairgrounds offering a fenced-in yard, 2-car garage, and front porch. Whether you're buying your first home or expanding your portfolio, this one fits. Previously operated as a rental with reliable occupancy, offering great potential for investors. Updates include: new porch floor, remodeled bathroom, new siding and roof on two-car garage, new entry door to garage. With its flexible layout, the dining room could be transformed into a larger more functional kitchen, while the existing small kitchen space presents a perfect opportunity for a convenient main-level laundry/mud room. Schedule a showing today.
-
2012-04-18soldstatus $25,000
-
2009-08-06soldstatus $57,500 113-char remark
Show marketing remark (113 chars)
SPACIOUS ROOMS WITH HIGH CEILINGS AND HARDWOOD FLOORS, TWO BEDROOM, FULL BASEMENT, LARGE LOT WITH 1.5 CAR GARAGE.
-
2009-03-31$65,000 113-char remark
Show marketing remark (113 chars)
SPACIOUS ROOMS WITH HIGH CEILINGS AND HARDWOOD FLOORS, TWO BEDROOM, FULL BASEMENT, LARGE LOT WITH 1.5 CAR GARAGE.
-
2002-10-21soldstatus $50,000
ⓘ Source: listings_history table (triggers on properties + properties_extension) + one-shot
backfill from property_details.listing_events for pre-trigger history.
Tax reassessment forecast IL · Partial reset (capped growth)
- Current annual tax
- $1,912 · $159/mo
- Projected year-2 tax
- $1,920 · $160/mo
- Expected delta
- +$7/yr (+$1/mo · 0.4%)
ⓘ Screening estimate from a state-policy table — verify with the county assessor before closing.
Climate risk First Street
- Flood 1/10 Low FEMA zone X (unshaded) · 0% chance over 30 yrs
- Wildfire 1/10 Low
- Heat 4/10 Moderate 7 d/yr ≥104°F today · 20 d/yr by 30 yrs out
- Wind 2/10 Low 100% chance of damaging wind over 30 yrs
- Air quality 2/10 Low 1 unhealthy d/yr today · 1 by 30 yrs out
Nearby sold comps map
Loading sold comps map…
Walkable amenities ~0.75 mi
Loading nearby amenities…
Taxation est. · year 1
- Rental income
- $13,698
- − Mortgage interest
- −$4,756
- − Property taxes
- −$1,912
- − Insurance
- −$424
- − Repairs & maintenance
- −$1,096
- − Management
- −$1,096
- − Depreciation
- −$2,470
- Taxable income
- $1,944
- Est. tax owed @ 24.0%
- −$467
- After-tax cash flow
- $2,675/yr
For passive investors: Depreciation is non-cash, so a rental often shows a tax loss while cash-flowing — sheltering income. Rental losses are passive: they offset passive income freely, and up to $25,000/yr can offset ordinary (W-2) income if you actively participate and your MAGI is under $100k (phasing out to $0 by $150k); unused losses carry forward. On sale, claimed depreciation is recaptured at up to 25%, and gains may owe capital-gains tax (a 1031 exchange can defer both). Figures are a year-1 estimate at your 24.0% rate — not tax advice; consult a CPA.
Schools (NCES district)
- District
- Springfield SD 186
- NCES district ID
- 1737080
- Math proficiency
- 17% ▼ -7.00%
- Reading proficiency
- 22% ▼ -5.00%
- Median HH income
- $43,744
- Composite
- 16.89/100
- National rank
- #9142
- State rank
- #438 of 620 in IL
Livability — Springfield
- Score
- 79/100
- State rank
- #122
- US rank
- #2138
Category grades
Schools grade is shown separately in the Schools card above.
Census & demographics
- Census place
- Springfield, IL
- County
- Sangamon County · 115,414 people
- City population
- 59,955
- Metro
- Springfield, IL
- Population (ZIP)
- 31,033
- Household income
- $51,136
- Rent vs Own
- Severe rent burden
- 1230.0
Population outlook (Sangamon County) Hauer SSP2
- Today (2025)
- 198,317 people
- By 2030
- 196,127 · -1.1%
- By 2040
- 188,664 · -4.9%
- By 2050
- 179,624 · -9.4%
- By 2075
- 155,027 · -21.8%
- By 2100
- 122,588 · -38.2%
Race, ethnicity, and origin ACS 2023
- Neighborhood character
- Predominantly White (72%)
- Race & ethnicity
- White 72% Black 17% Two or more races 8% Hispanic / Latino 3%
- Common ancestry
- Romanian 2% Slovak 2% Serbian 1%
- Foreign-born
- 2% · Canada
- Languages at home
- 96% English-only · Spanish 1% French/Haitian/Cajun 1% Other Indo-European 1%
Political lean MEDSL · Sangamon
- 2024 margin
- Toss-up / Even · D 46.6% · R 51.6% · Other 1.8%
- 2008→2024 swing
- -9.3pp toward R · 2008: 4.4pp · 2024: -5.0pp
- All cycles
- 2024: R+5.0 2020: R+4.4 2016: R+9.4 2012: R+8.7 2008: D+4.4
Not yet ingested
- Civics
- —
Market trends
- HPI YoY
- ▼ -79.98%
- Current HPI
- 149.1926
- Rent YoY
- ▲ 4.95%
- Metro
- Springfield, IL
- State GDP YoY
- ▲ 1.59%
- F500 in state
- 60
Industry mix (Fortune 500 HQ in IL)
| Industry | F500 HQs | Revenue |
|---|---|---|
| Insurance | 4 | $201B |
|
||
| Consumer Goods | 4 | $87B |
|
||
| Industrial Machinery | 3 | $64B |
|
||
| Healthcare | 2 | $55B |
|
||
| Retail / Pharmacy | 1 | $148B |
|
||
| Agriculture / Food | 1 | $86B |
|
||
Price history
+69.8% since first listed6 events — show timeline
- 2026-05-06 Pending — RMLSA as Distributed by MLS Grid
- 2026-04-16 Listed $84,900 RMLSA as Distributed by MLS Grid
- 2012-04-18 Sold (Public Records) $25,000 Public Records
- 2009-08-06 Sold (MLS) $57,500 RMLSA as Distributed by MLS Grid
- 2009-03-31 Listed $65,000 RMLSA as Distributed by MLS Grid
- 2002-10-21 Sold (Public Records) $50,000 Public Records
Property tax history
+1.6%/yrLatest (2024): $1,912 · +4.0% YoY. Source: county tax records.
Cash-flow waterfall
monthlySold comps — $/sqft
last 12 mo · ≤1 miLoading sold comps…