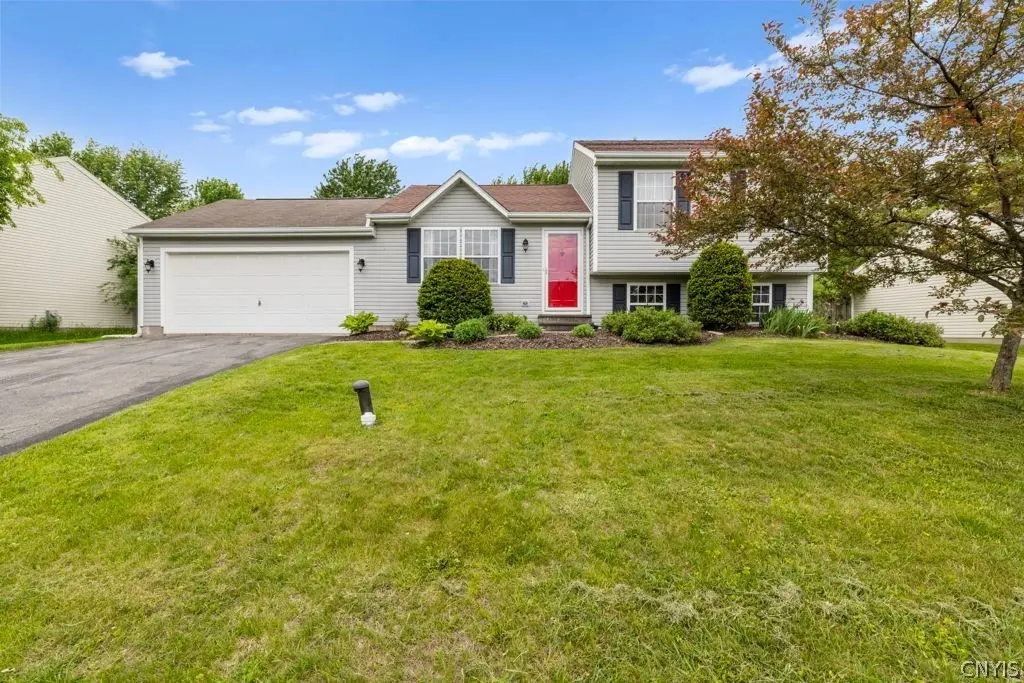
5717 Boulia Dr · North Syracuse, NY
Flood risk 1/10 · Minimal
- FEMA flood zone
- X (unshaded)
- Chance of flooding over 30 yrs
- 0.0%
- Est. flood insurance / yr
- $473 – $860
Fire risk 3/10 · Minor
- Est. fire insurance / yr
- $691 – $1,283
Heat risk 3/10 · Minor
- Hot days now (above 95°F)
- 7 days/yr
- Hot days in 30 yrs
- 16 days/yr
Wind risk 1/10 · Minimal
- Chance of severe wind over 30 yrs
- 1.0%
Air-quality risk 2/10 · Minimal
- Unhealthy air days now
- 1 days/yr
- Unhealthy air days in 30 yrs
- 1 days/yr
Risk factors via First Street. Map © Google.
Why this score? — see what drove the F grade
The composite is a weighted blend of 9 inputs, each scored 0–100. Each bar is that input's sub-score; the figure is the points it added to the 100-point composite (weight × sub-score).
- Cash flow +11.4/30.0
- Schools +4.2/10.0
- 1% rule +3.9/10.0
- Livability +3.6/5.0
- DSCR +3.3/10.0
- Rent growth +2.5/5.0
- Condition / age +2.5/5.0
- ARV discount +1.6/15.0
- Appreciation +0.0/10.0
$304,900
🖨 Deal sheet 📄 Offer letter ✓ Due diligence
Listing remarks MLS
Gorgeous 6 year young split level! Perfect inside & out, great curb appeal & beautiful landscaping. Inside spacious, light & bright, vaulted ceilings and hardwoods. Features 3 bedrooms, 2 full baths, Livingroom, Dining Rm, Family Rm. All appliances stay including washer and dryer in full basement. Deck and fully fenced backyard to forever wild. Rental application with good credit required.
Key facts
- Second living room
- Large patio
- Versatile bonus room
Tags
Property features AI
Exterior
- Parking: Attached 2-car garage with garage door opener
- Utilities: High-speed internet available; Public water connected; Sewer connected; Electric service with circuit breakers; Gas service (for heating and water heater)
- Home design: Single-story house; Vinyl siding; Resale property; Rectangular, residential lot measuring approximately 87 x 140; City street frontage
- Construction: Vinyl siding exterior; Block foundation; Existing construction
- Exterior features: Blacktop driveway; Fully fenced yard; Patio
Interior
- Kitchen: Electric oven; Electric range; Dishwasher; Refrigerator; Eat-in kitchen
- Bedrooms: Convertible bedroom (location not specified)
- Flooring: Carpet; Hardwood; Tile; Varied flooring
- Bathrooms: 2 full bathrooms
- Heating & cooling: Gas forced-air heating; Central air conditioning; Circuit breaker electrical panel
- Interior features: Ceiling fans; Cathedral ceilings; Eat-in kitchen; Convertible bedroom; Partially finished full basement; Recreation room and family room
- Laundry & utility: Washer; Dryer; Laundry located in basement; Gas water heater
Neighborhood map
What this means for you Summary
Snapshot
- This is a 3-bed/1.0-bath single-family listed at $305k.
Deal economics
- At list price, monthly cash flow is $-106 ($-1k/yr) — negative.
- To cash-flow at today's rent, offer at most $286k (6.2% below list).
- To meet the 1% rule (rent ≥ 1% of price), the offer needs to be $270k (11.4% below list).
- Recommended offer: $270k (11.4% below list) — sets the bar for 1% rule.
Location & tenants
- Location reads 72/100 on livability (#379 in NY) — a middle-class / working-renter tenant base. Strengths: housing A+, health & safety A+, cost of living A; Watch: schools C-, crime D, amenities F.
- North Syracuse Central School District (suburban): math 45% / reading 50% proficiency, ranked #402 of 590 in NY (top 68%) — families likely to look elsewhere, expect single-tenant / working-renter base with shorter leases.
- Market conditions: 63 active listings in the ZIP; 3 comparable units currently listed for rent nearby; rentals at typical pace (median 21d on market — plan ~3-4 weeks tenant-placement turnaround); 616 units permitted in Onondaga County in 2024 (256 in 5+ unit buildings).
Forward outlook
- Local home prices are declining (-3.0%/yr); year-one equity from $2k of loan paydown is wiped out by about $9k of value loss. Plan a longer hold.
- Onondaga County population projected to shrink 9% by 2050 — rents likely to lag national; underwrite the cash flow, not the appreciation.
Negotiation context
- Only 12 days on market — expect competitive offers; lowballing is unlikely to land.
- 2 sale attempts since 22y ago with the ask held roughly flat each time — persistent listings suggest the price (not the market) is what's stuck; bring a comps-based counter.
- Current owner paid $113k; list at $305k implies a 170% gain — meaningful room to come down on a strong offer.
Questions for the listing agent
- What do current leases actually rent for vs. the listed asking? Can we see a recent rent roll and the last 12 months of T-12 income?
- Is there a deadline driving the sale (1031 exchange, divorce, estate, relocation)? That informs how much negotiation room exists.
- Crime grade is D in this area — have there been break-ins, vandalism, or insurance claims at this property in the last 3 years? What carrier currently insures it and at what premium?
- The area grade is low — what's the realistic commute time and amenity access for the typical tenant pool here? Any planned neighborhood developments (good or bad) we should know about?
- What's the average days-on-market for RENTAL listings here right now (not sales)? A rising rental-DOM trend means longer vacancies and softer asking-rent achievability than the comps imply.
- What's the recent tenant-quality profile in this submarket — average credit score on applications, eviction rate, late-payment / NSF rate, and stable-employment percentage? A property-management company in the area should have these aggregated.
- How much new for-sale + rental construction is in the pipeline within 1–3 miles? Heavy new supply typically softens prices + rents 12–24 months out; constrained supply supports both.
Investment metrics
- 1% rule
- 0.89% ✗
- Cap rate
- 5.87%
- Cash-on-cash
- -1.50%
- DSCR
- 0.93
- GRM
- 9.4
CMA / ARV
- ARV (on-the-fly)
- $269,496
- Comps found
- 12
Show comp detail 12 sales within ~0.75 mi
| Address | Dist | Beds/Ba | Sqft | Sold | Price | $/sf | Match |
|---|---|---|---|---|---|---|---|
| 5496 Tobin Path | 0.37mi | 3/2.0 | 1,400 (+2%) | 1mo | $410,000 | $293 | 74 |
| 8238 Lucchesi Dr | 0.34mi | 3/1.0 | 1,280 (-6%) | 1mo | $280,000 | $219 | 73 |
| 8129 Firenze Ln | 0.25mi | 3/1.0 | 1,232 (-10%) | 7mo | $259,000 | $210 | 66 |
| 5539 Taormina Dr | 0.38mi | 4/1.5 (+1) | 1,384 (+1%) | 9mo | $209,900 | $152 | 66 |
| 8221 Lucchesi Dr | 0.41mi | 3/2.0 | 1,500 (+10%) | 5mo | $270,000 | $180 | 57 |
| 5317 Fortuna Pkwy | 0.36mi | 3/2.5 | 1,520 (+11%) | 4mo | $300,000 | $197 | 56 |
| 8046 Bamm Hollow Rd | 0.46mi | 3/1.5 | 1,552 (+14%) | 1mo | $315,000 | $203 | 53 |
| 5512 Taormina Dr | 0.47mi | 3/2.0 | 1,212 (-11%) | 8mo | $155,000 | $128 | 48 |
| 8150 Toscano Dr | 0.60mi | 3/1.5 | 1,497 (+9%) | 8mo | $304,000 | $203 | 47 |
| 8084 Bamm Hollow Rd | 0.63mi | 3/1.5 | 1,508 (+10%) | 7mo | $296,600 | $197 | 46 |
| 8133 Duncowing Ln | 0.47mi | 4/2.0 (+1) | 1,520 (+11%) | 6mo | $250,000 | $164 | 46 |
| 8071 Evesborough Dr | 0.61mi | 3/1.5 | 1,520 (+11%) | 9mo | $260,000 | $171 | 44 |
Match score weights: distance 35% · size 25% · config 20% · recency 20%. Top-matched comps best support the ARV.
Projected returns pro-forma
-3.0% appreciation · 3.0% rent growth · sell at horizon
- IRR
- -18.7%
- Equity multiple
- 0.34×
- Total profit
- $-56,067
- Equity at exit
- $45,462
- IRR
- -11.1%
- Equity multiple
- 0.33×
- Total profit
- $-57,056
- Equity at exit
- $26,362
Cash invested: $85,372 (down + closing). Projections, not guarantees.
Landlord ↔ Tenant lean methodology
- Overall (STATE)
- 15 Strongly Tenant-Friendly
- State New York
- 15 Strongly Tenant-Friendly · D+10
- County
- — inherits STATE
- City
- — inherits STATE
ZIP-level market 13041
- Active inventory
- 63
- Price-to-rent
- 9.4×
Monthly cashflow live
- Estimated rent
- $2,702 medium interval (Pro) →
- Mortgage (P&I)
- −$1,599
- Tax from tax record
- −$515 /mo · $6,183/yr
- Insurance
- −$127
- HOA
- −$0
- Vacancy / Maint / Mgmt
- −$567
- Net cashflow
- $-106
Break-even live
UW: 25.0% down · 7.5% · 30yr · 1.5% tax · 5.0% vac · 8.0% maint · 8.0% mgmt
Financing live
Cash to close
- Down payment
- $76,225
- Closing costs
- $9,147
- Reserves months
- —
- Total cash needed
- —
Loan-product check · same deal, 3 products live
Conventional
25% down · 7.5% · 30yr
- Down + closing
- —
- Monthly P&I
- —
- Monthly cashflow
- —
- DSCR
- —
- Eligible?
- —
Personal DTI + credit; lowest rate.
DSCR
20% down · 8.5% · 30yr
- Down + closing
- —
- Monthly P&I
- —
- Monthly cashflow
- —
- DSCR
- —
- Eligible?
- —
No personal income docs; deal must DSCR.
Hard money
10% down · 12.0% · 12mo
- Down + closing
- —
- Monthly P&I
- —
- Monthly cashflow
- —
- DSCR
- —
- Eligible?
- —
Short-term bridge; refi at stabilization.
Rent comps 3 comps
| Address | Beds | Baths | Sqft | Rent | $/sqft | DOM | Units | Dist |
|---|---|---|---|---|---|---|---|---|
| 8244 Mantova Dr Clay, NY | 3.0 | 2.0 | 1560 | $2,800 | $1.79 | 43d | 1 | 0.24mi |
| 5472 Alfreton Dr Clay, NY | 3.0 | 2.0 | 1328 | $2,800 | $2.11 | 21d | 1 | 0.35mi |
| 8091 Weblank Way Clay, NY | 3.0 | 1.5 | 1150 | $2,200 | $1.91 | 21d | 1 | 0.67mi |
Listing history 11 events
-
2026-06-15status $304,900 Pending 12 DOM
-
2026-06-15days on market $304,900 Active Under Contract 12 DOM
-
2026-06-14days on market $304,900 Active Under Contract 10 DOM
-
2026-06-13days on market $304,900 Active Under Contract 9 DOM
-
2026-06-10days on market $304,900 Active Under Contract 7 DOM
-
2026-06-09days on market $304,900 Active Under Contract 6 DOM
-
2026-06-09status $304,900 Active Under Contract 5 DOM
-
2026-06-08days on market $304,900 Active 5 DOM
-
2026-06-07days on market $304,900 Active 4 DOM
-
2026-06-03remarks 682-char remark
-
2026-06-03$304,900 Active 1 DOM
ⓘ Source: listings_history table (triggers on properties + properties_extension) + one-shot
backfill from property_details.listing_events for pre-trigger history.
Tax reassessment forecast NY · Partial reset (capped growth)
- Current annual tax
- $6,183 · $515/mo
- Projected year-2 tax
- $6,183 · $515/mo
- Expected delta
- $0/yr ($0/mo · 0.0%)
ⓘ Screening estimate from a state-policy table — verify with the county assessor before closing.
Climate risk First Street
- Flood 1/10 Low FEMA zone X (unshaded) · 0% chance over 30 yrs
- Wildfire 3/10 Moderate
- Heat 3/10 Moderate 7 d/yr ≥95°F today · 16 d/yr by 30 yrs out
- Wind 1/10 Low 100% chance of damaging wind over 30 yrs
- Air quality 2/10 Low 1 unhealthy d/yr today · 1 by 30 yrs out
Nearby sold comps map
Loading sold comps map…
Walkable amenities ~0.75 mi
Loading nearby amenities…
Taxation est. · year 1
- Rental income
- $32,426
- − Mortgage interest
- −$17,079
- − Property taxes
- −$6,183
- − Insurance
- −$1,524
- − Repairs & maintenance
- −$2,594
- − Management
- −$2,594
- − Depreciation
- −$8,870
- Taxable loss
- −$6,419
- Est. tax savings @ 24.0%
- +$1,540
- After-tax cash flow
- $262/yr
For passive investors: Depreciation is non-cash, so a rental often shows a tax loss while cash-flowing — sheltering income. Rental losses are passive: they offset passive income freely, and up to $25,000/yr can offset ordinary (W-2) income if you actively participate and your MAGI is under $100k (phasing out to $0 by $150k); unused losses carry forward. On sale, claimed depreciation is recaptured at up to 25%, and gains may owe capital-gains tax (a 1031 exchange can defer both). Figures are a year-1 estimate at your 24.0% rate — not tax advice; consult a CPA.
Schools (NCES district)
- District
- North Syracuse Central School District
- NCES district ID
- 3621210
- Math proficiency
- 45% ▼ -9.00%
- Reading proficiency
- 50% ▲ 1.00%
- Median HH income
- $62,904
- Composite
- 41.93/100
- National rank
- #3356
- State rank
- #402 of 590 in NY
Livability — North Syracuse
- Score
- 72/100
- State rank
- #379
- US rank
- #6513
Category grades
Schools grade is shown separately in the Schools card above.
Census & demographics
- City population
- 20,185
- Population (ZIP)
- 12,094
Population outlook (Onondaga County) Hauer SSP2
- Today (2025)
- 467,894 people
- By 2030
- 463,381 · -1.0%
- By 2040
- 447,697 · -4.3%
- By 2050
- 426,399 · -8.9%
- By 2075
- 373,661 · -20.1%
- By 2100
- 307,967 · -34.2%
Race, ethnicity, and origin ACS 2023
- Neighborhood character
- Predominantly White (83%)
- Race & ethnicity
- White 83% Two or more races 10% Black 3% Asian 3% Hispanic / Latino 2%
- Common ancestry
- Romanian 7% Lithuanian 3% Slovak 2%
- Foreign-born
- 8% · Canada, China, Vietnam
- Languages at home
- 89% English-only · Other Indo-European 4% Tagalog/Filipino 3% French/Haitian/Cajun 1%
Political lean MEDSL · Onondaga
- 2024 margin
- D (+17.3) · D 58.6% · R 41.4%
- 2008→2024 swing
- -3.0pp toward R · 2008: 20.3pp · 2024: 17.3pp
- All cycles
- 2024: D+17.3 2020: D+20.6 2016: D+12.8 2012: D+21.1 2008: D+20.3
Not yet ingested
- Civics
- —
Market trends
- HPI YoY
- ▼ -235.12%
- Current HPI
- 326.7838
- Rent YoY
- —
- Metro
- —
- State GDP YoY
- ▲ 2.60%
- F500 in state
- 92
Industry mix (Fortune 500 HQ in NY)
| Industry | F500 HQs | Revenue |
|---|---|---|
| Financial Services | 10 | $950B |
|
||
| Consumer Goods | 9 | $162B |
|
||
| Insurance | 4 | $225B |
|
||
| Telecommunications | 2 | $144B |
|
||
| Pharmaceuticals | 2 | $112B |
|
||
| Media / Entertainment | 2 | $69B |
|
||
Price history
+27618.2% since first listed4 events — show timeline
- 2026-06-03 Listed $304,900 CNYIS
- 2017-08-22 Sold (Public Records) $112,733 Public Records
- 2004-06-21 Sold (MLS) $1,000 WNYREIS
- 2004-06-18 Listed $1,100 WNYREIS
Property tax history
+1.2%/yrLatest (2025): $6,183 · +1.4% YoY. Source: county tax records.
Cash-flow waterfall
monthlySold comps — $/sqft
last 12 mo · ≤1 miLoading sold comps…