80 Zaca St #6 · Buellton, CA
Flood risk 1/10 · Minimal
- FEMA flood zone
- X (unshaded)
- Chance of flooding over 30 yrs
- 0.0%
- Est. flood insurance / yr
- $507 – $1,088
Fire risk 5/10 · Moderate
- Est. fire insurance / yr
- $659 – $1,223
Heat risk 3/10 · Minor
- Hot days now (above 89°F)
- 7 days/yr
- Hot days in 30 yrs
- 17 days/yr
Wind risk 1/10 · Minimal
- Chance of severe wind over 30 yrs
- —
Air-quality risk 5/10 · Moderate
- Unhealthy air days now
- 8 days/yr
- Unhealthy air days in 30 yrs
- 8 days/yr
Risk factors via First Street. Map © Google.
Why this score? — see what drove the B grade
The composite is a weighted blend of 9 inputs, each scored 0–100. Each bar is that input's sub-score; the figure is the points it added to the 100-point composite (weight × sub-score).
- Cash flow +30.0/30.0
- 1% rule +10.0/10.0
- DSCR +10.0/10.0
- ARV discount +7.5/15.0
- Schools +4.7/10.0
- Livability +3.2/5.0
- Rent growth +2.5/5.0
- Condition / age +2.5/5.0
- Appreciation +0.0/10.0
$92,500
🖨 Deal sheet 📄 Offer letter ✓ Due diligence
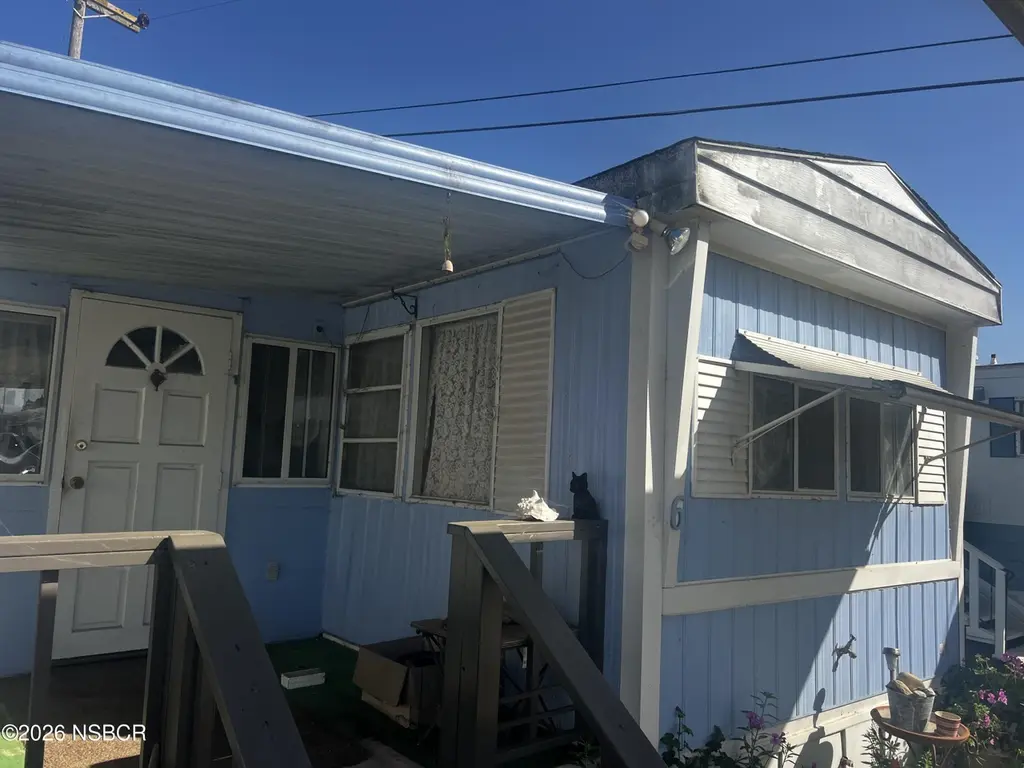
Listing remarks
Entry level 1-bedroom, 1 bath mobile home in Rivergrove Mobile Home Park. This home provides an opportunity to fix up or pull off and replace with a new mobile home. The setting feels open and inviting, with an expansive backyard area that goes to the creek, perfect for relaxing, gardening or entertaining. Upon transfer, the space rent will be $657.90 and includes water and trash service, with gas and electricity billed directly to the homeowner. Central location, moments from shopping, dining, Highway 101 access, and all the beauty and charm that define the Santa Ynez Valley. Note that Rivergrove Mobile Home Park is a 55 and older park.
Key facts
- Central location
- Highway 101 access
- Built 1965
Tags
Property features AI
Finance
- Other: Cable service included
- HOA & community: Monthly land lease of $657.76; Age-restricted community
Exterior
- Utilities: Public water; Public sewer
- Home design: Manufactured home; 40 ft by 20 ft (40' x 20') mobile home
- Construction: Aluminum siding; Composition roof; Pilings and axles foundation/support
- Exterior features: Greenbelt lot feature; Lot in a land-lease community (monthly land lease)
Interior
- Bathrooms: 1 full bathroom
- Interior features: Skylight(s)
Neighborhood map
What this means for you Summary
Snapshot
- This is a 1-bed/1.0-bath manufactured listed at $92k.
Deal economics
- At list price, monthly cash flow is $960 ($12k/yr) — positive.
- The deal already cash-flows at list — no discount required.
- Meets the 1% rule at list price ($2k rent vs $92k).
- Recommended offer: $91k (1.5% below list) — sets the bar for market timing.
- Cap rate 18.8% vs local median 3.0% in Buellton — top-decile yield for the area; either an underpriced asset or a hidden risk that comps aren't pricing in. Stress-test before assuming the spread holds.
Location & tenants
- Location reads 63/100 on livability (#438 in CA) — a middle-class / working-renter tenant base. Strengths: employment A+, housing A+, crime B; Watch: amenities F, commute F, cost of living F.
- Santa Ynez Valley Union High (town): math 37% / reading 60% proficiency, ranked #386 of 1,400 in CA (top 28%) — families likely to look elsewhere, expect single-tenant / working-renter base with shorter leases.
- Market conditions: 36 active listings in the ZIP; 719 units permitted in Santa Barbara County in 2024 (217 in 5+ unit buildings).
Forward outlook
- Local home prices are declining (-3.0%/yr); year-one equity from $640 of loan paydown is wiped out by about $3k of value loss. Plan a longer hold.
- Santa Barbara County population projected at +20% by 2050 — long-run rental-demand tailwind backs the buy-and-hold thesis.
- At projected returns (-3.0% appreciation + 3.0% rent growth), your $26k cash investment doubles in ~3 years — after that, you're playing with house money.
Negotiation context
- It's been on market 30 days — a 2% lower offer ($91k) is reasonable based on typical stale-listing flexibility.
Risks & watch-outs
- Climate carrying-cost: moderate wildfire risk — expect insurance premiums to compound above CPI over the hold.
Questions for the listing agent
- Built in 1965 — when were the roof, HVAC, electrical panel, plumbing, and water heater last replaced?
- Is there a deadline driving the sale (1031 exchange, divorce, estate, relocation)? That informs how much negotiation room exists.
- What's the average days-on-market for RENTAL listings here right now (not sales)? A rising rental-DOM trend means longer vacancies and softer asking-rent achievability than the comps imply.
- What's the recent tenant-quality profile in this submarket — average credit score on applications, eviction rate, late-payment / NSF rate, and stable-employment percentage? A property-management company in the area should have these aggregated.
- How much new for-sale + rental construction is in the pipeline within 1–3 miles? Heavy new supply typically softens prices + rents 12–24 months out; constrained supply supports both.
Investment metrics
- 1% rule
- 2.19% ✓
- Cap rate
- 18.75%
- Cash-on-cash
- 44.50%
- DSCR
- 2.98
- GRM
- 3.8
CMA / ARV
- ARV (on-the-fly)
- $185,250
- Comps found
- 1
Show comp detail 1 sale within ~0.75 mi
| Address | Dist | Beds/Ba | Sqft | Sold | Price | $/sf | Match |
|---|---|---|---|---|---|---|---|
| 80 Zaca St #42 | 0.11mi | 2/1.0 (+1) | 720 (+11%) | 9mo | $205,000 | $285 | 64 |
Match score weights: distance 35% · size 25% · config 20% · recency 20%. Top-matched comps best support the ARV.
Projected returns pro-forma
-3.0% appreciation · 3.0% rent growth · sell at horizon
- IRR
- 41.5%
- Equity multiple
- 2.78×
- Total profit
- $46,210
- Equity at exit
- $13,792
- IRR
- 47.7%
- Equity multiple
- 5.60×
- Total profit
- $119,127
- Equity at exit
- $7,998
Cash invested: $25,900 (down + closing). Projections, not guarantees.
Landlord ↔ Tenant lean methodology
- Overall (STATE)
- 18 Strongly Tenant-Friendly
- State California
- 18 Strongly Tenant-Friendly · D+13
- County
- — inherits STATE
- City
- — inherits STATE
ZIP-level market 93427
- Active inventory
- 36
- Price-to-rent
- 3.8×
Monthly cashflow live
- Estimated rent
- $2,025 medium interval (Pro) →
- Mortgage (P&I)
- −$485
- Tax est. 1.5%
- −$116 /mo · $1,388/yr
- Insurance
- −$39
- HOA
- −$0
- Vacancy / Maint / Mgmt
- −$425
- Net cashflow
- $960
Break-even live
UW: 25.0% down · 7.5% · 30yr · 1.5% tax · 5.0% vac · 8.0% maint · 8.0% mgmt
Financing live
Cash to close
- Down payment
- $23,125
- Closing costs
- $2,775
- Reserves months
- —
- Total cash needed
- —
Loan-product check · same deal, 3 products live
Conventional
25% down · 7.5% · 30yr
- Down + closing
- —
- Monthly P&I
- —
- Monthly cashflow
- —
- DSCR
- —
- Eligible?
- —
Personal DTI + credit; lowest rate.
DSCR
20% down · 8.5% · 30yr
- Down + closing
- —
- Monthly P&I
- —
- Monthly cashflow
- —
- DSCR
- —
- Eligible?
- —
No personal income docs; deal must DSCR.
Hard money
10% down · 12.0% · 12mo
- Down + closing
- —
- Monthly P&I
- —
- Monthly cashflow
- —
- DSCR
- —
- Eligible?
- —
Short-term bridge; refi at stabilization.
Listing history 15 events
-
2026-06-18days on market $92,500 Active 30 DOM
-
2026-06-17days on market $92,500 Active 29 DOM
-
2026-06-16days on market $92,500 Active 28 DOM
-
2026-06-15days on market $92,500 Active 27 DOM
-
2026-06-14days on market $92,500 Active 25 DOM
-
2026-06-10days on market $92,500 Active 22 DOM
-
2026-06-09days on market $92,500 Active 21 DOM
-
2026-06-08days on market $92,500 Active 20 DOM
-
2026-06-07days on market $92,500 Active 19 DOM
-
2026-06-03days on market $92,500 Active 15 DOM
-
2026-06-02days on market $92,500 Active 14 DOM
-
2026-06-01days on market $92,500 Active 13 DOM
-
2026-05-31days on market $92,500 Active 12 DOM
-
2026-05-30days on market $92,500 Active 11 DOM
-
2026-05-19$92,500 Active
ⓘ Source: listings_history table (triggers on properties + properties_extension) + one-shot
backfill from property_details.listing_events for pre-trigger history.
Climate risk First Street
- Flood 1/10 Low FEMA zone X (unshaded) · 0% chance over 30 yrs
- Wildfire 5/10 Major
- Heat 3/10 Moderate 7 d/yr ≥89°F today · 17 d/yr by 30 yrs out
- Wind 1/10 Low
- Air quality 5/10 Major 8 unhealthy d/yr today · 8 by 30 yrs out
Nearby sold comps map
Loading sold comps map…
Walkable amenities ~0.75 mi
Loading nearby amenities…
Taxation est. · year 1
- Rental income
- $24,298
- − Mortgage interest
- −$5,181
- − Property taxes
- −$1,388
- − Insurance
- −$462
- − Repairs & maintenance
- −$1,944
- − Management
- −$1,944
- − Depreciation
- −$2,691
- Taxable income
- $10,688
- Est. tax owed @ 24.0%
- −$2,565
- After-tax cash flow
- $8,960/yr
For passive investors: Depreciation is non-cash, so a rental often shows a tax loss while cash-flowing — sheltering income. Rental losses are passive: they offset passive income freely, and up to $25,000/yr can offset ordinary (W-2) income if you actively participate and your MAGI is under $100k (phasing out to $0 by $150k); unused losses carry forward. On sale, claimed depreciation is recaptured at up to 25%, and gains may owe capital-gains tax (a 1031 exchange can defer both). Figures are a year-1 estimate at your 24.0% rate — not tax advice; consult a CPA.
Schools (NCES district)
- District
- Santa Ynez Valley Union High
- NCES district ID
- 0635850
- Math proficiency
- 37% ▼ -8.00%
- Reading proficiency
- 60% ▼ -13.00%
- Median HH income
- $85,622
- Composite
- 46.97/100
- National rank
- #5151
- State rank
- #386 of 1400 in CA
Livability — Buellton
- Score
- 63/100
- State rank
- #438
- US rank
- #15010
Category grades
Schools grade is shown separately in the Schools card above.
Census & demographics
- Census place
- Buellton, CA
- Population (ZIP)
- 5,866
Population outlook (Santa Barbara County) Hauer SSP2
- Today (2025)
- 484,679 people
- By 2030
- 505,323 · +4.3%
- By 2040
- 545,783 · +12.6%
- By 2050
- 584,263 · +20.5%
- By 2075
- 682,586 · +40.8%
- By 2100
- 723,188 · +49.2%
Race, ethnicity, and origin ACS 2023
- Neighborhood character
- Predominantly White (72%)
- Race & ethnicity
- White 72% Hispanic / Latino 24% Two or more races 8%
- Hispanic origin (detail)
- Mexican 19%
- Common ancestry
- Slovak 5% Italian 3% Lithuanian 2%
- Foreign-born
- 14% · Canada, Jamaica
- Languages at home
- 80% English-only · Spanish 15% French/Haitian/Cajun 2% Other Indo-European 2%
Political lean MEDSL · Santa Barbara
- 2024 margin
- Strong D (+26.7) · D 61.8% · R 35.1% · Other 3.1%
- 2008→2024 swing
- +3.8pp toward D · 2008: 22.9pp · 2024: 26.7pp
- All cycles
- 2024: D+26.7 2020: D+32.1 2016: D+28.2 2012: D+17.1 2008: D+22.9
Not yet ingested
- Civics
- —
Market trends
- HPI YoY
- ▼ -432.89%
- Current HPI
- 247.882
- Rent YoY
- —
- Metro
- —
- State GDP YoY
- ▲ 3.21%
- F500 in state
- 116
Industry mix (Fortune 500 HQ in CA)
| Industry | F500 HQs | Revenue |
|---|---|---|
| Technology | 27 | $1,492B |
|
||
| Financial Services | 3 | $174B |
|
||
| Retail | 3 | $44B |
|
||
| Insurance | 3 | $26B |
|
||
| Media / Entertainment | 2 | $115B |
|
||
| Pharmaceuticals / Biotech | 2 | $62B |
|
||
Price history
1 event — show timeline
- 2026-05-19 Listed $92,500 NSBCRMLS
Cash-flow waterfall
monthlySold comps — $/sqft
last 12 mo · ≤1 miLoading sold comps…