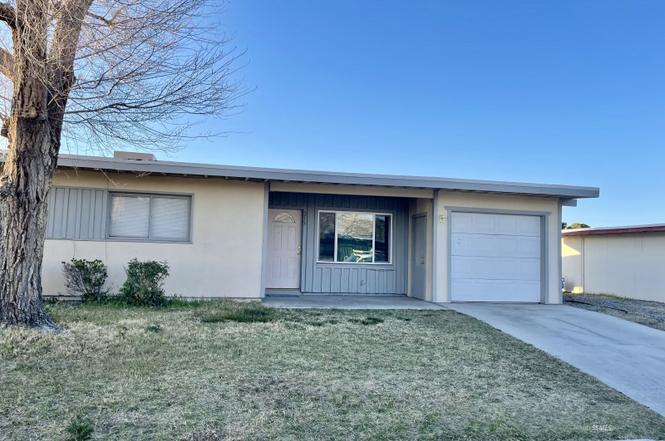
213 Sahara Dr · Ridgecrest, CA
Flood risk 1/10 · Minimal
- FEMA flood zone
- X (unshaded)
- Chance of flooding over 30 yrs
- 0.0%
- Est. flood insurance / yr
- $507 – $1,088
Fire risk 3/10 · Minor
- Est. fire insurance / yr
- $659 – $1,223
Heat risk 8/10 · Major
- Hot days now (above 105°F)
- 7 days/yr
- Hot days in 30 yrs
- 19 days/yr
Wind risk 1/10 · Minimal
- Chance of severe wind over 30 yrs
- —
Air-quality risk 7/10 · Major
- Unhealthy air days now
- 14 days/yr
- Unhealthy air days in 30 yrs
- 15 days/yr
Risk factors via First Street. Map © Google.
Why this score? — see what drove the D grade
The composite is a weighted blend of 9 inputs, each scored 0–100. Each bar is that input's sub-score; the figure is the points it added to the 100-point composite (weight × sub-score).
- Cash flow +12.8/30.0
- ARV discount +7.5/15.0
- 1% rule +4.1/10.0
- DSCR +3.8/10.0
- Livability +3.5/5.0
- Rent growth +3.4/5.0
- Schools +2.9/10.0
- Condition / age +2.5/5.0
- Appreciation +0.0/10.0
$169,900
🖨 Deal sheet 📄 Offer letter ✓ Due diligence
Listing remarks
Charming and updated 4 bedroom, 2 bathroom townhome located in the heart of town with beautiful mountain views from the back patio! This move-in ready home offers numerous recent upgrades throughout. Enjoy new flooring and fresh interior paint that create a bright, welcoming feel. The kitchen features new window, a new stove, new hood, and new dishwasher. Additional new windows in the living room and bathroom bring in great natural light. The hall bathroom has been retextured, and new closet doors add a clean, modern touch. A new swamp cooler helps keep the home comfortable during warm summer months. Washer and dryer hookups are conveniently located inside. Step outside to a covered patio a
Key facts
- New stove
- New flooring
- New hood
Tags
Neighborhood map
What this means for you Summary
Snapshot
- This is a 4-bed/2.0-bath condo listed at $170k.
Deal economics
- At list price, monthly cash flow is $-15 ($-183/yr) — negative.
- To cash-flow at today's rent, offer at most $167k (1.6% below list).
- To meet the 1% rule (rent ≥ 1% of price), the offer needs to be $154k (9.4% below list).
- Recommended offer: $154k (9.4% below list) — sets the bar for 1% rule.
- Cap rate 6.2% vs local median 4.0% in Ridgecrest — top-decile yield for the area; either an underpriced asset or a hidden risk that comps aren't pricing in. Stress-test before assuming the spread holds.
Location & tenants
- Location reads 70/100 on livability (#243 in CA) — a middle-class / working-renter tenant base. Strengths: commute A+, housing A+; Watch: schools C-, amenities D+, cost of living D+.
- Sierra Sands Unified (town): math 25% / reading 39% proficiency, ranked #294 of 517 in CA (top 57%) — families likely to look elsewhere, expect single-tenant / working-renter base with shorter leases.
- Market conditions: Rents rising (+3.6%/yr); 328 active listings in the ZIP; 31 comparable units currently listed for rent nearby; rentals leasing fast (median 3d on market — plan ~1-2 weeks tenant-placement turnaround); solid renter incomes; 3,244 units permitted in Kern County in 2024 (73 in 5+ unit buildings).
Forward outlook
- Local home prices are declining (-3.0%/yr); year-one equity from $1k of loan paydown is wiped out by about $5k of value loss. Plan a longer hold.
- Kern County population projected at +17% by 2050 — long-run rental-demand tailwind backs the buy-and-hold thesis.
Negotiation context
- Only 14 days on market — expect competitive offers; lowballing is unlikely to land.
Risks & watch-outs
- Watch-outs: built in 1954 — expect roof / HVAC / electrical / plumbing capex.
- Climate carrying-cost: extreme-heat days projected 7→19/yr by 2055 (HVAC capex compounding) — expect insurance premiums to compound above CPI over the hold.
Questions for the listing agent
- What do current leases actually rent for vs. the listed asking? Can we see a recent rent roll and the last 12 months of T-12 income?
- Built in 1954 — when were the roof, HVAC, electrical panel, plumbing, and water heater last replaced?
- What does the HOA fee cover, when was the last increase, and are there any pending special assessments or reserve-fund shortfalls?
- Any open or pending special assessments — roof, HVAC, plumbing, elevator, façade? What's the per-unit balance and payoff schedule, and is the seller paying it off at close or rolling it to the buyer?
- Is there a deadline driving the sale (1031 exchange, divorce, estate, relocation)? That informs how much negotiation room exists.
- Crime grade is F in this area — have there been break-ins, vandalism, or insurance claims at this property in the last 3 years? What carrier currently insures it and at what premium?
- The area grade is low — what's the realistic commute time and amenity access for the typical tenant pool here? Any planned neighborhood developments (good or bad) we should know about?
- What's the average days-on-market for RENTAL listings here right now (not sales)? A rising rental-DOM trend means longer vacancies and softer asking-rent achievability than the comps imply.
- What's the recent tenant-quality profile in this submarket — average credit score on applications, eviction rate, late-payment / NSF rate, and stable-employment percentage? A property-management company in the area should have these aggregated.
- How much new apartment / multifamily construction is in the pipeline within 1–3 miles? Heavy new supply (>2% of stock underway) typically softens rents 12–24 months out; light construction supports rent growth.
Investment metrics
- 1% rule
- 0.91% ✗
- Cap rate
- 6.18%
- Cash-on-cash
- -0.39%
- DSCR
- 0.98
- GRM
- 9.2
CMA / ARV
No comps found within radius.
Projected returns pro-forma
-3.0% appreciation · 3.58% rent growth · sell at horizon
- IRR
- -16.2%
- Equity multiple
- 0.42×
- Total profit
- $-27,544
- Equity at exit
- $25,333
- IRR
- -6.8%
- Equity multiple
- 0.55×
- Total profit
- $-21,253
- Equity at exit
- $14,690
Cash invested: $47,572 (down + closing). Projections, not guarantees.
Landlord ↔ Tenant lean methodology
- Overall (STATE)
- 18 Strongly Tenant-Friendly
- State California
- 18 Strongly Tenant-Friendly · D+13
- County
- — inherits STATE
- City
- — inherits STATE
ZIP-level market 93555
- Home prices YoY
- -24.0%
- Rents YoY
- 3.6%
- Active inventory
- 328
- Price-to-rent
- 9.2×
Monthly cashflow live
- Estimated rent
- $1,539 high interval (Pro) →
- Mortgage (P&I)
- −$891
- Tax from tax record
- −$149 /mo · $1,788/yr
- Insurance
- −$71
- HOA
- −$120
- Vacancy / Maint / Mgmt
- −$323
- Net cashflow
- $-15
Break-even live
UW: 25.0% down · 7.5% · 30yr · 1.5% tax · 5.0% vac · 8.0% maint · 8.0% mgmt
Financing live
Cash to close
- Down payment
- $42,475
- Closing costs
- $5,097
- Reserves months
- —
- Total cash needed
- —
Loan-product check · same deal, 3 products live
Conventional
25% down · 7.5% · 30yr
- Down + closing
- —
- Monthly P&I
- —
- Monthly cashflow
- —
- DSCR
- —
- Eligible?
- —
Personal DTI + credit; lowest rate.
DSCR
20% down · 8.5% · 30yr
- Down + closing
- —
- Monthly P&I
- —
- Monthly cashflow
- —
- DSCR
- —
- Eligible?
- —
No personal income docs; deal must DSCR.
Hard money
10% down · 12.0% · 12mo
- Down + closing
- —
- Monthly P&I
- —
- Monthly cashflow
- —
- DSCR
- —
- Eligible?
- —
Short-term bridge; refi at stabilization.
Rent comps 31 comps
| Address | Beds | Baths | Sqft | Rent | $/sqft | DOM | Units | Dist |
|---|---|---|---|---|---|---|---|---|
| 238 N Gold Canyon St Unit C537A Ridgecrest, CA | 3.0 | 1.0 | 1030 | $1,445 | $1.40 | 2d | 1 | 0.20mi |
| 401 Oasis Dr Ridgecrest, CA | 2.0–4.0 | 1.0–2.0 | 982 | $1,495 | $1.52 | 2d | 7 | 0.22mi |
| 412 Palm Dr Ridgecrest, CA | 3.0 | 1.0 | 1014 | $1,250 | $1.23 | 21d | 1 | 0.29mi |
| 117 S Silver Ridge St Ridgecrest, CA | 3.0 | 2.0 | 1144 | $1,500 | $1.31 | 43d | 1 | 0.30mi |
| 401 Cisco St Unit R416A Ridgecrest, CA | 3.0 | 1.0 | 1017 | $818 | $0.80 | 2d | 1 | 0.37mi |
| 401 Cisco St Unit C405A Ridgecrest, CA | 3.0 | 1.0 | 1017 | $940 | $0.92 | 2d | 1 | 0.37mi |
| 332 N Alvord St Unit 332 Ridgecrest, CA | 3.0 | 2.0 | 1100 | $1,100 | $1.00 | 43d | 1 | 0.47mi |
| 112 Rawhide Ln Ridgecrest, CA | 3.0 | 2.0 | 1467 | $1,650 | $1.12 | 2d | 1 | 0.51mi |
| 219 W Robertson Rd Ridgecrest, CA | 3.0 | 1.0 | 955 | $1,200 | $1.26 | 19d | 1 | 0.67mi |
| 236 S American St Ridgecrest, CA | 3.0 | 2.0 | 1407 | $1,650 | $1.17 | 43d | 1 | 0.70mi |
| 401 N Norma St Ridgecrest, CA | 3.0 | 2.0 | 1360 | $1,500 | $1.10 | 2d | 1 | 0.70mi |
| 121 N Gateway Blvd Ridgecrest, CA | 2.0–3.0 | 1.5–2.5 | 1147 | $1,399 | $1.22 | 2d | 4 | 0.75mi |
| 247 E Upjohn Ave Ridgecrest, CA | 3.0 | 2.5 | 1305 | $1,425 | $1.09 | 2d | 1 | 0.76mi |
| 528 Heatherglen Dr Ridgecrest, CA | 3.0 | 2.0 | 1370 | $1,725 | $1.26 | 2d | 1 | 0.77mi |
| 201 W Drummond Ave Ridgecrest, CA | 3.0 | 2.0 | 1190 | $1,150 | $0.97 | 2d | 1 | 0.80mi |
| 520 Silveridge St Ridgecrest, CA | 3.0 | 2.0 | 1471 | $2,000 | $1.36 | 43d | 1 | 0.82mi |
| 430 W Wilson Ave Ridgecrest, CA | 3.0 | 1.0 | 1080 | $1,350 | $1.25 | 2d | 1 | 0.87mi |
| 740 W Church Ave Ridgecrest, CA | 4.0 | 2.0 | 1500 | $1,800 | $1.20 | 19d | 1 | 1.13mi |
| 305 S Richmond Rd Unit A Ridgecrest, CA | 3.0 | 1.5 | 1168 | $1,275 | $1.09 | 43d | 1 | 1.16mi |
| 1019 Peg St Ridgecrest, CA | 4.0 | 2.0 | 1458 | $1,800 | $1.23 | 3d | 1 | 1.21mi |
| 224 Larkspur St Ridgecrest, CA | 3.0 | 2.0 | 1362 | $1,995 | $1.46 | 2d | 1 | 1.24mi |
| 824 S Norma St Unit 832A Ridgecrest, CA | 3.0 | 2.0 | 925 | $1,650 | $1.78 | 2d | 1 | 1.31mi |
| 128 S Locust St Apt B Ridgecrest, CA | 3.0 | 2.5 | 1100 | $1,200 | $1.09 | 2d | 1 | 1.33mi |
| 134 S Locust St Apt B Ridgecrest, CA | 3.0 | 3.0 | 1150 | $1,425 | $1.24 | 2d | 1 | 1.33mi |
| 418 Mount Baldy Cir Ridgecrest, CA | 3.0 | 2.0 | 1497 | $1,950 | $1.30 | 2d | 1 | 1.39mi |
| 816 Capehart Ct Unit A Ridgecrest, CA | 3.0 | 2.0 | 1147 | $1,250 | $1.09 | 43d | 1 | 1.41mi |
| 428 W Ward Ave Ridgecrest, CA | 3.0 | 2.0 | 1498 | $1,850 | $1.23 | 2d | 1 | 1.42mi |
| 824 Capehart Ct Apt C Ridgecrest, CA | 3.0 | 2.0 | 1147 | $1,250 | $1.09 | 2d | 1 | 1.43mi |
| 825 Capehart Ct Unit D Ridgecrest, CA | 3.0 | 2.0 | 1147 | $1,200 | $1.05 | 2d | 1 | 1.45mi |
| 533 W Ward Ave Unit C Ridgecrest, CA | 3.0 | 2.5 | 1295 | $1,300 | $1.00 | 19d | 1 | 1.46mi |
| 1128 Argus Ave Ridgecrest, CA | 3.0 | 2.0 | 1346 | $11,800 | $8.77 | 43d | 1 | 1.50mi |
HOA detail condo
- Monthly dues
- $120 · $1,440/yr
- Assessments
- None detected in remarks — confirm with the listing agent.
Listing history 3 events
-
2026-03-20status Pending
-
2026-03-06$169,900 Active
-
2002-02-08soldstatus $4,750,000
ⓘ Source: listings_history table (triggers on properties + properties_extension) + one-shot
backfill from property_details.listing_events for pre-trigger history.
Tax reassessment forecast CA · Resets to sale price
- Current annual tax
- $1,788 · $149/mo
- Projected year-2 tax
- $1,788 · $149/mo
- Expected delta
- $0/yr ($0/mo · 0.0%)
ⓘ Screening estimate from a state-policy table — verify with the county assessor before closing.
Climate risk First Street
- Flood 1/10 Low FEMA zone X (unshaded) · 0% chance over 30 yrs
- Wildfire 3/10 Moderate
- Heat 8/10 Severe 7 d/yr ≥105°F today · 19 d/yr by 30 yrs out
- Wind 1/10 Low
- Air quality 7/10 Severe 14 unhealthy d/yr today · 15 by 30 yrs out
Nearby sold comps map
Loading sold comps map…
Walkable amenities ~0.75 mi
Loading nearby amenities…
Taxation est. · year 1
- Rental income
- $18,463
- − Mortgage interest
- −$9,517
- − Property taxes
- −$1,788
- − Insurance
- −$850
- − Repairs & maintenance
- −$1,477
- − Management
- −$1,477
- − HOA
- −$1,440
- − Depreciation
- −$4,943
- Taxable loss
- −$3,028
- Est. tax savings @ 24.0%
- +$727
- After-tax cash flow
- $543/yr
For passive investors: Depreciation is non-cash, so a rental often shows a tax loss while cash-flowing — sheltering income. Rental losses are passive: they offset passive income freely, and up to $25,000/yr can offset ordinary (W-2) income if you actively participate and your MAGI is under $100k (phasing out to $0 by $150k); unused losses carry forward. On sale, claimed depreciation is recaptured at up to 25%, and gains may owe capital-gains tax (a 1031 exchange can defer both). Figures are a year-1 estimate at your 24.0% rate — not tax advice; consult a CPA.
Schools (NCES district)
- District
- Sierra Sands Unified
- NCES district ID
- 0636800
- Math proficiency
- 25% ▼ -11.00%
- Reading proficiency
- 39% ▼ -11.00%
- Median HH income
- $58,937
- Composite
- 28.66/100
- National rank
- #6699
- State rank
- #294 of 517 in CA
Livability — Ridgecrest
- Score
- 70/100
- State rank
- #243
- US rank
- #8014
Category grades
Schools grade is shown separately in the Schools card above.
Census & demographics
- Census place
- Ridgecrest, CA
- County
- Kern County · 710,371 people
- City population
- 33,845
- Metro
- Bakersfield, CA
- Population (ZIP)
- 33,845
- Household income
- $86,700
- Rent vs Own
- Severe rent burden
- 975.0
Population outlook (Kern County) Hauer SSP2
- Today (2025)
- 947,286 people
- By 2030
- 978,984 · +3.3%
- By 2040
- 1,045,018 · +10.3%
- By 2050
- 1,105,232 · +16.7%
- By 2075
- 1,229,538 · +29.8%
- By 2100
- 1,238,059 · +30.7%
Race, ethnicity, and origin ACS 2023
- Neighborhood character
- Majority White (65%)
- Race & ethnicity
- White 65% Hispanic / Latino 20% Two or more races 12% Black 4% Asian 4% Native American 1%
- Hispanic origin (detail)
- Mexican 15%
- Common ancestry
- Italian 4% Lithuanian 2% Slovak 2%
- Foreign-born
- 7% · Canada
- Languages at home
- 84% English-only · Spanish 11% Other Indo-European 1% Other Asian/Pacific 1%
Political lean MEDSL · Kern
- 2024 margin
- Strong R (+21.1) · D 38.2% · R 59.3% · Other 2.5%
- 2008→2024 swing
- -3.3pp toward R · 2008: -17.8pp · 2024: -21.1pp
- All cycles
- 2024: R+21.1 2020: R+10.2 2016: R+15.0 2012: R+20.9 2008: R+17.8
Not yet ingested
- Civics
- —
Market trends
- HPI YoY
- ▼ -120.17%
- Current HPI
- 380.5208
- Rent YoY
- ▲ 3.58%
- Metro
- Bakersfield, CA
- State GDP YoY
- ▲ 3.21%
- F500 in state
- 116
Industry mix (Fortune 500 HQ in CA)
| Industry | F500 HQs | Revenue |
|---|---|---|
| Technology | 27 | $1,492B |
|
||
| Financial Services | 3 | $174B |
|
||
| Retail | 3 | $44B |
|
||
| Insurance | 3 | $26B |
|
||
| Media / Entertainment | 2 | $115B |
|
||
| Pharmaceuticals / Biotech | 2 | $62B |
|
||
Price history
-96.4% since first listed3 events — show timeline
- 2026-03-20 Pending — SSMLS
- 2026-03-06 Listed $169,900 SSMLS
- 2002-02-08 Sold (Public Records) $4,750,000 Public Records
Property tax history
+3.5%/yrLatest (2025): $1,788 · +39.7% YoY. Source: county tax records.
Cash-flow waterfall
monthlySold comps — $/sqft
last 12 mo · ≤1 miLoading sold comps…