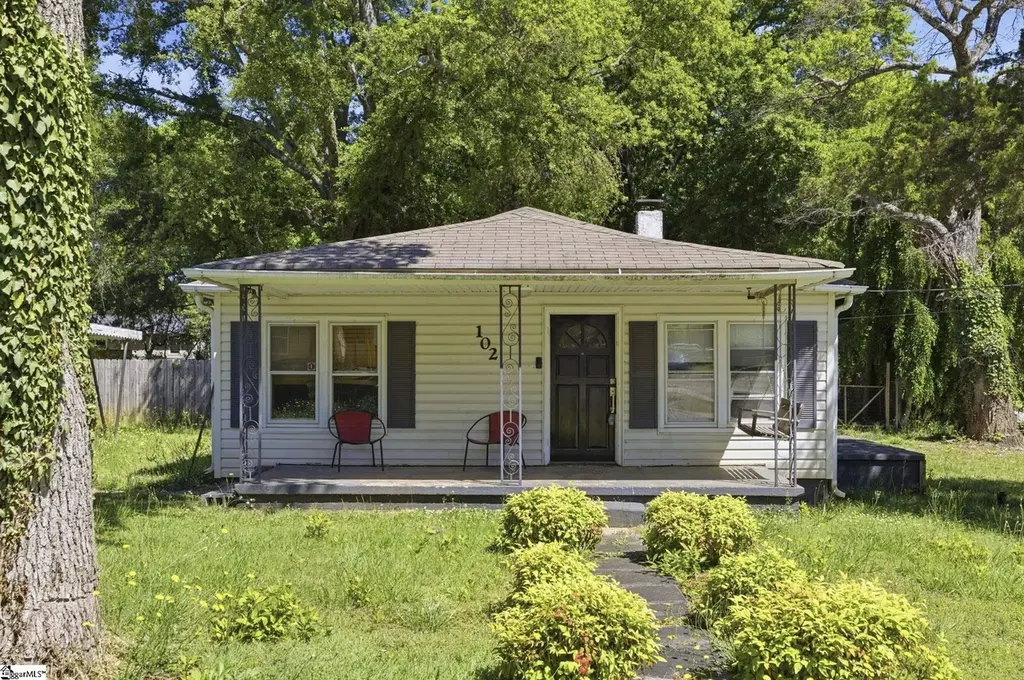
102 Jasmine Dr · Parker, SC
Flood risk 1/10 · Minimal
- FEMA flood zone
- X (unshaded)
- Chance of flooding over 30 yrs
- 0.0%
- Est. flood insurance / yr
- $507 – $1,088
Fire risk 2/10 · Minimal
- Est. fire insurance / yr
- $783 – $1,453
Heat risk 6/10 · Moderate
- Hot days now (above 102°F)
- 7 days/yr
- Hot days in 30 yrs
- 16 days/yr
Wind risk 2/10 · Minimal
- Chance of severe wind over 30 yrs
- 1.0%
Air-quality risk 4/10 · Minor
- Unhealthy air days now
- 4 days/yr
- Unhealthy air days in 30 yrs
- 4 days/yr
Risk factors via First Street. Map © Google.
Why this score? — see what drove the B+ grade
The composite is a weighted blend of 9 inputs, each scored 0–100. Each bar is that input's sub-score; the figure is the points it added to the 100-point composite (weight × sub-score).
- Cash flow +30.0/30.0
- ARV discount +15.0/15.0
- 1% rule +10.0/10.0
- DSCR +10.0/10.0
- Schools +4.2/10.0
- Livability +3.7/5.0
- Rent growth +2.9/5.0
- Condition / age +2.5/5.0
- Appreciation +0.0/10.0
$115,000
🖨 Deal sheet (PDF) 📄 Offer letter ✓ Due diligence
Listing remarks
Bring your vision and creativity to 102 Jasmine Drive in Greenville! This fixer-upper presents an incredible opportunity for investors looking for upside or a buyer looking to customize a home to their own style and needs. Situated in an established neighborhood, the property offers convenient access to nearby schools, local shopping, restaurants, parks, and everyday conveniences, with easy connectivity to surrounding areas of Greenville County. Located just two miles from downtown Greenville and only one mile from the vibrant Village of West Greenville, you'll enjoy quick access to some of the area's best dining, shopping, art galleries, and entertainment. Whether you're looking for your n
Key facts
- Convenient access
- Parks
- Local shopping
Tags
Property features AI
Finance
- Other: Lead-based paint disclosure required; Residential property disclosure required
- HOA & community: No HOA fees
Exterior
- Parking: Detached carport; Carport for 1 vehicle; Gravel driveway
- Utilities: Public water; Public sewer; Public garbage pickup; Electric service
- Home design: Single-story home; Approximately 50+ years old; Crawl space foundation
- Construction: Vinyl siding exterior; Composition shingle roof
- Exterior features: Front porch; Some storm doors; Some storm windows; Corner, level lot; Lot 1/2 acre or less
Interior
- Kitchen: Kitchen approx. 12 x 13; Appliances listed as 'Other (See Remarks)'
- Bedrooms: Primary bedroom on main level (approx. 12 x 20); Second bedroom (approx. 12 x 9); Two bedrooms on the main level
- Flooring: Carpet; Vinyl
- Bathrooms: One full bathroom on the main level
- Heating & cooling: Electric heating; Central forced cooling; Electric water heater
- Interior features: Ceiling fans; Smooth ceilings; No fireplace
- Laundry & utility: Laundry on the first floor
Neighborhood map
What this means for you Summary
Snapshot
- This is a 3-bed/1.0-bath single-family listed at $115k.
Deal economics
- At list price, monthly cash flow is $661 ($8k/yr) — positive.
- The deal already cash-flows at list — no discount required.
- Meets the 1% rule at list price ($2k rent vs $115k).
- Cap rate 13.2% vs local median 4.2% in Parker — top-decile yield for the area; either an underpriced asset or a hidden risk that comps aren't pricing in. Stress-test before assuming the spread holds.
Location & tenants
- Location reads 74/100 on livability (#31 in SC, #4,642 nationally) — a middle-class / working-renter tenant base. Strengths: commute A+, cost of living A+, housing A+; Watch: crime F, employment D-.
- Greenville 01 (suburban): math 44% / reading 54% proficiency, ranked #10 of 80 in SC (top 12%) — families likely to look elsewhere, expect single-tenant / working-renter base with shorter leases.
- Zoned schools: Hollis Academy (math 28% / reading 21%, grade F, #452 of 597 statewide, top 78%, 608 students, 100% FRL) — zoned schools average 100% FRL vs 42% district-wide (58 pts higher); higher-poverty schools than district average — tighter screening recommended.
- Zoned-school proficiency averages 24% at this address vs 49% district-wide (-24 pts) — the specific schools serving this property underperform the Greenville 01 average; the district grade overstates school quality for this exact location.
- Market conditions: Rents rising (+1.7%/yr); 278 active listings in the ZIP; 20 comparable units currently listed for rent nearby; rentals at typical pace (median 24d on market — plan ~3-4 weeks tenant-placement turnaround); 5,595 units permitted in Greenville County in 2024 (566 in 5+ unit buildings).
Forward outlook
- Local home prices are declining (-3.0%/yr); year-one equity from $795 of loan paydown is wiped out by about $3k of value loss. Plan a longer hold.
- Greenville County population projected at +34% by 2050 — long-run rental-demand tailwind backs the buy-and-hold thesis.
- At projected returns (-3.0% appreciation + 1.7% rent growth), your $32k cash investment doubles in ~6 years — after that, you're playing with house money.
Negotiation context
- Only 13 days on market — expect competitive offers; lowballing is unlikely to land.
- 2 sale attempts since 13y ago with the ask held roughly flat each time — persistent listings suggest the price (not the market) is what's stuck; bring a comps-based counter.
- Current owner paid $39k; list at $115k implies a 195% gain — meaningful room to come down on a strong offer.
Risks & watch-outs
- Watch-outs: built in 1940 — expect roof / HVAC / electrical / plumbing capex.
- Climate carrying-cost: extreme-heat days projected 7→16/yr by 2055 (HVAC capex compounding) — expect insurance premiums to compound above CPI over the hold.
Questions for the listing agent
- Built in 1940 — when were the roof, HVAC, electrical panel, plumbing, and water heater last replaced?
- Is there a deadline driving the sale (1031 exchange, divorce, estate, relocation)? That informs how much negotiation room exists.
- Schools are F-rated, which usually means shorter tenancies and higher turnover. Who's the typical renter profile here, and what's been the actual vacancy rate?
- Crime grade is F in this area — have there been break-ins, vandalism, or insurance claims at this property in the last 3 years? What carrier currently insures it and at what premium?
- What's the average days-on-market for RENTAL listings here right now (not sales)? A rising rental-DOM trend means longer vacancies and softer asking-rent achievability than the comps imply.
- What's the recent tenant-quality profile in this submarket — average credit score on applications, eviction rate, late-payment / NSF rate, and stable-employment percentage? A property-management company in the area should have these aggregated.
- How much new for-sale + rental construction is in the pipeline within 1–3 miles? Heavy new supply typically softens prices + rents 12–24 months out; constrained supply supports both.
Investment metrics
- 1% rule
- 1.51% ✓
- Cap rate
- 13.19%
- Cash-on-cash
- 24.63%
- DSCR
- 2.10
- GRM
- 5.5
CMA / ARV
- ARV (on-the-fly)
- $179,712
- Comps found
- 12
Show comp detail 12 sales within ~0.75 mi
| Address | Dist | Beds/Ba | Sqft | Sold | Price | $/sf | Match |
|---|---|---|---|---|---|---|---|
| 107 Jasmine Dr | 0.05mi | 2/1.0 (-1) | 916 (-2%) | 9mo | $188,000 | $205 | 82 |
| 26 Baldwin St | 0.37mi | 2/1.0 (-1) | 952 (+2%) | 7mo | $182,500 | $192 | 69 |
| 3 Gaylord St | 0.17mi | 2/1.0 (-1) | 1,002 (+7%) | 12mo | $197,000 | $197 | 65 |
| 18 8th Ave | 0.10mi | 2/1.0 (-1) | 1,054 (+13%) | 7mo | $189,000 | $179 | 64 |
| 13 Calvert St | 0.35mi | 2/1.0 (-1) | 970 (+4%) | 14mo | $180,000 | $186 | 61 |
| 101 Mason St | 0.70mi | 2/1.0 (-1) | 945 (+1%) | 1mo | $197,500 | $209 | 60 |
| 11 Gaylord St | 0.16mi | 3/2.0 | 1,034 (+10%) | 14mo | $142,000 | $137 | 60 |
| 8 Baldwin St | 0.40mi | 2/1.0 (-1) | 900 (-4%) | 14mo | $151,500 | $168 | 58 |
| 212 S Texas Ave | 0.61mi | 2/1.0 (-1) | 953 (+2%) | 9mo | $185,000 | $194 | 56 |
| 313 S Texas Ave | 0.71mi | 2/1.0 (-1) | 936 (0%) | 15mo | $228,000 | $244 | 50 |
| 105 Francis Ave | 0.71mi | 2/2.0 (-1) | 991 (+6%) | 4mo | $182,500 | $184 | 44 |
| 221 Beatrice St | 0.71mi | 2/1.0 (-1) | 1,008 (+8%) | 11mo | $190,000 | $188 | 40 |
Match score weights: distance 35% · size 25% · config 20% · recency 20%. Top-matched comps best support the ARV.
Projected returns pro-forma
-3.0% appreciation · 1.72% rent growth · sell at horizon
- IRR
- 16.6%
- Equity multiple
- 1.66×
- Total profit
- $21,225
- Equity at exit
- $17,147
- IRR
- 24.3%
- Equity multiple
- 2.98×
- Total profit
- $63,748
- Equity at exit
- $9,943
Cash invested: $32,200 (down + closing). Projections, not guarantees.
Landlord ↔ Tenant lean methodology
- Overall (STATE)
- 90 Strongly Landlord-Friendly
- State South Carolina
- 90 Strongly Landlord-Friendly · R+6
- County
- — inherits STATE
- City
- — inherits STATE
ZIP-level market 29611
- Home prices YoY
- -34.6%
- Rents YoY
- 1.7%
- Active inventory
- 278
- Price-to-rent
- 5.5×
Monthly cashflow live
- Estimated rent
- $1,737 high interval (Pro) →
- Mortgage (P&I)
- −$603
- Tax from tax record
- −$60 /mo · $725/yr
- Insurance
- −$48
- HOA
- −$0
- Vacancy / Maint / Mgmt
- −$365
- Net cashflow
- $661
Break-even live
Sensitivity live
| Price | -10% $726 | -5% $693 | +0% $661 | +5% $628 | +10% $596 |
|---|---|---|---|---|---|
| Rent | -10% $524 | -5% $592 | +0% $661 | +5% $730 | +10% $798 |
| Rate | -1.0pp $719 | -0.5pp $690 | base $661 | +0.5pp $631 | +1.0pp $601 |
UW: 25.0% down · 7.5% · 30yr · 1.5% tax · 5.0% vac · 8.0% maint · 8.0% mgmt
Financing live
Cash to close
- Down payment
- $28,750
- Closing costs
- $3,450
- Reserves months
- —
- Total cash needed
- —
Loan-product check · same deal, 3 products live
Conventional
25% down · 7.5% · 30yr
- Down + closing
- —
- Monthly P&I
- —
- Monthly cashflow
- —
- DSCR
- —
- Eligible?
- —
Personal DTI + credit; lowest rate.
DSCR
20% down · 8.5% · 30yr
- Down + closing
- —
- Monthly P&I
- —
- Monthly cashflow
- —
- DSCR
- —
- Eligible?
- —
No personal income docs; deal must DSCR.
Hard money
10% down · 12.0% · 12mo
- Down + closing
- —
- Monthly P&I
- —
- Monthly cashflow
- —
- DSCR
- —
- Eligible?
- —
Short-term bridge; refi at stabilization.
Rent comps 20 comps
| Address | Beds | Baths | Sqft | Rent | $/sqft | DOM | Units | Dist |
|---|---|---|---|---|---|---|---|---|
| 19 Saco St Greenville, SC | 2.0 | 2.0 | 1050 | $2,400 | $2.29 | 24d | 1 | 0.58mi |
| 701 Easley Bridge Rd Greenville, SC | 3.0 | 1.0–2.5 | 1324 | $3,465 | $2.62 | 3d | 110 | 0.67mi |
| 4 Kilgore St Greenville, SC | 2.0 | 1.0 | 1050 | $1,500 | $1.43 | 24d | 1 | 0.70mi |
| 29 4th St Greenville, SC | 3.0 | 2.0 | 1120 | $1,695 | $1.51 | 3d | 1 | 0.81mi |
| 5001 Assembly View Cir Greenville, SC | 1.0–3.0 | 1.0–2.0 | 975 | $1,551 | $1.59 | 3d | 27 | 0.83mi |
| 119 Heatherly Dr Greenville, SC | 2.0 | 1.0 | 896 | $950 | $1.06 | 24d | 1 | 0.96mi |
| 1 E Main St Greenville, SC | 1.0–3.0 | 1.0–2.0 | 1241 | $2,600 | $2.10 | 3d | 28 | 1.00mi |
| 8 Judson Rd Greenville, SC | 2.0 | 1.0 | 944 | $1,200 | $1.27 | 24d | 1 | 1.08mi |
| 3001 Lizzie Dr Greenville, SC | 1.0–3.0 | 1.0–2.0 | 976 | $1,401 | $1.44 | 24d | 1 | 1.23mi |
| 317 Douthit St Greenville, SC | 2.0 | 1.0 | 825 | $1,095 | $1.33 | 3d | 1 | 1.26mi |
| 33 9th St Greenville, SC | 2.0 | 1.0 | 886 | $1,000 | $1.13 | 24d | 1 | 1.28mi |
| 4 Averill St Greenville, SC | 2.0 | 1.0 | 728 | $1,400 | $1.92 | 24d | 1 | 1.32mi |
| 39 E 7th St Greenville, SC | 3.0 | 2.0 | 1120 | $1,750 | $1.56 | 3d | 1 | 1.33mi |
| 1 Craven St Unit 8 Greenville, SC | 2.0 | 1.0 | 850 | $1,350 | $1.59 | 3d | 1 | 1.33mi |
| 5 Zarline St Greenville, SC | 3.0 | 1.0 | 1060 | $1,095 | $1.03 | 19d | 1 | 1.33mi |
| 111 N Calhoun St Greenville, SC | 2.0 | 1.0 | 650 | $1,250 | $1.92 | 24d | 1 | 1.35mi |
| 19 Dargan St Greenville, SC | 2.0 | 1.0 | 962 | $1,400 | $1.46 | 14d | 1 | 1.39mi |
| 500 Birnie St Greenville, SC | 2.0 | 1.0 | 980 | $1,475 | $1.51 | 24d | 1 | 1.39mi |
| 15 Best Dr Greenville, SC | 3.0 | 1.5 | 1020 | $1,125 | $1.10 | 19d | 1 | 1.40mi |
| 304 N Leach St Greenville, SC | 2.0 | 1.0 | 756 | $1,250 | $1.65 | 24d | 1 | 1.45mi |
Listing history 5 events
-
2026-05-15$115,000 Active
-
2013-08-23soldstatus $39,000
-
2013-08-16soldstatus $39,000
-
2013-07-11historical
-
2013-05-22$39,000
ⓘ Source: listings_history table (triggers on properties + properties_extension) + one-shot
backfill from property_details.listing_events for pre-trigger history.
Tax reassessment forecast SC · Resets to sale price
- Current annual tax
- $725 · $60/mo
- Projected year-2 tax
- $725 · $60/mo
- Expected delta
- $0/yr ($0/mo · 0.0%)
ⓘ Screening estimate from a state-policy table — verify with the county assessor before closing.
Climate risk First Street
- Flood 1/10 Low FEMA zone X (unshaded) · 0% chance over 30 yrs
- Wildfire 2/10 Low
- Heat 6/10 Major 7 d/yr ≥102°F today · 16 d/yr by 30 yrs out
- Wind 2/10 Low 100% chance of damaging wind over 30 yrs
- Air quality 4/10 Moderate 4 unhealthy d/yr today · 4 by 30 yrs out
Nearby sold comps map
Loading sold comps map…
Walkable amenities ~0.75 mi
Loading nearby amenities…
Taxation est. · year 1
- Rental income
- $20,846
- − Mortgage interest
- −$6,442
- − Property taxes
- −$725
- − Insurance
- −$575
- − Repairs & maintenance
- −$1,668
- − Management
- −$1,668
- − Depreciation
- −$3,345
- Taxable income
- $6,423
- Est. tax owed @ 24.0%
- −$1,541
- After-tax cash flow
- $6,389/yr
For passive investors: Depreciation is non-cash, so a rental often shows a tax loss while cash-flowing — sheltering income. Rental losses are passive: they offset passive income freely, and up to $25,000/yr can offset ordinary (W-2) income if you actively participate and your MAGI is under $100k (phasing out to $0 by $150k); unused losses carry forward. On sale, claimed depreciation is recaptured at up to 25%, and gains may owe capital-gains tax (a 1031 exchange can defer both). Figures are a year-1 estimate at your 24.0% rate — not tax advice; consult a CPA.
Schools (NCES district)
- District
- Greenville 01
- NCES district ID
- 4502310
- Math proficiency
- 44% ▼ -10.00%
- Reading proficiency
- 54% ▼ -2.00%
- Median HH income
- $49,596
- Composite
- 41.88/100
- National rank
- #3370
- State rank
- #10 of 80 in SC
Livability — Parker
- Score
- 74/100
- State rank
- #31
- US rank
- #4642
Category grades
Schools grade is shown separately in the Schools card above.
Census & demographics
- Census place
- Parker, SC
- County
- Greenville County · 573,815 people
- Metro
- Greenville-Anderson, SC
- Population (ZIP)
- 32,365
- Household income
- $51,565
- Rent vs Own
- Severe rent burden
- 1754.0
Population outlook (Greenville County) Hauer SSP2
- Today (2025)
- 574,580 people
- By 2030
- 615,615 · +7.1%
- By 2040
- 695,373 · +21.0%
- By 2050
- 769,367 · +33.9%
- By 2075
- 933,296 · +62.4%
- By 2100
- 1,029,196 · +79.1%
Race, ethnicity, and origin ACS 2023
- Neighborhood character
- Highly diverse neighborhood (Simpson 0.70)
- Race & ethnicity
- White 41% Black 29% Hispanic / Latino 22% Two or more races 12%
- Hispanic origin (detail)
- Mexican 12% Puerto Rican 2%
- Common ancestry
- Slovak 1% Italian 1% Serbian 1%
- Foreign-born
- 12% · Canada, Jamaica, China
- Languages at home
- 79% English-only · Spanish 19% Russian/Polish/Slavic 1%
Political lean MEDSL · Greenville
- 2024 margin
- Strong R (+22.2) · D 38.0% · R 60.2% · Other 1.8%
- 2008→2024 swing
- +1.7pp toward D · 2008: -23.9pp · 2024: -22.2pp
- All cycles
- 2024: R+22.2 2020: R+18.2 2016: R+24.7 2012: R+27.8 2008: R+23.9
Not yet ingested
- Civics
- —
Market trends
- HPI YoY
- ▼ -139.58%
- Current HPI
- 264.2891
- Rent YoY
- ▲ 1.72%
- Metro
- Greenville-Anderson, SC
- State GDP YoY
- ▲ 4.51%
- F500 in state
- 2
Industry mix (Fortune 500 HQ in SC)
| Industry | F500 HQs | Revenue |
|---|---|---|
| Packaging | 1 | $7B |
|
||
Price history
+194.9% since first listed5 events — show timeline
- 2026-05-15 Listed $115,000 Greater Greenville MLS
- 2013-08-23 Sold (Public Records) $39,000 Public Records
- 2013-08-16 Sold (MLS) $39,000 Greater Greenville MLS
- 2013-07-11 Listing Removed — Greater Greenville MLS
- 2013-05-22 Listed $39,000 Greater Greenville MLS
Property tax history
+9.4%/yrLatest (2025): $725 · +4.0% YoY. Source: county tax records.
Cash-flow waterfall
monthlySold comps — $/sqft
last 12 mo · ≤1 miLoading sold comps…