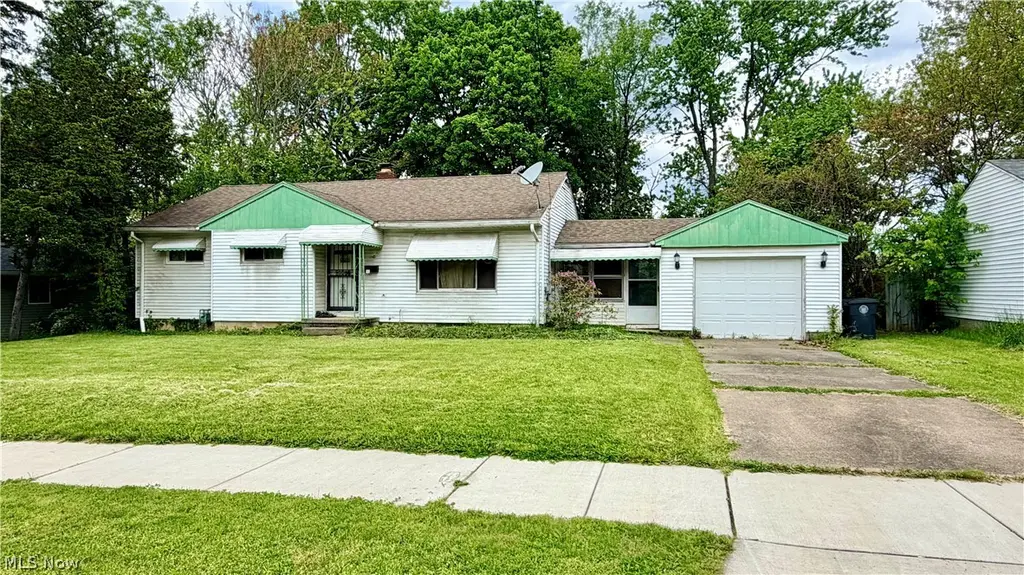
1101 Fess Ave · Akron, OH
Flood risk 1/10 · Minimal
- FEMA flood zone
- X (unshaded)
- Chance of flooding over 30 yrs
- 0.0%
- Est. flood insurance / yr
- $473 – $860
Fire risk 1/10 · Minimal
- Est. fire insurance / yr
- $713 – $1,323
Heat risk 3/10 · Minor
- Hot days now (above 97°F)
- 7 days/yr
- Hot days in 30 yrs
- 17 days/yr
Wind risk 1/10 · Minimal
- Chance of severe wind over 30 yrs
- —
Air-quality risk 2/10 · Minimal
- Unhealthy air days now
- 1 days/yr
- Unhealthy air days in 30 yrs
- 2 days/yr
Risk factors via First Street. Map © Google.
Why this score? — see what drove the B grade
The composite is a weighted blend of 9 inputs, each scored 0–100. Each bar is that input's sub-score; the figure is the points it added to the 100-point composite (weight × sub-score).
- Cash flow +30.0/30.0
- DSCR +10.0/10.0
- ARV discount +10.0/15.0
- 1% rule +8.4/10.0
- Appreciation +4.9/10.0
- Livability +4.0/5.0
- Rent growth +2.5/5.0
- Condition / age +2.5/5.0
- Schools +2.1/10.0
$90,000
🖨 Deal sheet 📄 Offer letter ✓ Due diligence
Listing remarks
Investment opportunity for handy buyer to a one floor living property. Needs some tlc. Property is close to gym, shopping plaza/restuarants, and highways.
Key facts
- Close to restaurants
- Close to gym
- One floor living
Tags
Property features AI
Finance
- Financial info: Annual taxes listed (tax year provided)
Exterior
- Parking: Attached garage (1 car), paved
- Utilities: Public water; Public sewer
- Home design: Single-story home; Aluminum siding; Shingle (asphalt/fiberglass) roof; Slab foundation; Built per public records
- Construction: Aluminum siding construction; Asphalt/fiberglass roof; Slab foundation; Year built from public records
- Exterior features: Lot approximately 0.121 acres
Interior
- Bedrooms: 3 main-level bedrooms
- Bathrooms: 1 full bathroom on the main level
- Heating & cooling: Forced air gas heating
- Interior features: Full basement
- Laundry & utility: Laundry in basement
Neighborhood map
What this means for you Summary
Snapshot
- This is a 3-bed/1.0-bath single-family listed at $90k.
Deal economics
- At list price, monthly cash flow is $349 ($4k/yr) — positive.
- The deal already cash-flows at list — no discount required.
- Meets the 1% rule at list price ($1k rent vs $90k).
- Cap rate 10.9% vs local median 6.6% in Akron — top-decile yield for the area; either an underpriced asset or a hidden risk that comps aren't pricing in. Stress-test before assuming the spread holds.
Location & tenants
- Location reads 81/100 on livability (#104 in OH, #1,591 nationally) — a professional / high-income tenant draw. Strengths: amenities A+, commute A+, cost of living A+; Watch: crime F, employment F.
- Akron City (urban): math 22% / reading 30% proficiency, ranked #602 of 656 in OH (top 92%) — low school quality limits family demand, transient renter base, plan for 1-2y turnover; 66% free/reduced lunch — lower-income household profile, screen leases tightly.
- Market conditions: 42 active listings in the ZIP; 40 comparable units currently listed for rent nearby; rentals at typical pace (median 24d on market — plan ~3-4 weeks tenant-placement turnaround); 42% of comp listings sitting > 30 days — soft ceiling on asking rent; lower-income renter base — watch delinquency; 1,114 units permitted in Summit County in 2024 (397 in 5+ unit buildings).
- At $1,206/mo this rent would consume 52% of the median local household income ($28k/yr) (locally 787% of renters already pay >50% of income on rent) — very limited rent-growth headroom before tenants either downsize or default.
Forward outlook
- In year one you build about $445 of equity ($622 loan paydown + $-177 appreciation (-0.2% local appreciation)).
- Summit County population projected to shrink 6% by 2050 — rents likely to lag national; underwrite the cash flow, not the appreciation.
- At projected returns (-0.2% appreciation + 3.0% rent growth), your $25k cash investment doubles in ~5 years — after that, you're playing with house money.
Negotiation context
- Only 14 days on market — expect competitive offers; lowballing is unlikely to land.
- 2 sale attempts since 23y ago with the ask held roughly flat each time — persistent listings suggest the price (not the market) is what's stuck; bring a comps-based counter.
- Current owner paid $58k; list at $90k implies a 55% gain — meaningful room to come down on a strong offer.
Risks & watch-outs
- Watch-outs: built in 1955 — expect roof / HVAC / electrical / plumbing capex.
Questions for the listing agent
- Built in 1955 — when were the roof, HVAC, electrical panel, plumbing, and water heater last replaced?
- Is there a deadline driving the sale (1031 exchange, divorce, estate, relocation)? That informs how much negotiation room exists.
- Crime grade is F in this area — have there been break-ins, vandalism, or insurance claims at this property in the last 3 years? What carrier currently insures it and at what premium?
- What's the average days-on-market for RENTAL listings here right now (not sales)? A rising rental-DOM trend means longer vacancies and softer asking-rent achievability than the comps imply.
- What's the recent tenant-quality profile in this submarket — average credit score on applications, eviction rate, late-payment / NSF rate, and stable-employment percentage? A property-management company in the area should have these aggregated.
- How much new for-sale + rental construction is in the pipeline within 1–3 miles? Heavy new supply typically softens prices + rents 12–24 months out; constrained supply supports both.
Investment metrics
- 1% rule
- 1.34% ✓
- Cap rate
- 10.95%
- Cash-on-cash
- 16.63%
- DSCR
- 1.74
- GRM
- 6.2
CMA / ARV
- ARV (on-the-fly)
- $95,400
- Comps found
- 12
Show comp detail 12 sales within ~0.75 mi
| Address | Dist | Beds/Ba | Sqft | Sold | Price | $/sf | Match |
|---|---|---|---|---|---|---|---|
| 1368 Winton Ave | 0.29mi | 3/1.0 | 1,038 (-2%) | 7mo | $82,000 | $79 | 77 |
| 1311 Superior Ave | 0.43mi | 3/1.0 | 1,008 (-5%) | 4mo | $50,000 | $50 | 69 |
| 1248 Greenwood Ave | 0.54mi | 3/1.0 | 1,008 (-5%) | 1mo | $69,000 | $68 | 66 |
| 1265 Greenwood Ave | 0.50mi | 3/1.5 | 1,008 (-5%) | 2mo | $165,000 | $164 | 65 |
| 1372 Frederick Blvd | 0.60mi | 3/1.0 | 1,008 (-5%) | 5mo | $75,000 | $74 | 59 |
| 815 Longview Ave | 0.54mi | 3/1.0 | 1,152 (+9%) | 3mo | $53,701 | $47 | 58 |
| 966 La Belle Ave | 0.43mi | 2/1.0 (-1) | 1,170 (+10%) | 5mo | $105,000 | $90 | 54 |
| 1352 Diagonal Rd | 0.43mi | 3/1.0 | 1,200 (+13%) | 5mo | $108,500 | $90 | 54 |
| 1389 Diagonal Rd | 0.36mi | 3/2.0 | 1,200 (+13%) | 9mo | $110,000 | $92 | 50 |
| 1158 Hardesty Blvd | 0.62mi | 3/1.5 | 960 (-9%) | 7mo | $159,900 | $167 | 48 |
| 940 Lakewood Blvd | 0.71mi | 2/1.0 (-1) | 996 (-6%) | 6mo | $96,000 | $96 | 47 |
| 1171 Jason Ave | 0.73mi | 3/1.0 | 922 (-13%) | 2mo | $155,000 | $168 | 42 |
Match score weights: distance 35% · size 25% · config 20% · recency 20%. Top-matched comps best support the ARV.
Projected returns pro-forma
-0.2% appreciation · 3.0% rent growth · sell at horizon
- IRR
- 15.7%
- Equity multiple
- 1.75×
- Total profit
- $18,784
- Equity at exit
- $25,253
- IRR
- 20.4%
- Equity multiple
- 3.22×
- Total profit
- $55,900
- Equity at exit
- $29,661
Cash invested: $25,200 (down + closing). Projections, not guarantees.
Landlord ↔ Tenant lean methodology
- Overall (STATE)
- 73 Landlord-Friendly
- State Ohio
- 73 Landlord-Friendly · R+6
- County
- — inherits STATE
- City
- — inherits STATE
ZIP-level market 44307
- Home prices YoY
- -0.2%
- Active inventory
- 42
- Price-to-rent
- 6.2×
Monthly cashflow live
- Estimated rent
- $1,206 high interval (Pro) →
- Mortgage (P&I)
- −$472
- Tax from tax record
- −$94 /mo · $1,131/yr
- Insurance
- −$38
- HOA
- −$0
- Vacancy / Maint / Mgmt
- −$253
- Net cashflow
- $349
Break-even live
UW: 25.0% down · 7.5% · 30yr · 1.5% tax · 5.0% vac · 8.0% maint · 8.0% mgmt
Financing live
Cash to close
- Down payment
- $22,500
- Closing costs
- $2,700
- Reserves months
- —
- Total cash needed
- —
Loan-product check · same deal, 3 products live
Conventional
25% down · 7.5% · 30yr
- Down + closing
- —
- Monthly P&I
- —
- Monthly cashflow
- —
- DSCR
- —
- Eligible?
- —
Personal DTI + credit; lowest rate.
DSCR
20% down · 8.5% · 30yr
- Down + closing
- —
- Monthly P&I
- —
- Monthly cashflow
- —
- DSCR
- —
- Eligible?
- —
No personal income docs; deal must DSCR.
Hard money
10% down · 12.0% · 12mo
- Down + closing
- —
- Monthly P&I
- —
- Monthly cashflow
- —
- DSCR
- —
- Eligible?
- —
Short-term bridge; refi at stabilization.
Rent comps 40 comps
| Address | Beds | Baths | Sqft | Rent | $/sqft | DOM | Units | Dist |
|---|---|---|---|---|---|---|---|---|
| 1069 Fess Ave Akron, OH | 2.0 | 1.0 | 940 | $1,095 | $1.16 | 44d | 1 | 0.07mi |
| 1032 Andrew St Akron, OH | 3.0 | 1.0 | 960 | $1,097 | $1.14 | 44d | 1 | 0.14mi |
| 1494 Diagonal Rd Akron, OH | 3.0 | 1.0 | 1064 | $1,495 | $1.41 | 44d | 1 | 0.26mi |
| 899 Rosamond Ave Akron, OH | 1.0–2.0 | 1.0 | 690 | $825 | $1.20 | 23d | 1 | 0.41mi |
| 1310 Bellevue Ave Unit Right Akron, OH | 2.0 | 1.0 | 800 | $990 | $1.24 | 44d | 1 | 0.60mi |
| 783 Leonard St Akron, OH | 3.0 | 1.0 | 1040 | $1,250 | $1.20 | 44d | 1 | 0.67mi |
| 1328 Thurston St Unit 1328 Akron, OH | 3.0 | 1.0 | 900 | $925 | $1.03 | 23d | 1 | 0.72mi |
| 1326 Thurston St Unit 1326 Akron, OH | 3.0 | 1.0 | 900 | $925 | $1.03 | 23d | 1 | 0.73mi |
| 1092 Peerless Ave Akron, OH | 3.0 | 1.0 | 998 | $1,200 | $1.20 | 44d | 1 | 0.75mi |
| 991 Diana Ave Akron, OH | 3.0 | 2.0 | 1264 | $1,325 | $1.05 | 44d | 1 | 0.76mi |
| 1331 Thurston St Unit 1326 Akron, OH | 3.0 | 1.0 | 900 | $925 | $1.03 | 44d | 1 | 0.76mi |
| 1339 Thurston St Unit 1339 Akron, OH | 2.0 | 1.0 | 700 | $825 | $1.18 | 44d | 1 | 0.76mi |
| 1335 Thurston St Unit 1335 Akron, OH | 2.0 | 1.0 | 700 | $825 | $1.18 | 14d | 1 | 0.77mi |
| 960 Jason Ave Akron, OH | 3.0 | 1.5 | 935 | $1,095 | $1.17 | 21d | 1 | 0.78mi |
| 685 Longview Ave Akron, OH | 3.0 | 1.0 | 1100 | $1,150 | $1.05 | 44d | 1 | 0.79mi |
| 1040 Mercer Ave Akron, OH | 3.0 | 1.0 | 850 | $1,400 | $1.65 | 21d | 1 | 0.83mi |
| 1313 Manchester Rd Akron, OH | 3.0 | 1.0 | 1221 | $1,200 | $0.98 | 21d | 1 | 0.84mi |
| 1090 Hartford Ave Akron, OH | 4.0 | 1.0 | 1328 | $1,125 | $0.85 | 44d | 1 | 0.85mi |
| 847 Jason Ave Unit 1 Akron, OH | 2.0 | 1.0 | 798 | $825 | $1.03 | 23d | 1 | 0.85mi |
| 1161 La Croix Ave Akron, OH | 3.0 | 1.0 | 1452 | $1,200 | $0.83 | 23d | 1 | 0.89mi |
| 1171 La Croix Ave Unit 2 Akron, OH | 2.0 | 1.0 | 1267 | $975 | $0.77 | 44d | 1 | 0.89mi |
| 781 Saxon Ave Akron, OH | 2.0 | 1.0 | 800 | $900 | $1.12 | 44d | 1 | 0.90mi |
| 760 Lakewood Blvd Akron, OH | 3.0 | 2.0 | 1398 | $1,150 | $0.82 | 23d | 1 | 0.91mi |
| 1161 Seward Ave Akron, OH | 3.0 | 1.5 | 1000 | $1,200 | $1.20 | 14d | 1 | 0.92mi |
| 1128 Cordova Ave Akron, OH | 2.0 | 1.0 | 840 | $795 | $0.95 | 14d | 1 | 1.06mi |
| 730 Noble Ave Akron, OH | 3.0 | 1.0 | 1092 | $1,200 | $1.10 | 23d | 1 | 1.06mi |
| 875 Harrison Ave Akron, OH | 3.0 | 1.0 | 1157 | $1,150 | $0.99 | 14d | 1 | 1.15mi |
| 961 Lawton St Akron, OH | 3.0 | 1.0 | 1144 | $1,450 | $1.27 | 14d | 1 | 1.16mi |
| 1889 Vernon Odom Blvd Akron, OH | 1.0–2.0 | 1.0–2.0 | 800 | $1,310 | $1.64 | 14d | 1 | 1.17mi |
| 844 Lawton St Akron, OH | 4.0 | 2.0 | 1240 | $1,175 | $0.95 | 44d | 1 | 1.25mi |
| 527 Brady Ave Akron, OH | 3.0 | 1.5 | 1416 | $1,395 | $0.99 | 44d | 1 | 1.26mi |
| 575 Noble Ave Akron, OH | 3.0 | 1.0 | 1300 | $1,350 | $1.04 | 14d | 1 | 1.33mi |
| 1047 Yukon Ave Akron, OH | 3.0 | 1.0 | 966 | $995 | $1.03 | 21d | 1 | 1.34mi |
| 2139 18th St SW Akron, OH | 2.0 | 1.0 | 992 | $1,100 | $1.11 | 44d | 1 | 1.36mi |
| 2138 East Ave Akron, OH | 3.0 | 1.0 | 990 | $1,100 | $1.11 | 23d | 1 | 1.36mi |
| 721 Polk Ave Akron, OH | 3.0 | 1.5 | 1500 | $1,600 | $1.07 | 23d | 1 | 1.37mi |
| 773 Montana Ave Akron, OH | 3.0 | 1.5 | 1128 | $1,195 | $1.06 | 23d | 1 | 1.39mi |
| 384 W Bartges St Akron, OH | 2.0 | 1.0 | 1024 | $1,100 | $1.07 | 44d | 1 | 1.40mi |
| 1029 Harpster Ave Akron, OH | 4.0 | 1.0 | 1403 | $1,250 | $0.89 | 14d | 1 | 1.42mi |
| 1304 Kellogg Ave Akron, OH | 2.0 | 2.0 | 1148 | $2,000 | $1.74 | 14d | 1 | 1.45mi |
Listing history 12 events
-
2026-06-18days on market $90,000 Active 14 DOM
-
2026-06-17days on market $90,000 Active 13 DOM
-
2026-06-16days on market $90,000 Active 12 DOM
-
2026-06-15days on market $90,000 Active 11 DOM
-
2026-06-14days on market $90,000 Active 9 DOM
-
2026-06-13days on market $90,000 Active 8 DOM
-
2026-06-10days on market $90,000 Active 6 DOM
-
2026-06-09days on market $90,000 Active 5 DOM
-
2026-06-08days on market $90,000 Active 4 DOM
-
2026-06-07days on market $90,000 Active 3 DOM
-
2026-06-05remarks 154-char remark
-
2026-06-05$90,000 Active 1 DOM
ⓘ Source: listings_history table (triggers on properties + properties_extension) + one-shot
backfill from property_details.listing_events for pre-trigger history.
Tax reassessment forecast OH · Partial reset (capped growth)
- Current annual tax
- $1,131 · $94/mo
- Projected year-2 tax
- $1,268 · $106/mo
- Expected delta
- +$136/yr (+$11/mo · 12.1%)
ⓘ Screening estimate from a state-policy table — verify with the county assessor before closing.
Climate risk First Street
- Flood 1/10 Low FEMA zone X (unshaded) · 0% chance over 30 yrs
- Wildfire 1/10 Low
- Heat 3/10 Moderate 7 d/yr ≥97°F today · 17 d/yr by 30 yrs out
- Wind 1/10 Low
- Air quality 2/10 Low 1 unhealthy d/yr today · 2 by 30 yrs out
Nearby sold comps map
Loading sold comps map…
Walkable amenities ~0.75 mi
Loading nearby amenities…
Taxation est. · year 1
- Rental income
- $14,474
- − Mortgage interest
- −$5,041
- − Property taxes
- −$1,131
- − Insurance
- −$450
- − Repairs & maintenance
- −$1,158
- − Management
- −$1,158
- − Depreciation
- −$2,618
- Taxable income
- $2,917
- Est. tax owed @ 24.0%
- −$700
- After-tax cash flow
- $3,490/yr
For passive investors: Depreciation is non-cash, so a rental often shows a tax loss while cash-flowing — sheltering income. Rental losses are passive: they offset passive income freely, and up to $25,000/yr can offset ordinary (W-2) income if you actively participate and your MAGI is under $100k (phasing out to $0 by $150k); unused losses carry forward. On sale, claimed depreciation is recaptured at up to 25%, and gains may owe capital-gains tax (a 1031 exchange can defer both). Figures are a year-1 estimate at your 24.0% rate — not tax advice; consult a CPA.
Schools (NCES district)
- District
- Akron City
- NCES district ID
- 3904348
- Math proficiency
- 22% ▼ -17.00%
- Reading proficiency
- 30% ▼ -12.00%
- Median HH income
- $33,811
- Composite
- 21.31/100
- National rank
- #8383
- State rank
- #602 of 656 in OH
Livability — Akron
- Score
- 81/100
- State rank
- #104
- US rank
- #1591
Category grades
Schools grade is shown separately in the Schools card above.
Census & demographics
- Census place
- Akron, OH
- County
- Summit County · 440,783 people
- City population
- 174,375
- Metro
- Akron, OH
- Population (ZIP)
- 6,653
- Household income
- $27,697
- Rent vs Own
- Severe rent burden
- 787.0
Population outlook (Summit County) Hauer SSP2
- Today (2025)
- 546,583 people
- By 2030
- 544,028 · -0.5%
- By 2040
- 531,363 · -2.8%
- By 2050
- 514,923 · -5.8%
- By 2075
- 481,765 · -11.9%
- By 2100
- 432,265 · -20.9%
Race, ethnicity, and origin ACS 2023
- Neighborhood character
- Predominantly Black (73%)
- Race & ethnicity
- Black 73% White 17% Two or more races 5% Hispanic / Latino 5%
- Common ancestry
- Slovak 1% Romanian 1% Iranian 1%
- Foreign-born
- 2% · Canada
- Languages at home
- 98% English-only · Spanish 2% French/Haitian/Cajun 1%
Political lean MEDSL · Summit
- 2024 margin
- Lean D (+7.0) · D 53.0% · R 46.0%
- 2008→2024 swing
- -9.6pp toward R · 2008: 16.6pp · 2024: 7.0pp
- All cycles
- 2024: D+7.0 2020: D+9.6 2016: D+8.2 2012: D+14.8 2008: D+16.6
Not yet ingested
- Civics
- —
Market trends
- HPI YoY
- ▼ -0.20%
- Current HPI
- 81.3728
- Rent YoY
- —
- Metro
- Akron, OH
- State GDP YoY
- ▲ 1.98%
- F500 in state
- 48
Industry mix (Fortune 500 HQ in OH)
| Industry | F500 HQs | Revenue |
|---|---|---|
| Insurance | 3 | $145B |
|
||
| Industrial Machinery | 3 | $49B |
|
||
| Financial Services | 3 | $24B |
|
||
| Consumer Goods | 2 | $93B |
|
||
| Aerospace / Defense | 2 | $47B |
|
||
| Utilities | 2 | $33B |
|
||
Price history
+50.3% since first listed4 events — show timeline
- 2026-06-04 Listed $90,000 MLSNOW
- 2004-02-25 Sold (Public Records) $58,000 Public Records
- 2004-02-25 Sold (MLS) $58,000 MLSNOW
- 2003-10-05 Listed $59,900 MLSNOW
Property tax history
-0.0%/yrLatest (2025): $1,131 · -1.8% YoY. Source: county tax records.
Cash-flow waterfall
monthlySold comps — $/sqft
last 12 mo · ≤1 miLoading sold comps…