2922 N Ionia Rd · Vermontville, MI
Flood risk 1/10 · Minimal
- FEMA flood zone
- X (unshaded)
- Chance of flooding over 30 yrs
- 0.0%
- Est. flood insurance / yr
- $473 – $860
Fire risk 1/10 · Minimal
- Est. fire insurance / yr
- $784 – $1,456
Heat risk 2/10 · Minimal
- Hot days now (above 97°F)
- 7 days/yr
- Hot days in 30 yrs
- 16 days/yr
Wind risk 2/10 · Minimal
- Chance of severe wind over 30 yrs
- —
Air-quality risk 2/10 · Minimal
- Unhealthy air days now
- 1 days/yr
- Unhealthy air days in 30 yrs
- 2 days/yr
Risk factors via First Street. Map © Google.
Why this score? — see what drove the C- grade
The composite is a weighted blend of 9 inputs, each scored 0–100. Each bar is that input's sub-score; the figure is the points it added to the 100-point composite (weight × sub-score).
- Cash flow +23.3/30.0
- DSCR +7.5/10.0
- 1% rule +5.0/10.0
- ARV discount +4.7/15.0
- Livability +3.2/5.0
- Schools +2.7/10.0
- Rent growth +2.5/5.0
- Condition / age +2.5/5.0
- Appreciation +0.0/10.0
$99,200
🖨 Deal sheet 📄 Offer letter ✓ Due diligence
Listing remarks MLS
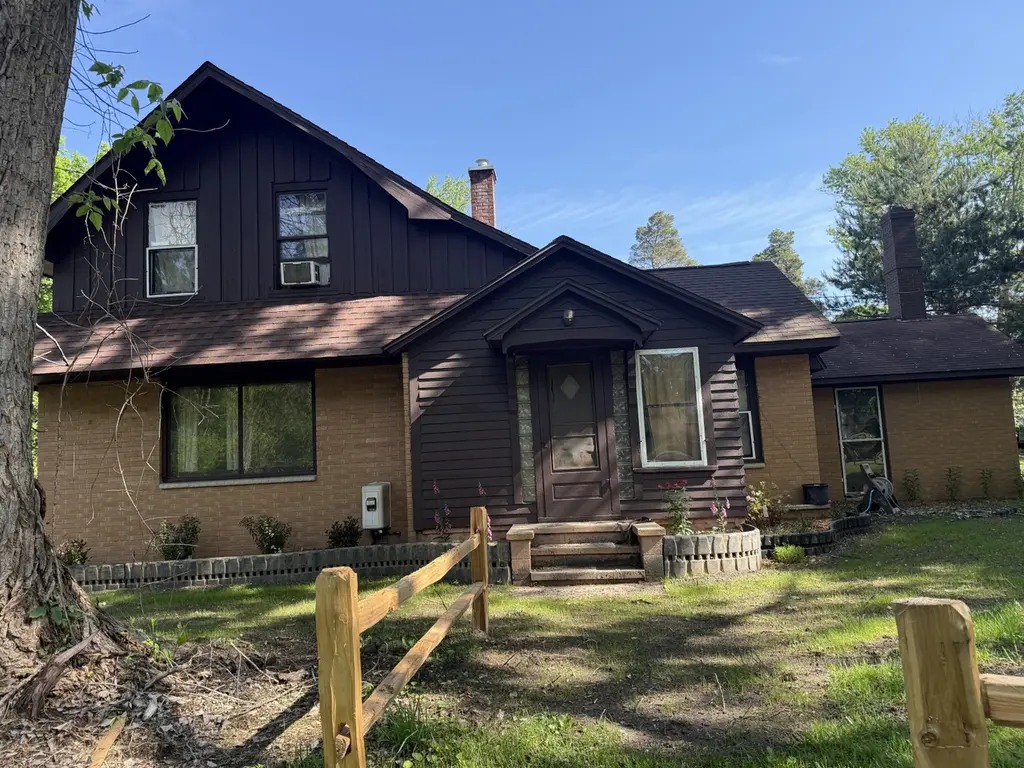
Great brink home, little over an acre, new pond. Home needs lots of work. Huge barn, new landscaping.
Key facts
- 1.85 acre lot
- Built 1900
Property features AI
Exterior
- Utilities: Well water; Natural gas connected
- Home design: Cape Cod style; Single-family residence
- Construction: Built in 1900; Brick and wood siding construction; Shingle roof
- Exterior features: Corner lot; Pond on the property; Barn(s) on the property; Paved road access
Interior
- Kitchen: Refrigerator; Kitchen (12 x 11)
- Bedrooms: Primary bedroom (10 x 12)
- Bathrooms: 1 full bathroom; Second bathroom (11 x 14)
- Heating & cooling: Forced air heating
- Interior features: 7 total rooms; Fireplace; Michigan-style basement
- Laundry & utility: Dedicated laundry room (7 x 18)
Neighborhood map
What this means for you Summary
Snapshot
- This is a 2-bed/1.0-bath single-family listed at $99k.
Deal economics
- At list price, monthly cash flow is $182 ($2k/yr) — positive.
- The deal already cash-flows at list — no discount required.
- Meets the 1% rule at list price ($994 rent vs $99k).
Location & tenants
- Location reads 63/100 on livability (#513 in MI) — a middle-class / working-renter tenant base. Strengths: cost of living A+, housing A+; Watch: employment D, schools D-, crime F.
- Maple Valley Schools (rural): math 27% / reading 36% proficiency, ranked #332 of 540 in MI (top 62%) — families likely to look elsewhere, expect single-tenant / working-renter base with shorter leases.
- Market conditions: 13 active listings in the ZIP; 98 units permitted in Eaton County in 2024 (0 in 5+ unit buildings).
Forward outlook
- Local home prices are declining (-3.0%/yr); year-one equity from $686 of loan paydown is wiped out by about $3k of value loss. Plan a longer hold.
- Eaton County population projected to shrink 5% by 2050 — rents likely to lag national; underwrite the cash flow, not the appreciation.
Negotiation context
- Only 1 days on market — expect competitive offers; lowballing is unlikely to land.
- 4 sale attempts since 29y ago with the ask held roughly flat each time — persistent listings suggest the price (not the market) is what's stuck; bring a comps-based counter.
- Current owner paid $55k; list at $99k implies a 80% gain — meaningful room to come down on a strong offer.
Risks & watch-outs
- Watch-outs: built in 1900 — expect roof / HVAC / electrical / plumbing capex.
Questions for the listing agent
- Built in 1900 — when were the roof, HVAC, electrical panel, plumbing, and water heater last replaced?
- Is there a deadline driving the sale (1031 exchange, divorce, estate, relocation)? That informs how much negotiation room exists.
- Schools are D-rated, which usually means shorter tenancies and higher turnover. Who's the typical renter profile here, and what's been the actual vacancy rate?
- Crime grade is F in this area — have there been break-ins, vandalism, or insurance claims at this property in the last 3 years? What carrier currently insures it and at what premium?
- What's the average days-on-market for RENTAL listings here right now (not sales)? A rising rental-DOM trend means longer vacancies and softer asking-rent achievability than the comps imply.
- What's the recent tenant-quality profile in this submarket — average credit score on applications, eviction rate, late-payment / NSF rate, and stable-employment percentage? A property-management company in the area should have these aggregated.
- How much new for-sale + rental construction is in the pipeline within 1–3 miles? Heavy new supply typically softens prices + rents 12–24 months out; constrained supply supports both.
Investment metrics
- 1% rule
- 1.00% ✓
- Cap rate
- 8.49%
- Cash-on-cash
- 7.85%
- DSCR
- 1.35
- GRM
- 8.3
CMA / ARV
- ARV (on-the-fly)
- $93,310
- Comps found
- 1
Show comp detail 1 sale within ~0.75 mi
| Address | Dist | Beds/Ba | Sqft | Sold | Price | $/sf | Match |
|---|---|---|---|---|---|---|---|
| 2922 N Ionia Rd | 0.00mi | 2/1.0 | 1,505 (0%) | 0mo | $92,800 | $62 | 100 |
Match score weights: distance 35% · size 25% · config 20% · recency 20%. Top-matched comps best support the ARV.
Projected returns pro-forma
-3.0% appreciation · 3.0% rent growth · sell at horizon
- IRR
- -4.4%
- Equity multiple
- 0.84×
- Total profit
- $-4,540
- Equity at exit
- $14,791
- IRR
- 5.3%
- Equity multiple
- 1.39×
- Total profit
- $10,802
- Equity at exit
- $8,577
Cash invested: $27,776 (down + closing). Projections, not guarantees.
Landlord ↔ Tenant lean methodology
- Overall (STATE)
- 62 Landlord-Friendly
- State Michigan
- 62 Landlord-Friendly · EVEN
- County
- — inherits STATE
- City
- — inherits STATE
ZIP-level market 49096
- Home prices YoY
- -18.5%
- Active inventory
- 13
- Price-to-rent
- 8.3×
Monthly cashflow live
- Estimated rent
- $994 medium interval (Pro) →
- Mortgage (P&I)
- −$520
- Tax from tax record
- −$42 /mo · $503/yr
- Insurance
- −$41
- HOA
- −$0
- Vacancy / Maint / Mgmt
- −$209
- Net cashflow
- $182
Break-even live
UW: 25.0% down · 7.5% · 30yr · 1.5% tax · 5.0% vac · 8.0% maint · 8.0% mgmt
Financing live
Cash to close
- Down payment
- $24,800
- Closing costs
- $2,976
- Reserves months
- —
- Total cash needed
- —
Loan-product check · same deal, 3 products live
Conventional
25% down · 7.5% · 30yr
- Down + closing
- —
- Monthly P&I
- —
- Monthly cashflow
- —
- DSCR
- —
- Eligible?
- —
Personal DTI + credit; lowest rate.
DSCR
20% down · 8.5% · 30yr
- Down + closing
- —
- Monthly P&I
- —
- Monthly cashflow
- —
- DSCR
- —
- Eligible?
- —
No personal income docs; deal must DSCR.
Hard money
10% down · 12.0% · 12mo
- Down + closing
- —
- Monthly P&I
- —
- Monthly cashflow
- —
- DSCR
- —
- Eligible?
- —
Short-term bridge; refi at stabilization.
Listing history 2 events
-
2026-06-07remarks 101-char remark
-
2026-06-07$99,200 Pending 1 DOM
ⓘ Source: listings_history table (triggers on properties + properties_extension) + one-shot
backfill from property_details.listing_events for pre-trigger history.
Tax reassessment forecast MI · Partial reset (capped growth)
- Current annual tax
- $503 · $42/mo
- Projected year-2 tax
- $1,016 · $85/mo
- Expected delta
- +$512/yr (+$43/mo · 101.7%)
ⓘ Screening estimate from a state-policy table — verify with the county assessor before closing.
Climate risk First Street
- Flood 1/10 Low FEMA zone X (unshaded) · 0% chance over 30 yrs
- Wildfire 1/10 Low
- Heat 2/10 Low 7 d/yr ≥97°F today · 16 d/yr by 30 yrs out
- Wind 2/10 Low
- Air quality 2/10 Low 1 unhealthy d/yr today · 2 by 30 yrs out
Nearby sold comps map
Loading sold comps map…
Walkable amenities ~0.75 mi
Loading nearby amenities…
Taxation est. · year 1
- Rental income
- $11,927
- − Mortgage interest
- −$5,557
- − Property taxes
- −$503
- − Insurance
- −$496
- − Repairs & maintenance
- −$954
- − Management
- −$954
- − Depreciation
- −$2,886
- Taxable income
- $576
- Est. tax owed @ 24.0%
- −$138
- After-tax cash flow
- $2,042/yr
For passive investors: Depreciation is non-cash, so a rental often shows a tax loss while cash-flowing — sheltering income. Rental losses are passive: they offset passive income freely, and up to $25,000/yr can offset ordinary (W-2) income if you actively participate and your MAGI is under $100k (phasing out to $0 by $150k); unused losses carry forward. On sale, claimed depreciation is recaptured at up to 25%, and gains may owe capital-gains tax (a 1031 exchange can defer both). Figures are a year-1 estimate at your 24.0% rate — not tax advice; consult a CPA.
Schools (NCES district)
- District
- Maple Valley Schools
- NCES district ID
- 2622620
- Math proficiency
- 27% ▼ -8.00%
- Reading proficiency
- 36% ▼ -9.00%
- Median HH income
- $49,074
- Composite
- 27.33/100
- National rank
- #6987
- State rank
- #332 of 540 in MI
Livability — Vermontville
- Score
- 63/100
- State rank
- #513
- US rank
- #15340
Category grades
Schools grade is shown separately in the Schools card above.
Census & demographics
- Population (ZIP)
- 3,196
Population outlook (Eaton County) Hauer SSP2
- Today (2025)
- 110,811 people
- By 2030
- 110,598 · -0.2%
- By 2040
- 108,304 · -2.3%
- By 2050
- 104,961 · -5.3%
- By 2075
- 97,197 · -12.3%
- By 2100
- 85,150 · -23.2%
Race, ethnicity, and origin ACS 2023
- Neighborhood character
- Predominantly White (91%)
- Race & ethnicity
- White 91% Hispanic / Latino 4% Two or more races 4%
- Common ancestry
- Polish 5% Iranian 3% Slovak 2%
- Foreign-born
- 1% · Canada
- Languages at home
- 90% English-only · German/W. Germanic 8% Spanish 1%
Political lean MEDSL · Eaton
- 2024 margin
- Toss-up / Even · D 47.6% · R 50.8% · Other 1.6%
- 2008→2024 swing
- -11.6pp toward R · 2008: 8.4pp · 2024: -3.1pp
- All cycles
- 2024: R+3.1 2020: R+0.8 2016: R+5.5 2012: D+3.1 2008: D+8.4
Not yet ingested
- Civics
- —
Market trends
- HPI YoY
- ▼ -49.70%
- Current HPI
- 219.3993
- Rent YoY
- —
- Metro
- —
- State GDP YoY
- ▲ 1.37%
- F500 in state
- 28
Industry mix (Fortune 500 HQ in MI)
| Industry | F500 HQs | Revenue |
|---|---|---|
| Automotive Parts | 3 | $48B |
|
||
| Automotive | 2 | $372B |
|
||
| Chemicals | 1 | $45B |
|
||
| Automotive Retail | 1 | $29B |
|
||
| Healthcare / Medical Devices | 1 | $23B |
|
||
| Automotive Technology | 1 | $20B |
|
||
Price history
+80.4% since first listed9 events — show timeline
- 2026-06-04 Pending — SW Michigan MLS
- 2026-06-04 Listed $99,200 REALCOMP
- 2026-06-04 Listing Removed — REALCOMP
- 2026-06-04 Listed $99,200 MiRealSource-MiMLS
- 2026-06-04 Listing Removed — MiRealSource-MiMLS
- 2026-06-04 Listed $99,200 SW Michigan MLS
- 1997-07-30 Listing Removed — REALCOMP
- 1997-01-23 Listed $62,000 REALCOMP
- 1993-08-17 Sold (Public Records) $55,000 Public Records
Property tax history
-19.4%/yrLatest (2023): $503 · -57.8% YoY. Source: county tax records.
Cash-flow waterfall
monthlySold comps — $/sqft
last 12 mo · ≤1 miLoading sold comps…