1102 15th St · Bridgeport, TX
Flood risk 1/10 · Minimal
- FEMA flood zone
- X (unshaded)
- Chance of flooding over 30 yrs
- 0.0%
- Est. flood insurance / yr
- $507 – $1,088
Fire risk 5/10 · Moderate
- Est. fire insurance / yr
- $1,222 – $2,270
Heat risk 7/10 · Major
- Hot days now (above 111°F)
- 7 days/yr
- Hot days in 30 yrs
- 21 days/yr
Wind risk 4/10 · Minor
- Chance of severe wind over 30 yrs
- 15.0%
Air-quality risk 2/10 · Minimal
- Unhealthy air days now
- 1 days/yr
- Unhealthy air days in 30 yrs
- 2 days/yr
Risk factors via First Street. Map © Google.
Why this score? — see what drove the B- grade
The composite is a weighted blend of 9 inputs, each scored 0–100. Each bar is that input's sub-score; the figure is the points it added to the 100-point composite (weight × sub-score).
- Cash flow +28.1/30.0
- DSCR +10.0/10.0
- ARV discount +7.5/15.0
- 1% rule +7.2/10.0
- Appreciation +4.6/10.0
- Schools +3.6/10.0
- Livability +3.4/5.0
- Rent growth +2.5/5.0
- Condition / age +2.5/5.0
$125,000
🖨 Deal sheet 📄 Offer letter ✓ Due diligence
Listing remarks
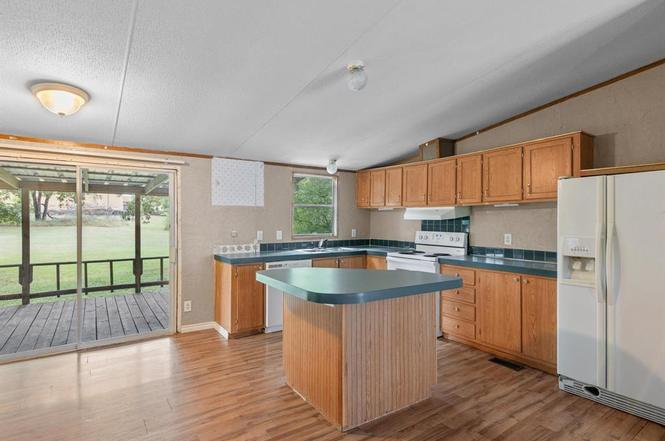
* * * * SPECIAL PILOT LOAN PROGRAM AVAILABLE for manufactured homes that have been moved * * * Buyer must have 640 credit score or better and a minimum of 5% downpayment. Please call listing agent for lenders information! HIGH SPEED INTERNET! Nextlink has ran a line to home, easy to connect and start streaming immediately! This three-bedroom, two-bath home is perfect for a primary home or investment property. Sliding glass door opens to a covered patio, perfect for porch sitting! Inside, you'll find an open floorplan that keeps things flowing nicely from one room to the next. It’s easy to imagine cooking dinner while chatting with guests or watching the game from the kitchen.
Key facts
- Harwood park
- Open floorplan
- Well maintained
Tags
Property features AI
Finance
- Other: GPS friendly; sign in front yard; County: Wise; Country: United States
- Financial info: Listing terms include cash; contact agent for details; Transaction type: For Sale; Listing status: Active Contingent
- HOA & community: No association
Exterior
- Parking: Driveway parking
- Utilities: City water; City sewer; Electricity connected; Not in a municipal utility district
- Home design: Mobile home (attached); One story; Composition roof; Built in 1999; Subdivision: Ellington Add
- Construction: Composition roof; Year built 1999
- Exterior features: Covered patio/porch; Cleared yard; Interior lot
Interior
- Kitchen: Dishwasher; Built-in cabinets; Kitchen island
- Bedrooms: 3 bedrooms (all on the main level)
- Bathrooms: 2 full bathrooms
- Heating & cooling: Electric heating; Electric cooling
- Interior features: Open floorplan; Eat-in kitchen; Kitchen island; Decorative lighting; Cable TV available
- Laundry & utility: Full-size washer/dryer area
Neighborhood map
What this means for you Summary
Snapshot
- This is a 3-bed/2.0-bath manufactured listed at $125k.
Deal economics
- At list price, monthly cash flow is $392 ($5k/yr) — positive.
- The deal already cash-flows at list — no discount required.
- Meets the 1% rule at list price ($2k rent vs $125k).
- Recommended offer: $110k (12.0% below list) — sets the bar for market timing.
- Cap rate 10.1% vs local median 3.3% in Bridgeport — top-decile yield for the area; either an underpriced asset or a hidden risk that comps aren't pricing in. Stress-test before assuming the spread holds.
Location & tenants
- Location reads 68/100 on livability (#472 in TX) — a middle-class / working-renter tenant base. Strengths: cost of living A+, housing A+, crime B+; Watch: health & safety D+, amenities F, commute F.
- Bridgeport ISD (rural): math 41% / reading 41% proficiency, ranked #356 of 826 in TX (top 43%) — families likely to look elsewhere, expect single-tenant / working-renter base with shorter leases.
- Zoned schools: Bridgeport El (523 students, 70% FRL) — zoned schools average 70% FRL vs 50% district-wide (20 pts higher); higher-poverty schools than district average — tighter screening recommended.
- Market conditions: 338 active listings in the ZIP; 6 comparable units currently listed for rent nearby; rentals leasing fast (median 1d on market — plan ~1-2 weeks tenant-placement turnaround); solid renter incomes; 460 units permitted in Wise County in 2024 (243 in 5+ unit buildings).
Forward outlook
- Local home prices are declining (-0.8%/yr); year-one equity from $864 of loan paydown is wiped out by about $1k of value loss. Plan a longer hold.
- Wise County population projected at +27% by 2050 — long-run rental-demand tailwind backs the buy-and-hold thesis.
- At projected returns (-0.8% appreciation + 3.0% rent growth), your $35k cash investment doubles in ~7 years — after that, you're playing with house money.
Negotiation context
- It's been on market 281 days — a 12% lower offer ($110k) is reasonable based on typical stale-listing flexibility.
Risks & watch-outs
- Climate carrying-cost: moderate wildfire risk; extreme-heat days projected 7→21/yr by 2055 (HVAC capex compounding) — expect insurance premiums to compound above CPI over the hold.
Questions for the listing agent
- It's been on market 281 days. Have you received any prior offers? Is the seller open to a 12% concession, seller financing, or rate buy-down credit?
- Why hasn't it sold? Are there any deal-killer items the seller is aware of (foundation, flood, title, zoning, code violations)?
- Is there a deadline driving the sale (1031 exchange, divorce, estate, relocation)? That informs how much negotiation room exists.
- Schools are F-rated, which usually means shorter tenancies and higher turnover. Who's the typical renter profile here, and what's been the actual vacancy rate?
- What's the average days-on-market for RENTAL listings here right now (not sales)? A rising rental-DOM trend means longer vacancies and softer asking-rent achievability than the comps imply.
- What's the recent tenant-quality profile in this submarket — average credit score on applications, eviction rate, late-payment / NSF rate, and stable-employment percentage? A property-management company in the area should have these aggregated.
- How much new for-sale + rental construction is in the pipeline within 1–3 miles? Heavy new supply typically softens prices + rents 12–24 months out; constrained supply supports both.
Investment metrics
- 1% rule
- 1.22% ✓
- Cap rate
- 10.06%
- Cash-on-cash
- 13.45%
- DSCR
- 1.60
- GRM
- 6.8
CMA / ARV
No comps found within radius.
Projected returns pro-forma
-0.82% appreciation · 3.0% rent growth · sell at horizon
- IRR
- 10.4%
- Equity multiple
- 1.47×
- Total profit
- $16,583
- Equity at exit
- $31,255
- IRR
- 16.3%
- Equity multiple
- 2.65×
- Total profit
- $57,822
- Equity at exit
- $33,750
Cash invested: $35,000 (down + closing). Projections, not guarantees.
Landlord ↔ Tenant lean methodology
- Overall (STATE)
- 87 Strongly Landlord-Friendly
- State Texas
- 87 Strongly Landlord-Friendly · R+5
- County
- — inherits STATE
- City
- — inherits STATE
ZIP-level market 76426
- Home prices YoY
- -0.2%
- Active inventory
- 338
- Price-to-rent
- 6.8×
Monthly cashflow live
- Estimated rent
- $1,528 high interval (Pro) →
- Mortgage (P&I)
- −$656
- Tax from tax record
- −$107 /mo · $1,287/yr
- Insurance
- −$52
- HOA
- −$0
- Vacancy / Maint / Mgmt
- −$321
- Net cashflow
- $392
Break-even live
UW: 25.0% down · 7.5% · 30yr · 1.5% tax · 5.0% vac · 8.0% maint · 8.0% mgmt
Financing live
Cash to close
- Down payment
- $31,250
- Closing costs
- $3,750
- Reserves months
- —
- Total cash needed
- —
Loan-product check · same deal, 3 products live
Conventional
25% down · 7.5% · 30yr
- Down + closing
- —
- Monthly P&I
- —
- Monthly cashflow
- —
- DSCR
- —
- Eligible?
- —
Personal DTI + credit; lowest rate.
DSCR
20% down · 8.5% · 30yr
- Down + closing
- —
- Monthly P&I
- —
- Monthly cashflow
- —
- DSCR
- —
- Eligible?
- —
No personal income docs; deal must DSCR.
Hard money
10% down · 12.0% · 12mo
- Down + closing
- —
- Monthly P&I
- —
- Monthly cashflow
- —
- DSCR
- —
- Eligible?
- —
Short-term bridge; refi at stabilization.
Rent comps 6 comps
| Address | Beds | Baths | Sqft | Rent | $/sqft | DOM | Units | Dist |
|---|---|---|---|---|---|---|---|---|
| 1304 Halsell St Unit 111 Bridgeport, TX | 2.0 | 2.0 | 870 | $1,195 | $1.37 | 1d | 1 | 0.18mi |
| 1008 Halsell St Unit 200 Bridgeport, TX | 2.0 | 1.0 | 850 | $1,425 | $1.68 | 3d | 1 | 0.37mi |
| 1008 Halsell St Unit 200 Bridgeport, TX | 2.0 | 1.0 | 850 | $1,425 | $1.68 | 1d | 1 | 0.37mi |
| 1305 Edison St Unit B Bridgeport, TX | 3.0 | 2.0 | 1260 | $1,695 | $1.35 | 1d | 1 | 0.66mi |
| 314 Cobb St Bridgeport, TX | 3.0 | 2.0 | 1490 | $1,800 | $1.21 | 4d | 1 | 0.77mi |
| 401 Turkey Creek Trl Bridgeport, TX | 2.0 | 1.0 | 770 | $1,150 | $1.49 | 1d | 1 | 0.82mi |
Listing history 8 events
-
2026-05-12status Pending
-
2026-03-31historical Active Option Contract
-
2025-12-08price $125,000
-
2025-10-30price $135,000
-
2025-10-06price $140,000
-
2025-09-15price $145,000
-
2025-08-04$150,000 Active
-
2003-07-09soldstatus
ⓘ Source: listings_history table (triggers on properties + properties_extension) + one-shot
backfill from property_details.listing_events for pre-trigger history.
Tax reassessment forecast TX · Resets to sale price
- Current annual tax
- $1,287 · $107/mo
- Projected year-2 tax
- $2,288 · $191/mo
- Expected delta
- +$1,001/yr (+$83/mo · 77.8%)
ⓘ Screening estimate from a state-policy table — verify with the county assessor before closing.
Climate risk First Street
- Flood 1/10 Low FEMA zone X (unshaded) · 0% chance over 30 yrs
- Wildfire 5/10 Major
- Heat 7/10 Severe 7 d/yr ≥111°F today · 21 d/yr by 30 yrs out
- Wind 4/10 Moderate 15% chance of damaging wind over 30 yrs
- Air quality 2/10 Low 1 unhealthy d/yr today · 2 by 30 yrs out
Nearby sold comps map
Loading sold comps map…
Walkable amenities ~0.75 mi
Loading nearby amenities…
Taxation est. · year 1
- Rental income
- $18,336
- − Mortgage interest
- −$7,002
- − Property taxes
- −$1,287
- − Insurance
- −$625
- − Repairs & maintenance
- −$1,467
- − Management
- −$1,467
- − Depreciation
- −$3,636
- Taxable income
- $2,852
- Est. tax owed @ 24.0%
- −$685
- After-tax cash flow
- $4,023/yr
For passive investors: Depreciation is non-cash, so a rental often shows a tax loss while cash-flowing — sheltering income. Rental losses are passive: they offset passive income freely, and up to $25,000/yr can offset ordinary (W-2) income if you actively participate and your MAGI is under $100k (phasing out to $0 by $150k); unused losses carry forward. On sale, claimed depreciation is recaptured at up to 25%, and gains may owe capital-gains tax (a 1031 exchange can defer both). Figures are a year-1 estimate at your 24.0% rate — not tax advice; consult a CPA.
Schools (NCES district)
- District
- Bridgeport ISD
- NCES district ID
- 4811340
- Math proficiency
- 41% ▼ -4.00%
- Reading proficiency
- 41% ▲ 3.00%
- Median HH income
- $51,866
- Composite
- 35.51/100
- National rank
- #4913
- State rank
- #356 of 826 in TX
Livability — Bridgeport
- Score
- 68/100
- State rank
- #472
- US rank
- #9507
Category grades
Schools grade is shown separately in the Schools card above.
Census & demographics
- Census place
- Bridgeport, TX
- County
- Wise County · 49,037 people
- Metro
- Dallas-Fort Worth-Arlington, TX
- Population (ZIP)
- 11,632
- Household income
- $92,130
- Rent vs Own
- Severe rent burden
- 74.0
Population outlook (Wise County) Hauer SSP2
- Today (2025)
- 71,620 people
- By 2030
- 75,858 · +5.9%
- By 2040
- 83,908 · +17.2%
- By 2050
- 90,717 · +26.7%
- By 2075
- 107,583 · +50.2%
- By 2100
- 114,996 · +60.6%
Race, ethnicity, and origin ACS 2023
- Neighborhood character
- Majority White (60%)
- Race & ethnicity
- White 60% Hispanic / Latino 32% Two or more races 9% Black 2% Asian 1% Native American 1%
- Hispanic origin (detail)
- Mexican 31%
- Common ancestry
- Slovak 1% Lithuanian 1% Romanian 1%
- Foreign-born
- 14% · Canada, Vietnam
- Languages at home
- 72% English-only · Spanish 27%
Political lean MEDSL · Wise
- 2024 margin
- Solid R (+70.0) · D 14.7% · R 84.7%
- 2008→2024 swing
- -14.3pp toward R · 2008: -55.7pp · 2024: -70.0pp
- All cycles
- 2024: R+70.0 2020: R+68.2 2016: R+69.9 2012: R+67.5 2008: R+55.7
Not yet ingested
- Civics
- —
Market trends
- HPI YoY
- ▼ -0.82%
- Current HPI
- 417.89
- Rent YoY
- —
- Metro
- Dallas-Fort Worth-Arlington, TX
- State GDP YoY
- ▲ 3.95%
- F500 in state
- 110
Industry mix (Fortune 500 HQ in TX)
| Industry | F500 HQs | Revenue |
|---|---|---|
| Energy | 16 | $1,198B |
|
||
| Technology | 5 | $198B |
|
||
| Engineering / Construction | 4 | $72B |
|
||
| Energy Services | 3 | $60B |
|
||
| Utilities | 3 | $41B |
|
||
| Healthcare | 2 | $330B |
|
||
Price history
-16.7% since first listed8 events — show timeline
- 2026-05-12 Pending — NTREIS
- 2026-03-31 Contingent — NTREIS
- 2025-12-08 Price Changed $125,000 NTREIS
- 2025-10-30 Price Changed $135,000 NTREIS
- 2025-10-06 Price Changed $140,000 NTREIS
- 2025-09-15 Price Changed $145,000 NTREIS
- 2025-08-04 Listed $150,000 NTREIS
- 2003-07-09 Sold (Public Records) — Public Records
Property tax history
+4.2%/yrLatest (2025): $1,287 · -14.4% YoY. Source: county tax records.
Cash-flow waterfall
monthlySold comps — $/sqft
last 12 mo · ≤1 miLoading sold comps…