 Duplex
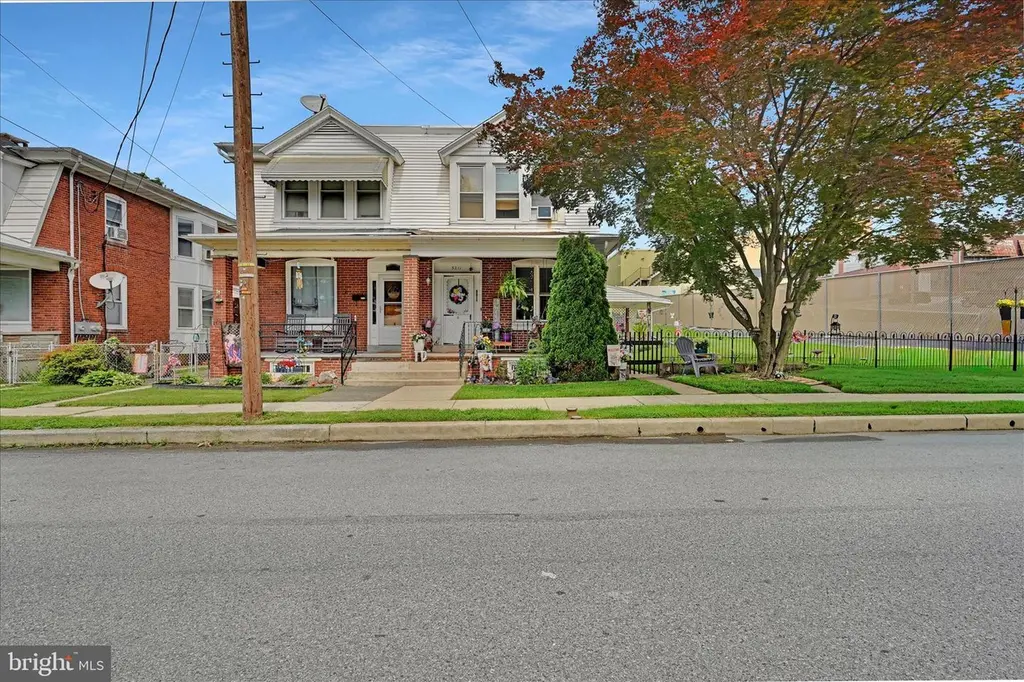
3211 Marion St · Laureldale, PA
Flood risk 1/10 · Minimal
- FEMA flood zone
- X (unshaded)
- Chance of flooding over 30 yrs
- 0.0%
- Est. flood insurance / yr
- $473 – $860
Fire risk 5/10 · Moderate
- Est. fire insurance / yr
- $511 – $949
Heat risk 5/10 · Moderate
- Hot days now (above 99°F)
- 8 days/yr
- Hot days in 30 yrs
- 17 days/yr
Wind risk 4/10 · Minor
- Chance of severe wind over 30 yrs
- 14.0%
Air-quality risk 2/10 · Minimal
- Unhealthy air days now
- 1 days/yr
- Unhealthy air days in 30 yrs
- 2 days/yr
Risk factors via First Street. Map © Google.
Why this score? — see what drove the C+ grade
The composite is a weighted blend of 9 inputs, each scored 0–100. Each bar is that input's sub-score; the figure is the points it added to the 100-point composite (weight × sub-score).
- Cash flow +27.7/30.0
- DSCR +9.8/10.0
- 1% rule +7.6/10.0
- ARV discount +7.5/15.0
- Livability +3.7/5.0
- Rent growth +2.5/5.0
- Condition / age +2.5/5.0
- Schools +2.1/10.0
- Appreciation +0.0/10.0
$250,000
🖨 Deal sheet (PDF) 📄 Offer letter ✓ Due diligence
Multi-family units
County records classify this as Multi-Family (2-4 Unit). Listing-text estimate: 2 units. confirmed
Listing remarks MLS
Muhlenberg 2 Unit. 1St Floor Completely Remodeled. Beautiful Kitchen And Bath. Berber Carpet, New Paint, New Windows. Covered Patio. Most Appliances Remain. Move Right In. 2Nd Unit Very Neat And Clean. Tenants For 5 Years Would Like To Stay. Nice Side Yard.
Key facts
- Covered patio
- Quiet area
- 7,405 sq ft lot
Tags
Property features AI
Finance
- Other: Ground rent payment listed as annually
- Financial info: Existing leases on a month-to-month basis; Reported total actual rent: $24,600 annually; Improvement and land assessed values recorded
Exterior
- Parking: On-street parking
- Utilities: Natural gas for heating and hot water; Electric for cooling; Public water; Public sewer
- Home design: Detached structure; Fee simple ownership
- Construction: Brick exterior; Permanent foundation
- Exterior features: Brick construction; Above-grade and below-grade structures noted; Public water and public sewer
Interior
- Bedrooms: One 1-bedroom unit; One 2-bedroom unit
- Heating & cooling: Baseboard hot water heating; Window air conditioning units (electric)
- Interior features: Two-unit building
Neighborhood map
What this means for you Summary
Snapshot
- This is a 1×2bd/1ba + 1×1bd/1ba units multifamily listed at $250k.
Deal economics
- At list price, monthly cash flow is $758 ($9k/yr) — positive. Per door: $379/mo.
- The deal already cash-flows at list — no discount required.
- Meets the 1% rule at list price ($3k rent vs $250k).
Location & tenants
- Location reads 73/100 on livability (#588 in PA) — a middle-class / working-renter tenant base. Strengths: crime A+, cost of living A+, housing A+; Watch: schools C-, amenities F, commute F.
- Muhlenberg SD (suburban): math 14% / reading 31% proficiency, ranked #475 of 539 in PA (top 88%) — low school quality limits family demand, transient renter base, plan for 1-2y turnover.
- Market conditions: 81 active listings in the ZIP; 1 comparable units currently listed for rent nearby; 258 units permitted in Berks County in 2024 (27 in 5+ unit buildings).
Forward outlook
- Local home prices are declining (-3.0%/yr); year-one equity from $2k of loan paydown is wiped out by about $8k of value loss. Plan a longer hold.
- Berks County population projected at +3% by 2050 — modest demand growth; plan on rents tracking national, not racing it.
- At projected returns (-3.0% appreciation + 3.0% rent growth), your $70k cash investment doubles in ~9 years — after that, you're playing with house money.
Negotiation context
- Only 7 days on market — expect competitive offers; lowballing is unlikely to land.
- 3 sale attempts since 26y ago with the ask held roughly flat each time — persistent listings suggest the price (not the market) is what's stuck; bring a comps-based counter.
- Current owner paid $85k; list at $250k implies a 194% gain — meaningful room to come down on a strong offer.
Risks & watch-outs
- Watch-outs: built in 1925 — expect roof / HVAC / electrical / plumbing capex.
- Climate carrying-cost: moderate wildfire risk; extreme-heat days projected 8→17/yr by 2055 (HVAC capex compounding) — expect insurance premiums to compound above CPI over the hold.
Questions for the listing agent
- Can we see the unit-by-unit rent roll, current vacancy, and any below-market leases? What's the average tenancy length?
- What capital expenditures (roof, boiler, parking lot, exteriors) have been made in the last 5 years, and what's planned in the next 2?
- Built in 1925 — when were the roof, HVAC, electrical panel, plumbing, and water heater last replaced?
- Is there a deadline driving the sale (1031 exchange, divorce, estate, relocation)? That informs how much negotiation room exists.
- What's the average days-on-market for RENTAL listings here right now (not sales)? A rising rental-DOM trend means longer vacancies and softer asking-rent achievability than the comps imply.
- What's the recent tenant-quality profile in this submarket — average credit score on applications, eviction rate, late-payment / NSF rate, and stable-employment percentage? A property-management company in the area should have these aggregated.
- How much new apartment / multifamily construction is in the pipeline within 1–3 miles? Heavy new supply (>2% of stock underway) typically softens rents 12–24 months out; light construction supports rent growth.
Investment metrics
- 1% rule
- 1.26% ✓
- Cap rate
- 9.93%
- Cash-on-cash
- 12.99%
- DSCR
- 1.58
- GRM
- 6.6
CMA / ARV
No comps found within radius.
Projected returns pro-forma
-3.0% appreciation · 3.0% rent growth · sell at horizon
- IRR
- 2.9%
- Equity multiple
- 1.11×
- Total profit
- $7,812
- Equity at exit
- $37,276
- IRR
- 12.5%
- Equity multiple
- 1.99×
- Total profit
- $69,169
- Equity at exit
- $21,615
Cash invested: $70,000 (down + closing). Projections, not guarantees.
Landlord ↔ Tenant lean methodology
- Overall (STATE)
- 62 Landlord-Friendly
- State Pennsylvania
- 62 Landlord-Friendly · EVEN
- County
- — inherits STATE
- City
- — inherits STATE
ZIP-level market 19605
- Home prices YoY
- -12.2%
- Active inventory
- 81
- Price-to-rent
- 12.9×
Monthly cashflow live
- Estimated rent
- $3,155 high interval (Pro) →
- Mortgage (P&I)
- −$1,311
- Tax from tax record
- −$319 /mo · $3,832/yr
- Insurance
- −$104
- HOA
- −$0
- Vacancy / Maint / Mgmt
- −$663
- Net cashflow
- $758
Break-even live
Sensitivity live
| Price | -10% $899 | -5% $829 | +0% $758 | +5% $687 | +10% $616 |
|---|---|---|---|---|---|
| Rent | -10% $509 | -5% $633 | +0% $758 | +5% $883 | +10% $1,007 |
| Rate | -1.0pp $884 | -0.5pp $821 | base $758 | +0.5pp $693 | +1.0pp $627 |
2-unit breakdown (identical units grouped — click to expand)
| Units | Beds | Baths | Est. rent |
|---|---|---|---|
| 1× unit | 2 | 1 | $1,609 |
| 1× unit | 1 | 1 | $1,546 |
| Total (2 units) | $3,155 | ||
UW: 25.0% down · 7.5% · 30yr · 1.5% tax · 5.0% vac · 8.0% maint · 8.0% mgmt
Financing live
Cash to close
- Down payment
- $62,500
- Closing costs
- $7,500
- Reserves months
- —
- Total cash needed
- —
Loan-product check · same deal, 3 products live
Conventional
25% down · 7.5% · 30yr
- Down + closing
- —
- Monthly P&I
- —
- Monthly cashflow
- —
- DSCR
- —
- Eligible?
- —
Personal DTI + credit; lowest rate.
DSCR
20% down · 8.5% · 30yr
- Down + closing
- —
- Monthly P&I
- —
- Monthly cashflow
- —
- DSCR
- —
- Eligible?
- —
No personal income docs; deal must DSCR.
Hard money
10% down · 12.0% · 12mo
- Down + closing
- —
- Monthly P&I
- —
- Monthly cashflow
- —
- DSCR
- —
- Eligible?
- —
Short-term bridge; refi at stabilization.
Rent comps 1 comps
| Address | Beds | Baths | Sqft | Rent | $/sqft | DOM | Units | Dist |
|---|---|---|---|---|---|---|---|---|
| 1000 Reserve Way Temple, PA | 1.0–2.0 | 1.0–2.0 | 993 | $1,835 | $1.85 | 14d | 7 | 0.93mi |
Listing history 12 events
-
2026-06-07statusdays on market $250,000 Pending 7 DOM
-
2026-06-02days on market $250,000 Active 5 DOM
-
2026-06-01days on market $250,000 Active 4 DOM
-
2026-06-01remarks 501-char remark
-
2026-05-31days on market $250,000 Active 3 DOM
-
2026-05-30days on market $250,000 Active 2 DOM
-
2026-05-28$250,000 Active
-
2011-09-30historical
-
2011-03-21$137,900
-
2000-12-28soldstatus $85,000 257-char remark
Show marketing remark (257 chars)
Muhlenberg 2 Unit. 1St Floor Completely Remodeled. Beautiful Kitchen And Bath. Berber Carpet, New Paint, New Windows. Covered Patio. Most Appliances Remain. Move Right In. 2Nd Unit Very Neat And Clean. Tenants For 5 Years Would Like To Stay. Nice Side Yard.
-
2000-11-22historical 257-char remark
Show marketing remark (257 chars)
Muhlenberg 2 Unit. 1St Floor Completely Remodeled. Beautiful Kitchen And Bath. Berber Carpet, New Paint, New Windows. Covered Patio. Most Appliances Remain. Move Right In. 2Nd Unit Very Neat And Clean. Tenants For 5 Years Would Like To Stay. Nice Side Yard.
-
2000-11-12$85,000 257-char remark
Show marketing remark (257 chars)
Muhlenberg 2 Unit. 1St Floor Completely Remodeled. Beautiful Kitchen And Bath. Berber Carpet, New Paint, New Windows. Covered Patio. Most Appliances Remain. Move Right In. 2Nd Unit Very Neat And Clean. Tenants For 5 Years Would Like To Stay. Nice Side Yard.
ⓘ Source: listings_history table (triggers on properties + properties_extension) + one-shot
backfill from property_details.listing_events for pre-trigger history.
Tax reassessment forecast PA · Partial reset (capped growth)
- Current annual tax
- $3,832 · $319/mo
- Projected year-2 tax
- $3,891 · $324/mo
- Expected delta
- +$59/yr (+$5/mo · 1.5%)
ⓘ Screening estimate from a state-policy table — verify with the county assessor before closing.
Climate risk First Street
- Flood 1/10 Low FEMA zone X (unshaded) · 0% chance over 30 yrs
- Wildfire 5/10 Major
- Heat 5/10 Major 8 d/yr ≥99°F today · 17 d/yr by 30 yrs out
- Wind 4/10 Moderate 14% chance of damaging wind over 30 yrs
- Air quality 2/10 Low 1 unhealthy d/yr today · 2 by 30 yrs out
Nearby sold comps map
Loading sold comps map…
Walkable amenities ~0.75 mi
Loading nearby amenities…
Taxation est. · year 1
- Rental income
- $37,860
- − Mortgage interest
- −$14,004
- − Property taxes
- −$3,832
- − Insurance
- −$1,250
- − Repairs & maintenance
- −$3,029
- − Management
- −$3,029
- − Depreciation
- −$7,273
- Taxable income
- $5,443
- Est. tax owed @ 24.0%
- −$1,306
- After-tax cash flow
- $7,788/yr
For passive investors: Depreciation is non-cash, so a rental often shows a tax loss while cash-flowing — sheltering income. Rental losses are passive: they offset passive income freely, and up to $25,000/yr can offset ordinary (W-2) income if you actively participate and your MAGI is under $100k (phasing out to $0 by $150k); unused losses carry forward. On sale, claimed depreciation is recaptured at up to 25%, and gains may owe capital-gains tax (a 1031 exchange can defer both). Figures are a year-1 estimate at your 24.0% rate — not tax advice; consult a CPA.
Schools (NCES district)
- District
- Muhlenberg SD
- NCES district ID
- 4216200
- Math proficiency
- 14% ▼ -20.00%
- Reading proficiency
- 31% ▼ -16.00%
- Median HH income
- $58,131
- Composite
- 20.7/100
- National rank
- #8526
- State rank
- #475 of 539 in PA
Livability — Laureldale
- Score
- 73/100
- State rank
- #588
- US rank
- #5625
Category grades
Schools grade is shown separately in the Schools card above.
Census & demographics
- Census place
- Laureldale, PA
- Population (ZIP)
- 20,916
Population outlook (Berks County) Hauer SSP2
- Today (2025)
- 425,767 people
- By 2030
- 428,814 · +0.7%
- By 2040
- 433,463 · +1.8%
- By 2050
- 439,426 · +3.2%
- By 2075
- 478,647 · +12.4%
- By 2100
- 518,507 · +21.8%
Race, ethnicity, and origin ACS 2023
- Neighborhood character
- Diverse neighborhood (Simpson 0.55)
- Race & ethnicity
- White 60% Hispanic / Latino 29% Two or more races 10% Black 7% Asian 2% Native American 1%
- Hispanic origin (detail)
- Mexican 7% Puerto Rican 12% Dominican 7%
- Common ancestry
- Polish 5% Romanian 5% Lithuanian 3%
- Foreign-born
- 12% · Canada, Vietnam
- Languages at home
- 76% English-only · Spanish 20% French/Haitian/Cajun 1% Vietnamese 1%
Political lean MEDSL · Berks
- 2024 margin
- R (+12.2) · D 43.4% · R 55.6%
- 2008→2024 swing
- -21.4pp toward R · 2008: 9.2pp · 2024: -12.2pp
- All cycles
- 2024: R+12.2 2020: R+8.2 2016: R+10.2 2012: R+0.6 2008: D+9.2
Not yet ingested
- Civics
- —
Market trends
- HPI YoY
- ▼ -39.46%
- Current HPI
- 283.9138
- Rent YoY
- —
- Metro
- —
- State GDP YoY
- ▲ 1.68%
- F500 in state
- 34
Industry mix (Fortune 500 HQ in PA)
| Industry | F500 HQs | Revenue |
|---|---|---|
| Healthcare | 2 | $309B |
|
||
| Insurance | 2 | $27B |
|
||
| Telecommunications / Media | 1 | $124B |
|
||
| Industrial Distribution | 1 | $22B |
|
||
| Financial Services | 1 | $20B |
|
||
| Chemicals / Materials | 1 | $18B |
|
||
Price history
+194.1% since first listed6 events — show timeline
- 2026-05-28 Listed $250,000 BRIGHT MLS
- 2011-09-30 Listing Removed — BRIGHT MLS
- 2011-03-21 Listed $137,900 BRIGHT MLS
- 2000-12-28 Sold (MLS) $85,000 BRIGHT MLS
- 2000-11-22 Listing Removed — BRIGHT MLS
- 2000-11-12 Listed $85,000 BRIGHT MLS
Property tax history
+2.1%/yrLatest (2026): $3,832 · +0.0% YoY. Source: county tax records.
Cash-flow waterfall
monthlySold comps — $/sqft
last 12 mo · ≤1 miLoading sold comps…