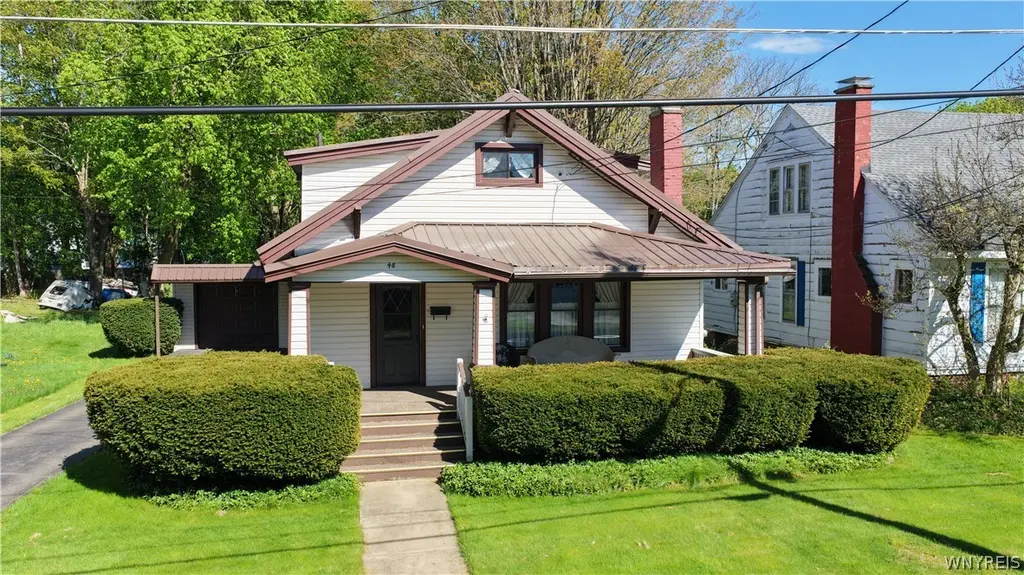
48 Swan St · Salamanca, NY
Flood risk 1/10 · Minimal
- FEMA flood zone
- X
- Chance of flooding over 30 yrs
- 0.0%
- Est. flood insurance / yr
- $473 – $860
Fire risk 2/10 · Minimal
- Est. fire insurance / yr
- $691 – $1,283
Heat risk 2/10 · Minimal
- Hot days now (above 90°F)
- 8 days/yr
- Hot days in 30 yrs
- 18 days/yr
Wind risk 1/10 · Minimal
- Chance of severe wind over 30 yrs
- —
Air-quality risk 1/10 · Minimal
- Unhealthy air days now
- 0 days/yr
- Unhealthy air days in 30 yrs
- 0 days/yr
Risk factors via First Street. Map © Google.
Why this score? — see what drove the B- grade
The composite is a weighted blend of 9 inputs, each scored 0–100. Each bar is that input's sub-score; the figure is the points it added to the 100-point composite (weight × sub-score).
- Cash flow +30.0/30.0
- DSCR +10.0/10.0
- 1% rule +7.6/10.0
- Appreciation +7.3/10.0
- Livability +3.6/5.0
- Schools +3.0/10.0
- Rent growth +2.5/5.0
- Condition / age +2.5/5.0
- ARV discount +0.0/15.0
$140,000
🖨 Deal sheet 📄 Offer letter ✓ Due diligence
Listing remarks
Situated on a quiet neighborhood street in the City of Salamanca, 48 Swan Street delivers classic character, generous living space, and excellent value for buyers looking to build equity in today’s market. This 3-bedroom, 1.5-bath home offers approximately 1,700 square feet of living space with a detached garage and a manageable city lot, creating the perfect opportunity for a primary residence, investment property, or first-time home purchase. Built in the 1920s, the home offers the warmth and craftsmanship of an earlier era while providing room for updates and personalization. Buyers will appreciate the spacious layout, comfortable room sizes, fireplace, natural light, and flexible
Key facts
- Near schools
- Near shopping
- Near parks
Tags
Property features AI
Exterior
- Parking: Detached garage; 1 garage space
- Utilities: Public water connected; Sewer connected; Electric with circuit breakers
- Home design: 2-story home; Existing/resale property
- Construction: Vinyl siding; Block foundation
- Exterior features: Blacktop driveway; Rectangular residential lot; City street frontage; Lot dimensions 52 x 164
Interior
- Kitchen: Gas oven; Gas range; Refrigerator
- Bedrooms: One bedroom on the main level
- Flooring: Carpet; Vinyl; Varied flooring
- Bathrooms: One full bathroom; One half bathroom; One main-level bathroom
- Heating & cooling: Gas forced-air heating
- Interior features: Separate/formal living room; Country-style kitchen; Full basement
- Laundry & utility: Laundry in the basement; Gas water heater
Neighborhood map
What this means for you Summary
Snapshot
- This is a 3-bed/1.5-bath single-family listed at $140k.
Deal economics
- At list price, monthly cash flow is $524 ($6k/yr) — positive.
- The deal already cash-flows at list — no discount required.
- Meets the 1% rule at list price ($2k rent vs $140k).
Location & tenants
- Location reads 71/100 on livability (#380 in NY) — a middle-class / working-renter tenant base. Strengths: cost of living A+, housing A+, health & safety A+; Watch: schools C-, crime C-, amenities F.
- Salamanca City School District (town): math 29% / reading 43% proficiency, ranked #560 of 590 in NY (top 95%) — families likely to look elsewhere, expect single-tenant / working-renter base with shorter leases.
- Market conditions: 27 active listings in the ZIP; 128 units permitted in Cattaraugus County in 2024 (21 in 5+ unit buildings).
Forward outlook
- In year one you build about $7k of equity ($968 loan paydown + $6k appreciation (4.5% local appreciation)).
- Cattaraugus County population projected at -28% by 2050 — secular population decline; favor cash flow + early exit over multi-decade hold.
- At projected returns (4.5% appreciation + 3.0% rent growth), your $39k cash investment doubles in ~3 years — after that, you're playing with house money.
- By year 5, paydown + projected appreciation supports a ~$32k cash-out refi (75% LTV) — recoverable capital for the next deal without selling this one.
Negotiation context
- Only 1 days on market — expect competitive offers; lowballing is unlikely to land.
Risks & watch-outs
- Watch-outs: built in 1925 — expect roof / HVAC / electrical / plumbing capex.
Questions for the listing agent
- Built in 1925 — when were the roof, HVAC, electrical panel, plumbing, and water heater last replaced?
- Is there a deadline driving the sale (1031 exchange, divorce, estate, relocation)? That informs how much negotiation room exists.
- What's the average days-on-market for RENTAL listings here right now (not sales)? A rising rental-DOM trend means longer vacancies and softer asking-rent achievability than the comps imply.
- What's the recent tenant-quality profile in this submarket — average credit score on applications, eviction rate, late-payment / NSF rate, and stable-employment percentage? A property-management company in the area should have these aggregated.
- How much new for-sale + rental construction is in the pipeline within 1–3 miles? Heavy new supply typically softens prices + rents 12–24 months out; constrained supply supports both.
Investment metrics
- 1% rule
- 1.26% ✓
- Cap rate
- 10.78%
- Cash-on-cash
- 16.03%
- DSCR
- 1.71
- GRM
- 6.6
CMA / ARV
- ARV (on-the-fly)
- $116,076
- Comps found
- 9
Show comp detail 9 sales within ~0.75 mi
| Address | Dist | Beds/Ba | Sqft | Sold | Price | $/sf | Match |
|---|---|---|---|---|---|---|---|
| 77 Kent Blvd | 0.21mi | 4/1.5 (+1) | 1,744 (+2%) | 19mo | $156,000 | $89 | 66 |
| 384 Broad St | 0.08mi | 4/2.0 (+1) | 1,894 (+11%) | 6mo | $120,000 | $63 | 66 |
| 335 Broad St | 0.12mi | 4/2.0 (+1) | 1,862 (+9%) | 11mo | $127,500 | $68 | 63 |
| 66 Waite Ave | 0.64mi | 3/1.5 | 1,647 (-4%) | 4mo | $179,900 | $109 | 61 |
| 84 Frank St | 0.45mi | 4/1.0 (+1) | 1,865 (+9%) | 15mo | $121,900 | $65 | 44 |
| 17 Waite Ave | 0.62mi | 4/1.0 (+1) | 1,747 (+2%) | 22mo | $58,000 | $33 | 42 |
| 96 Frank St | 0.45mi | 3/1.0 | 1,465 (-14%) | 15mo | $100,000 | $68 | 41 |
| 20 Fawn Ave | 0.55mi | 4/2.0 (+1) | 1,523 (-11%) | 15mo | $130,000 | $85 | 37 |
| 15 Smith St | 0.59mi | 4/1.5 (+1) | 1,960 (+15%) | 15mo | $180,000 | $92 | 30 |
Match score weights: distance 35% · size 25% · config 20% · recency 20%. Top-matched comps best support the ARV.
Projected returns pro-forma
4.52% appreciation · 3.0% rent growth · sell at horizon
- IRR
- 25.8%
- Equity multiple
- 2.58×
- Total profit
- $61,809
- Equity at exit
- $75,322
- IRR
- 25.2%
- Equity multiple
- 5.08×
- Total profit
- $159,871
- Equity at exit
- $126,791
Cash invested: $39,200 (down + closing). Projections, not guarantees.
Landlord ↔ Tenant lean methodology
- Overall (STATE)
- 15 Strongly Tenant-Friendly
- State New York
- 15 Strongly Tenant-Friendly · D+10
- County
- — inherits STATE
- City
- — inherits STATE
ZIP-level market 14779
- Home prices YoY
- 1.4%
- Active inventory
- 27
- Price-to-rent
- 6.6×
Monthly cashflow live
- Estimated rent
- $1,767 medium interval (Pro) →
- Mortgage (P&I)
- −$734
- Tax from tax record
- −$80 /mo · $960/yr
- Insurance
- −$58
- HOA
- −$0
- Vacancy / Maint / Mgmt
- −$371
- Net cashflow
- $524
Break-even live
UW: 25.0% down · 7.5% · 30yr · 1.5% tax · 5.0% vac · 8.0% maint · 8.0% mgmt
Financing live
Cash to close
- Down payment
- $35,000
- Closing costs
- $4,200
- Reserves months
- —
- Total cash needed
- —
Loan-product check · same deal, 3 products live
Conventional
25% down · 7.5% · 30yr
- Down + closing
- —
- Monthly P&I
- —
- Monthly cashflow
- —
- DSCR
- —
- Eligible?
- —
Personal DTI + credit; lowest rate.
DSCR
20% down · 8.5% · 30yr
- Down + closing
- —
- Monthly P&I
- —
- Monthly cashflow
- —
- DSCR
- —
- Eligible?
- —
No personal income docs; deal must DSCR.
Hard money
10% down · 12.0% · 12mo
- Down + closing
- —
- Monthly P&I
- —
- Monthly cashflow
- —
- DSCR
- —
- Eligible?
- —
Short-term bridge; refi at stabilization.
Listing history 1 events
-
2026-05-26$140,000 Active
ⓘ Source: listings_history table (triggers on properties + properties_extension) + one-shot
backfill from property_details.listing_events for pre-trigger history.
Tax reassessment forecast NY · Partial reset (capped growth)
- Current annual tax
- $960 · $80/mo
- Projected year-2 tax
- $1,663 · $139/mo
- Expected delta
- +$703/yr (+$59/mo · 73.3%)
ⓘ Screening estimate from a state-policy table — verify with the county assessor before closing.
Climate risk First Street
- Flood 1/10 Low FEMA zone X · 0% chance over 30 yrs
- Wildfire 2/10 Low
- Heat 2/10 Low 8 d/yr ≥90°F today · 18 d/yr by 30 yrs out
- Wind 1/10 Low
- Air quality 1/10 Low 0 unhealthy d/yr today · 0 by 30 yrs out
Nearby sold comps map
Loading sold comps map…
Walkable amenities ~0.75 mi
Loading nearby amenities…
Taxation est. · year 1
- Rental income
- $21,206
- − Mortgage interest
- −$7,842
- − Property taxes
- −$960
- − Insurance
- −$700
- − Repairs & maintenance
- −$1,696
- − Management
- −$1,696
- − Depreciation
- −$4,073
- Taxable income
- $4,238
- Est. tax owed @ 24.0%
- −$1,017
- After-tax cash flow
- $5,266/yr
For passive investors: Depreciation is non-cash, so a rental often shows a tax loss while cash-flowing — sheltering income. Rental losses are passive: they offset passive income freely, and up to $25,000/yr can offset ordinary (W-2) income if you actively participate and your MAGI is under $100k (phasing out to $0 by $150k); unused losses carry forward. On sale, claimed depreciation is recaptured at up to 25%, and gains may owe capital-gains tax (a 1031 exchange can defer both). Figures are a year-1 estimate at your 24.0% rate — not tax advice; consult a CPA.
Schools (NCES district)
- District
- Salamanca City School District
- NCES district ID
- 3625440
- Math proficiency
- 29% ▼ -12.00%
- Reading proficiency
- 43% ▲ 5.00%
- Median HH income
- $33,251
- Composite
- 29.52/100
- National rank
- #6500
- State rank
- #560 of 590 in NY
Livability — Salamanca
- Score
- 71/100
- State rank
- #380
- US rank
- #6521
Category grades
Schools grade is shown separately in the Schools card above.
Census & demographics
- Census place
- Salamanca, NY
- Population (ZIP)
- 6,791
Population outlook (Cattaraugus County) Hauer SSP2
- Today (2025)
- 71,623 people
- By 2030
- 67,751 · -5.4%
- By 2040
- 59,488 · -16.9%
- By 2050
- 51,601 · -28.0%
- By 2075
- 35,025 · -51.1%
- By 2100
- 21,243 · -70.3%
Race, ethnicity, and origin ACS 2023
- Neighborhood character
- Predominantly White (68%)
- Race & ethnicity
- White 68% Native American 18% Two or more races 9% Hispanic / Latino 5% Black 2%
- Common ancestry
- Romanian 9% Lithuanian 2% Slovak 1%
- Foreign-born
- 2% · Canada
- Languages at home
- 95% English-only · Spanish 2%
Political lean MEDSL · Cattaraugus
- 2024 margin
- Solid R (+32.8) · D 33.6% · R 66.4%
- 2008→2024 swing
- -22.2pp toward R · 2008: -10.6pp · 2024: -32.8pp
- All cycles
- 2024: R+32.8 2020: R+29.5 2016: R+34.4 2012: R+13.4 2008: R+10.6
Not yet ingested
- Civics
- —
Market trends
- HPI YoY
- ▲ 4.52%
- Current HPI
- 320.5286
- Rent YoY
- —
- Metro
- —
- State GDP YoY
- ▲ 2.60%
- F500 in state
- 92
Industry mix (Fortune 500 HQ in NY)
| Industry | F500 HQs | Revenue |
|---|---|---|
| Financial Services | 10 | $950B |
|
||
| Consumer Goods | 9 | $162B |
|
||
| Insurance | 4 | $225B |
|
||
| Telecommunications | 2 | $144B |
|
||
| Pharmaceuticals | 2 | $112B |
|
||
| Media / Entertainment | 2 | $69B |
|
||
Price history
1 event — show timeline
- 2026-05-26 Listed $140,000 WNYREIS
Property tax history
+10.3%/yrLatest (2025): $960 · +15.1% YoY. Source: county tax records.
Cash-flow waterfall
monthlySold comps — $/sqft
last 12 mo · ≤1 miLoading sold comps…