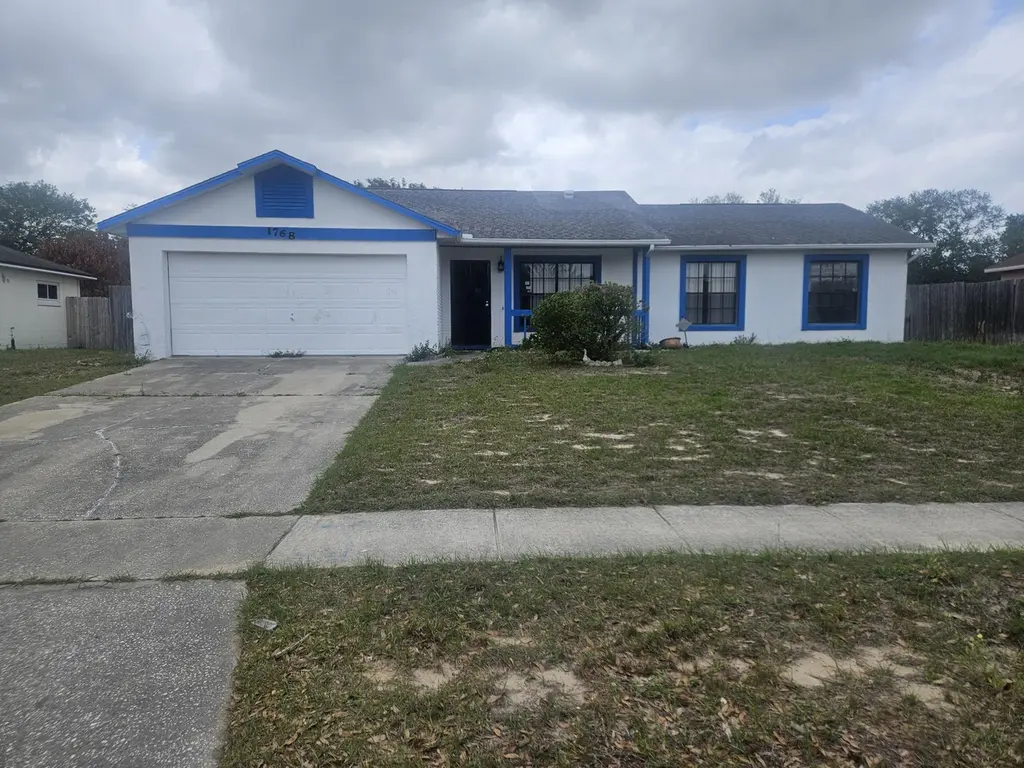
1768 Torrey Dr · Pine Hills, FL
Flood risk 1/10 · Minimal
- FEMA flood zone
- X (unshaded)
- Chance of flooding over 30 yrs
- 0.0%
- Est. flood insurance / yr
- $507 – $1,088
Fire risk 1/10 · Minimal
- Est. fire insurance / yr
- $947 – $1,759
Heat risk 9/10 · Severe
- Hot days now (above 108°F)
- 7 days/yr
- Hot days in 30 yrs
- 23 days/yr
Wind risk 9/10 · Severe
- Chance of severe wind over 30 yrs
- 99.0%
Air-quality risk 1/10 · Minimal
- Unhealthy air days now
- 0 days/yr
- Unhealthy air days in 30 yrs
- 0 days/yr
Risk factors via First Street. Map © Google.
Why this score? — see what drove the D+ grade
The composite is a weighted blend of 9 inputs, each scored 0–100. Each bar is that input's sub-score; the figure is the points it added to the 100-point composite (weight × sub-score).
- ARV discount +15.0/15.0
- Cash flow +14.1/30.0
- DSCR +4.3/10.0
- Schools +4.1/10.0
- Livability +3.7/5.0
- 1% rule +2.7/10.0
- Condition / age +2.5/5.0
- Rent growth +1.8/5.0
- Appreciation +0.0/10.0
$299,000
🖨 Deal sheet (PDF) 📄 Offer letter ✓ Due diligence
Listing remarks
"Priced for a quick sale! This property offers incredible potential for buyers looking to customize and add value. Being sold AS-IS and ready for your personal touch. A great opportunity for investors or homeowners willing to put in some TLC - don't miss out!"
Key facts
- 0.23 acre lot
- 2 garage spots
- Built 1988
Neighborhood map
What this means for you Summary
Snapshot
- This is a 4-bed/2.0-bath single-family listed at $299k.
Deal economics
- At list price, monthly cash flow is $45 ($540/yr) — positive.
- The deal already cash-flows at list — no discount required.
- To meet the 1% rule (rent ≥ 1% of price), the offer needs to be $230k (23.1% below list).
- Recommended offer: $230k (23.1% below list) — sets the bar for 1% rule.
- Cap rate 6.5% vs local median 4.9% in Pine Hills — top-decile yield for the area; either an underpriced asset or a hidden risk that comps aren't pricing in. Stress-test before assuming the spread holds.
Location & tenants
- Location reads 73/100 on livability (#317 in FL) — a middle-class / working-renter tenant base. Strengths: commute A+, cost of living A+, housing A+; Watch: crime D+, employment D, amenities F.
- Orange (suburban): math 46% / reading 51% proficiency, ranked #43 of 73 in FL (top 59%) — families likely to look elsewhere, expect single-tenant / working-renter base with shorter leases.
- Market conditions: Rents soft (-2.7%/yr); 178 active listings in the ZIP; 26 comparable units currently listed for rent nearby; rentals at typical pace (median 15d on market — plan ~3-4 weeks tenant-placement turnaround); 8,053 units permitted in Orange County in 2024 (3,133 in 5+ unit buildings).
- This rent runs 44% of the median local income ($63k/yr) — at the standard rent-burdened threshold; future hikes will face affordability resistance.
Forward outlook
- Local home prices are declining (-3.0%/yr); year-one equity from $2k of loan paydown is wiped out by about $9k of value loss. Plan a longer hold.
- Orange County population projected at +52% by 2050 — long-run rental-demand tailwind backs the buy-and-hold thesis.
Negotiation context
- Only 5 days on market — expect competitive offers; lowballing is unlikely to land.
Risks & watch-outs
- Climate carrying-cost: severe wind risk, 99% chance of damaging wind over 30y; extreme-heat days projected 7→23/yr by 2055 (HVAC capex compounding) — expect insurance premiums to compound above CPI over the hold.
Questions for the listing agent
- Is there a deadline driving the sale (1031 exchange, divorce, estate, relocation)? That informs how much negotiation room exists.
- Schools are B-rated — typically a magnet for longer-tenancy family renters. What's the average tenant stay here, and is there a school-zone premium baked into asking?
- Crime grade is D in this area — have there been break-ins, vandalism, or insurance claims at this property in the last 3 years? What carrier currently insures it and at what premium?
- The area grade is low — what's the realistic commute time and amenity access for the typical tenant pool here? Any planned neighborhood developments (good or bad) we should know about?
- What's the average days-on-market for RENTAL listings here right now (not sales)? A rising rental-DOM trend means longer vacancies and softer asking-rent achievability than the comps imply.
- What's the recent tenant-quality profile in this submarket — average credit score on applications, eviction rate, late-payment / NSF rate, and stable-employment percentage? A property-management company in the area should have these aggregated.
- How much new for-sale + rental construction is in the pipeline within 1–3 miles? Heavy new supply typically softens prices + rents 12–24 months out; constrained supply supports both.
Investment metrics
- 1% rule
- 0.77% ✗
- Cap rate
- 6.47%
- Cash-on-cash
- 0.64%
- DSCR
- 1.03
- GRM
- 10.8
CMA / ARV
- ARV (on-the-fly)
- $379,260
- Comps found
- 5
Show comp detail 5 sales within ~0.75 mi
| Address | Dist | Beds/Ba | Sqft | Sold | Price | $/sf | Match |
|---|---|---|---|---|---|---|---|
| 7366 Briarlyn Ct | 0.13mi | 3/2.0 (-1) | 1,454 (-1%) | 18mo | $365,000 | $251 | 72 |
| 1909 Torrey Dr | 0.18mi | 3/2.0 (-1) | 1,642 (+12%) | 2mo | $355,000 | $216 | 65 |
| 1236 Lamplighter Way | 0.14mi | 3/2.0 (-1) | 1,258 (-14%) | 3mo | $330,000 | $262 | 62 |
| 1726 Torrey Dr | 0.10mi | 3/2.0 (-1) | 1,302 (-11%) | 13mo | $355,000 | $273 | 60 |
| 7139 Blair Dr | 0.67mi | 3/2.0 (-1) | 1,432 (-3%) | 24mo | $370,000 | $258 | 40 |
Match score weights: distance 35% · size 25% · config 20% · recency 20%. Top-matched comps best support the ARV.
Projected returns pro-forma
-3.0% appreciation · 0.0% rent growth · sell at horizon
- IRR
- -18.3%
- Equity multiple
- 0.37×
- Total profit
- $-52,476
- Equity at exit
- $44,582
- IRR
- -16.8%
- Equity multiple
- 0.18×
- Total profit
- $-68,657
- Equity at exit
- $25,852
Cash invested: $83,720 (down + closing). Projections, not guarantees.
Landlord ↔ Tenant lean methodology
- Overall (STATE)
- 87 Strongly Landlord-Friendly
- State Florida
- 87 Strongly Landlord-Friendly · R+3
- County
- — inherits STATE
- City
- — inherits STATE
ZIP-level market 32818
- Home prices YoY
- -22.5%
- Rents YoY
- -2.7%
- Active inventory
- 178
- Price-to-rent
- 10.8×
Monthly cashflow live
- Estimated rent
- $2,301 high interval (Pro) →
- Mortgage (P&I)
- −$1,568
- Tax from tax record
- −$80 /mo · $961/yr
- Insurance
- −$125
- HOA
- −$0
- Vacancy / Maint / Mgmt
- −$483
- Net cashflow
- $45
Break-even live
Sensitivity live
| Price | -10% $214 | -5% $130 | +0% $45 | +5% $-40 | +10% $-124 |
|---|---|---|---|---|---|
| Rent | -10% $-137 | -5% $-46 | +0% $45 | +5% $136 | +10% $227 |
| Rate | -1.0pp $196 | -0.5pp $121 | base $45 | +0.5pp $-33 | +1.0pp $-111 |
UW: 25.0% down · 7.5% · 30yr · 1.5% tax · 5.0% vac · 8.0% maint · 8.0% mgmt
Financing live
Cash to close
- Down payment
- $74,750
- Closing costs
- $8,970
- Reserves months
- —
- Total cash needed
- —
Loan-product check · same deal, 3 products live
Conventional
25% down · 7.5% · 30yr
- Down + closing
- —
- Monthly P&I
- —
- Monthly cashflow
- —
- DSCR
- —
- Eligible?
- —
Personal DTI + credit; lowest rate.
DSCR
20% down · 8.5% · 30yr
- Down + closing
- —
- Monthly P&I
- —
- Monthly cashflow
- —
- DSCR
- —
- Eligible?
- —
No personal income docs; deal must DSCR.
Hard money
10% down · 12.0% · 12mo
- Down + closing
- —
- Monthly P&I
- —
- Monthly cashflow
- —
- DSCR
- —
- Eligible?
- —
Short-term bridge; refi at stabilization.
Rent comps 26 comps
| Address | Beds | Baths | Sqft | Rent | $/sqft | DOM | Units | Dist |
|---|---|---|---|---|---|---|---|---|
| 1109 Woodman Way Orlando, FL | 3.0 | 2.0 | 1124 | $1,750 | $1.56 | 22d | 1 | 0.22mi |
| 1748 Brightmeadow Ct Orlando, FL | 3.0 | 2.0 | 1685 | $2,200 | $1.31 | 18d | 1 | 0.63mi |
| 7108 Steffie Ln Orlando, FL | 3.0 | 2.0 | 1501 | $2,277 | $1.52 | 22d | 1 | 0.67mi |
| 8008 Balasands Blvd Orlando, FL | 1.0–3.0 | 1.0–2.0 | 1091 | $2,290 | $2.10 | 2d | 11 | 0.69mi |
| 929 Pahoa St Orlando, FL | 3.0 | 2.0 | 1625 | $2,390 | $1.47 | 5d | 1 | 0.80mi |
| 1005 Delnova Ln Orlando, FL | 4.0 | 2.0 | 1554 | $2,650 | $1.71 | 12d | 1 | 0.88mi |
| 1826 Mulberrywood Ct Orlando, FL | 4.0 | 2.0 | 1782 | $2,225 | $1.25 | 22d | 1 | 0.92mi |
| 1826 Mulberrywood Ct Orlando, FL | 4.0 | 2.0 | 1782 | $2,225 | $1.25 | 24d | 1 | 0.92mi |
| 414 Sandpiper Ridge Dr Orlando, FL | 3.0 | 2.0 | 1620 | $2,500 | $1.54 | 18d | 1 | 1.01mi |
| 2310 Aloha Bay Ct Ocoee, FL | 3.0 | 2.5 | 1562 | $1,995 | $1.28 | 12d | 1 | 1.01mi |
| 2310 Aloha Bay Ct Ocoee, FL | 3.0 | 2.5 | 1562 | $1,995 | $1.28 | 11d | 1 | 1.01mi |
| 371 Snowshoe Ct Orlando, FL | 3.0 | 2.0 | 1417 | $2,540 | $1.79 | 14d | 1 | 1.01mi |
| 6623 Swyear Ct Orlando, FL | 4.0 | 2.0 | 1842 | $2,300 | $1.25 | 22d | 1 | 1.04mi |
| 2299 Aloha Bay Ct Ocoee, FL | 3.0 | 2.5 | 1630 | $2,200 | $1.35 | 17d | 1 | 1.06mi |
| 2000 Erving Cir Ocoee, FL | 2.0–3.0 | 2.0 | 1161 | $1,950 | $1.68 | 24d | 2 | 1.17mi |
| 2000 Erving Cir #208 Ocoee, FL | 3.0 | 2.0 | 1292 | $1,950 | $1.51 | 8d | 1 | 1.17mi |
| 7222 Nima Ct Orlando, FL | 3.0 | 2.5 | 1449 | $2,400 | $1.66 | 15d | 1 | 1.20mi |
| 247 Grove St Orlando, FL | 3.0 | 2.0 | 1113 | $2,250 | $2.02 | 2d | 1 | 1.21mi |
| 247 Grove St Orlando, FL | 3.0 | 2.0 | 1113 | $2,250 | $2.02 | 24d | 1 | 1.21mi |
| 219 Ashbourne Dr Orlando, FL | 3.0 | 2.0 | 1080 | $2,205 | $2.04 | 8d | 1 | 1.25mi |
| 245 Alston Dr Orlando, FL | 3.0 | 2.5 | 1385 | $2,300 | $1.66 | 5d | 1 | 1.29mi |
| 2603 Silkwood Cir Orlando, FL | 2.0–3.0 | 2.0 | 1114 | $1,898 | $1.70 | 3d | 18 | 1.33mi |
| 106 Cranfield Ct Orlando, FL | 4.0 | 2.0 | 1263 | $2,500 | $1.98 | 22d | 1 | 1.35mi |
| 6872 Alta Westgate Dr Orlando, FL | 2.0–3.0 | 2.0 | 1190 | $1,700 | $1.43 | 8d | 1 | 1.38mi |
| 204 Hawthorne Groves Blvd Orlando, FL | 1.0–3.0 | 1.0–2.0 | 1126 | $2,001 | $1.78 | 2d | 32 | 1.41mi |
| 1737 Hinckley Rd Orlando, FL | 4.0 | 2.0 | 1661 | $2,481 | $1.49 | 2d | 1 | 1.44mi |
Listing history 2 events
-
2026-04-08status Pending
-
2026-04-03$299,000 Active
ⓘ Source: listings_history table (triggers on properties + properties_extension) + one-shot
backfill from property_details.listing_events for pre-trigger history.
Tax reassessment forecast FL · Resets to sale price
- Current annual tax
- $961 · $80/mo
- Projected year-2 tax
- $2,482 · $207/mo
- Expected delta
- +$1,521/yr (+$127/mo · 158.2%)
ⓘ Screening estimate from a state-policy table — verify with the county assessor before closing.
Climate risk First Street
- Flood 1/10 Low FEMA zone X (unshaded) · 0% chance over 30 yrs
- Wildfire 1/10 Low
- Heat 9/10 Extreme 7 d/yr ≥108°F today · 23 d/yr by 30 yrs out
- Wind 9/10 Extreme 99% chance of damaging wind over 30 yrs
- Air quality 1/10 Low 0 unhealthy d/yr today · 0 by 30 yrs out
Nearby sold comps map
Loading sold comps map…
Walkable amenities ~0.75 mi
Loading nearby amenities…
Taxation est. · year 1
- Rental income
- $27,609
- − Mortgage interest
- −$16,749
- − Property taxes
- −$961
- − Insurance
- −$1,495
- − Repairs & maintenance
- −$2,209
- − Management
- −$2,209
- − Depreciation
- −$8,698
- Taxable loss
- −$4,711
- Est. tax savings @ 24.0%
- +$1,131
- After-tax cash flow
- $1,670/yr
For passive investors: Depreciation is non-cash, so a rental often shows a tax loss while cash-flowing — sheltering income. Rental losses are passive: they offset passive income freely, and up to $25,000/yr can offset ordinary (W-2) income if you actively participate and your MAGI is under $100k (phasing out to $0 by $150k); unused losses carry forward. On sale, claimed depreciation is recaptured at up to 25%, and gains may owe capital-gains tax (a 1031 exchange can defer both). Figures are a year-1 estimate at your 24.0% rate — not tax advice; consult a CPA.
Schools (NCES district)
- District
- Orange
- NCES district ID
- 1201440
- Math proficiency
- 46% ▼ -9.00%
- Reading proficiency
- 51% ▼ -2.00%
- Median HH income
- $49,350
- Composite
- 41.47/100
- National rank
- #3461
- State rank
- #43 of 73 in FL
Livability — Pine Hills
- Score
- 73/100
- State rank
- #317
- US rank
- #5362
Category grades
Schools grade is shown separately in the Schools card above.
Census & demographics
- Census place
- Pine Hills, FL
- County
- Orange County · 1,471,359 people
- City population
- 60,203
- Metro
- Orlando-Kissimmee-Sanford, FL
- Population (ZIP)
- 59,114
- Household income
- $63,061
- Rent vs Own
- Severe rent burden
- 2059.0
Population outlook (Orange County) Hauer SSP2
- Today (2025)
- 1,618,226 people
- By 2030
- 1,787,404 · +10.5%
- By 2040
- 2,125,621 · +31.4%
- By 2050
- 2,454,016 · +51.6%
- By 2075
- 3,173,711 · +96.1%
- By 2100
- 3,607,781 · +122.9%
Race, ethnicity, and origin ACS 2023
- Neighborhood character
- Predominantly Black (69%)
- Race & ethnicity
- Black 69% Hispanic / Latino 14% White 10% Two or more races 6% Asian 3%
- Hispanic origin (detail)
- Mexican 3% Puerto Rican 5% Cuban 1%
- Common ancestry
- Hispanic 21% Estonian 1% Romanian 1%
- Foreign-born
- 40% · Canada, Vietnam, China
- Languages at home
- 59% English-only · French/Haitian/Cajun 25% Spanish 11% Vietnamese 2%
Political lean MEDSL · Orange
- 2024 margin
- D (+13.6) · D 56.1% · R 42.5% · Other 1.3%
- 2008→2024 swing
- -5.0pp toward R · 2008: 18.6pp · 2024: 13.6pp
- All cycles
- 2024: D+13.6 2020: D+23.1 2016: D+24.6 2012: D+18.2 2008: D+18.6
Not yet ingested
- Civics
- —
Market trends
- HPI YoY
- ▼ -93.40%
- Current HPI
- 321.5821
- Rent YoY
- ▼ -2.66%
- Metro
- Orlando-Kissimmee-Sanford, FL
- State GDP YoY
- ▲ 3.28%
- F500 in state
- 36
Industry mix (Fortune 500 HQ in FL)
| Industry | F500 HQs | Revenue |
|---|---|---|
| Industrial Technology | 2 | $29B |
|
||
| Insurance | 2 | $17B |
|
||
| Retail | 1 | $60B |
|
||
| Technology Distribution | 1 | $58B |
|
||
| Homebuilding | 1 | $35B |
|
||
| Technology Manufacturing | 1 | $35B |
|
||
Price history
2 events — show timeline
- 2026-04-08 Pending — Beaches MLS
- 2026-04-03 Listed $299,000 Beaches MLS
Property tax history
+1.1%/yrLatest (2025): $961 · +15.3% YoY. Source: county tax records.
Cash-flow waterfall
monthlySold comps — $/sqft
last 12 mo · ≤1 miLoading sold comps…