 9-Plex
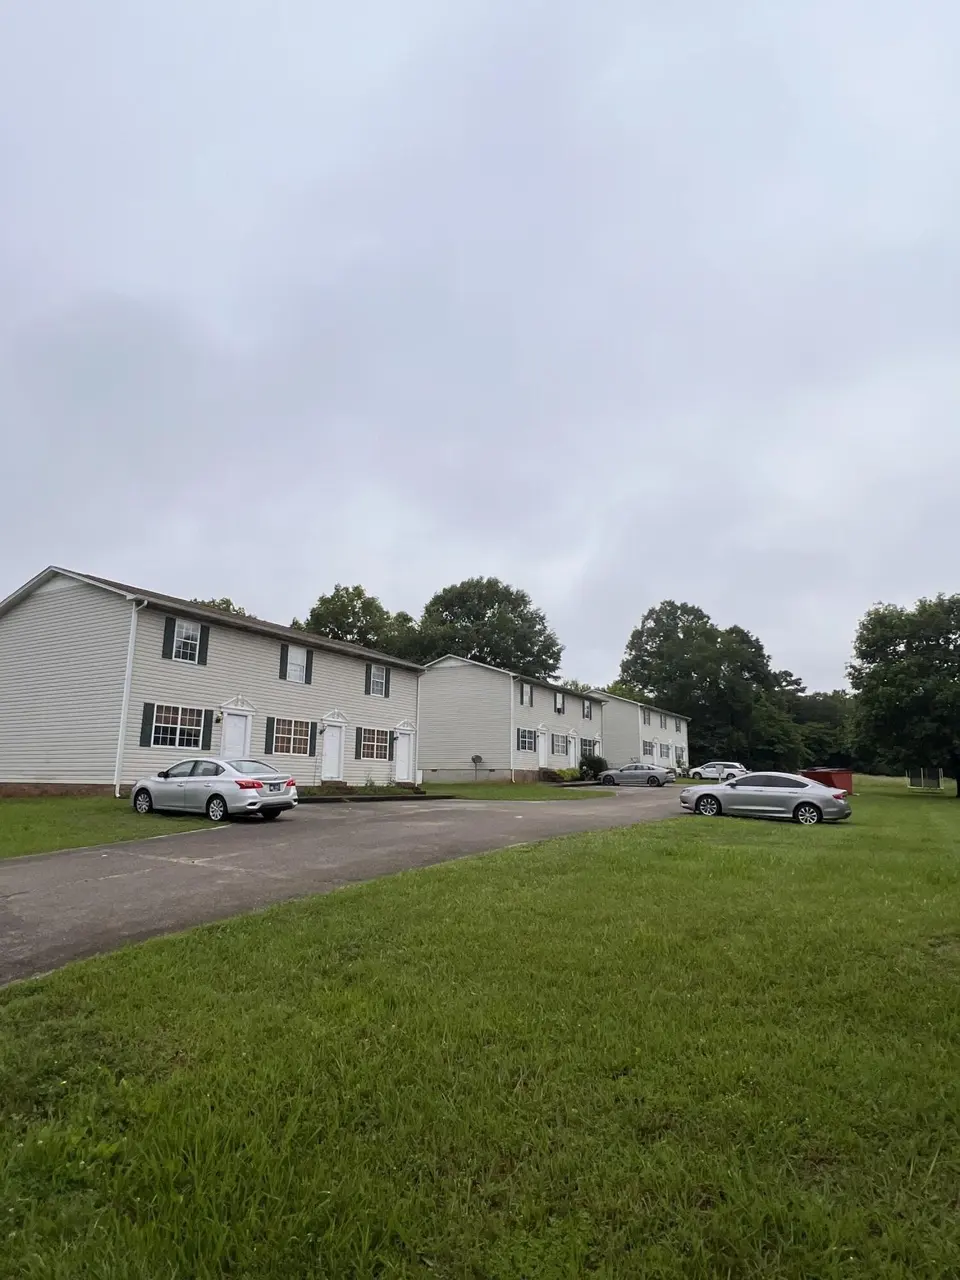
204 Arrants Rd · Decatur, TN
Flood risk 1/10 · Minimal
- FEMA flood zone
- X (unshaded)
- Chance of flooding over 30 yrs
- 0.0%
- Est. flood insurance / yr
- $507 – $1,088
Fire risk 5/10 · Moderate
- Est. fire insurance / yr
- $949 – $1,763
Heat risk 6/10 · Moderate
- Hot days now (above 106°F)
- 7 days/yr
- Hot days in 30 yrs
- 21 days/yr
Wind risk 3/10 · Minor
- Chance of severe wind over 30 yrs
- 5.0%
Air-quality risk 3/10 · Minor
- Unhealthy air days now
- 2 days/yr
- Unhealthy air days in 30 yrs
- 3 days/yr
Risk factors via First Street. Map © Google.
Why this score? — see what drove the C- grade
The composite is a weighted blend of 9 inputs, each scored 0–100. Each bar is that input's sub-score; the figure is the points it added to the 100-point composite (weight × sub-score).
- Cash flow +16.1/30.0
- Appreciation +10.0/10.0
- ARV discount +7.5/15.0
- DSCR +5.0/10.0
- 1% rule +3.2/10.0
- Livability +3.1/5.0
- Rent growth +2.5/5.0
- Condition / age +2.5/5.0
- Schools +1.6/10.0
$1,150,000
🖨 Deal sheet (PDF) 📄 Offer letter ✓ Due diligence
Multi-family units
County records classify this as Multi-Family (5+ Unit). Listing-text estimate: 9 units. confirmed
5+ unit building — per-unit beds/baths from public records are typically unavailable; the breakdown below (if shown) is an estimate from the listing text.
Listing remarks MLS
Income-Producing 9-Unit Investment Opportunity. All units are separately metered. Located directly across from Meigs County High School, this well-positioned multi-family property is a valuable addition to any portfolio. With nearly all units currently occupied and under professional management, this opportunity offers immediate cash flow and long-term potential. Don't miss your chance to invest in a high-demand area—contact your favorite REALTOR® today to schedule a private showing and take the next step in growing your investment portfolio. All information is deemed reliable but not guaranteed. Buyers are advised to independently verify all details.
Key facts
- High-demand area
- Separately metered
- 0.96 acre lot
Tags
Neighborhood map
What this means for you Summary
Snapshot
- This is a 9 × 4-bed/1.4-bath units multifamily listed at $1.15M.
Deal economics
- At list price, monthly cash flow is $593 ($7k/yr) — positive. Per door: $66/mo.
- The deal already cash-flows at list — no discount required.
- To meet the 1% rule (rent ≥ 1% of price), the offer needs to be $940k (18.2% below list).
- Recommended offer: $940k (18.2% below list) — sets the bar for 1% rule.
- Cap rate 6.9% vs local median 1.6% in Decatur — top-decile yield for the area; either an underpriced asset or a hidden risk that comps aren't pricing in. Stress-test before assuming the spread holds.
Location & tenants
- Location reads 61/100 on livability (#240 in TN) — a middle-class / working-renter tenant base. Strengths: cost of living A+, housing A+; Watch: crime C-, health & safety C-, amenities F.
- Meigs County (rural): math 16% / reading 22% proficiency, ranked #122 of 139 in TN (top 88%) — low school quality limits family demand, transient renter base, plan for 1-2y turnover.
- Zoned schools: Meigs North Elementary (math 17% / reading 22%, grade F, #654 of 952 statewide, top 72%, 434 students, 0% FRL); Meigs Middle School (math 19% / reading 21%, grade F, #198 of 333 statewide, top 61%, 390 students, 0% FRL); Meigs County High School (math 12% / reading 22%, grade F, #225 of 332 statewide, top 69%, 538 students, 0% FRL) — zoned schools average 0% FRL vs 57% district-wide (57 pts lower); this property's tenant base skews higher-income than the district average.
- Market conditions: 239 active listings in the ZIP; 94 units permitted in Meigs County in 2024 (0 in 5+ unit buildings).
Forward outlook
- In year one you build about $123k of equity ($8k loan paydown + $115k appreciation (10.0% local appreciation)).
- Meigs County population projected to shrink 8% by 2050 — rents likely to lag national; underwrite the cash flow, not the appreciation.
- At projected returns (10.0% appreciation + 3.0% rent growth), your $322k cash investment doubles in ~3 years — after that, you're playing with house money.
- By year 2, paydown + projected appreciation supports a ~$198k cash-out refi (75% LTV) — recoverable capital for the next deal without selling this one.
Negotiation context
- It's been on market 364 days — a 12% lower offer ($1.01M) is reasonable based on typical stale-listing flexibility.
- 13 sale attempts since 8y ago with the ask held roughly flat each time — persistent listings suggest the price (not the market) is what's stuck; bring a comps-based counter.
- Current owner paid $550k; list at $1.15M implies a 109% gain — meaningful room to come down on a strong offer.
Risks & watch-outs
- Climate carrying-cost: moderate wildfire risk; extreme-heat days projected 7→21/yr by 2055 (HVAC capex compounding) — expect insurance premiums to compound above CPI over the hold.
Questions for the listing agent
- It's been on market 364 days. Have you received any prior offers? Is the seller open to a 18% concession, seller financing, or rate buy-down credit?
- Can we see the unit-by-unit rent roll, current vacancy, and any below-market leases? What's the average tenancy length?
- What capital expenditures (roof, boiler, parking lot, exteriors) have been made in the last 5 years, and what's planned in the next 2?
- Why hasn't it sold? Are there any deal-killer items the seller is aware of (foundation, flood, title, zoning, code violations)?
- Is there a deadline driving the sale (1031 exchange, divorce, estate, relocation)? That informs how much negotiation room exists.
- Schools are F-rated, which usually means shorter tenancies and higher turnover. Who's the typical renter profile here, and what's been the actual vacancy rate?
- What's the average days-on-market for RENTAL listings here right now (not sales)? A rising rental-DOM trend means longer vacancies and softer asking-rent achievability than the comps imply.
- What's the recent tenant-quality profile in this submarket — average credit score on applications, eviction rate, late-payment / NSF rate, and stable-employment percentage? A property-management company in the area should have these aggregated.
- How much new apartment / multifamily construction is in the pipeline within 1–3 miles? Heavy new supply (>2% of stock underway) typically softens rents 12–24 months out; light construction supports rent growth.
Investment metrics
- 1% rule
- 0.82% ✗
- Cap rate
- 6.91%
- Cash-on-cash
- 2.21%
- DSCR
- 1.10
- GRM
- 10.2
CMA / ARV
No comps found within radius.
Projected returns pro-forma
10.0% appreciation · 3.0% rent growth · sell at horizon
- IRR
- 25.9%
- Equity multiple
- 3.06×
- Total profit
- $663,549
- Equity at exit
- $1,036,011
- IRR
- 22.7%
- Equity multiple
- 6.97×
- Total profit
- $1,923,265
- Equity at exit
- $2,234,197
Cash invested: $322,000 (down + closing). Projections, not guarantees.
Landlord ↔ Tenant lean methodology
- Overall (STATE)
- 87 Strongly Landlord-Friendly
- State Tennessee
- 87 Strongly Landlord-Friendly · R+13
- County
- — inherits STATE
- City
- — inherits STATE
ZIP-level market 37322
- Home prices YoY
- 29.4%
- Active inventory
- 239
- Price-to-rent
- 91.7×
Monthly cashflow live
- Estimated rent
- $9,404 medium interval (Pro) →
- Mortgage (P&I)
- −$6,031
- Tax from tax record
- −$326 /mo · $3,915/yr
- Insurance
- −$479
- HOA
- −$0
- Vacancy / Maint / Mgmt
- −$1,975
- Net cashflow
- $593
Break-even live
Sensitivity live
| Price | -10% $1,244 | -5% $919 | +0% $593 | +5% $268 | +10% $-58 |
|---|---|---|---|---|---|
| Rent | -10% $-150 | -5% $222 | +0% $593 | +5% $964 | +10% $1,336 |
| Rate | -1.0pp $1,172 | -0.5pp $886 | base $593 | +0.5pp $295 | +1.0pp $-8 |
9-unit breakdown (identical units grouped — click to expand)
| Units | Beds | Baths | Est. rent |
|---|---|---|---|
| 9× units | 4 | 1.4 | $9,405 |
| #1 | 4 | 1.4 | $1,045 |
| #2 | 4 | 1.4 | $1,045 |
| #3 | 4 | 1.4 | $1,045 |
| #4 | 4 | 1.4 | $1,045 |
| #5 | 4 | 1.4 | $1,045 |
| #6 | 4 | 1.4 | $1,045 |
| #7 | 4 | 1.4 | $1,045 |
| #8 | 4 | 1.4 | $1,045 |
| #9 | 4 | 1.4 | $1,045 |
| Total (9 units) | $9,404 | ||
UW: 25.0% down · 7.5% · 30yr · 1.5% tax · 5.0% vac · 8.0% maint · 8.0% mgmt
Financing live
Cash to close
- Down payment
- $287,500
- Closing costs
- $34,500
- Reserves months
- —
- Total cash needed
- —
Loan-product check · same deal, 3 products live
Conventional
25% down · 7.5% · 30yr
- Down + closing
- —
- Monthly P&I
- —
- Monthly cashflow
- —
- DSCR
- —
- Eligible?
- —
Personal DTI + credit; lowest rate.
DSCR
20% down · 8.5% · 30yr
- Down + closing
- —
- Monthly P&I
- —
- Monthly cashflow
- —
- DSCR
- —
- Eligible?
- —
No personal income docs; deal must DSCR.
Hard money
10% down · 12.0% · 12mo
- Down + closing
- —
- Monthly P&I
- —
- Monthly cashflow
- —
- DSCR
- —
- Eligible?
- —
Short-term bridge; refi at stabilization.
Listing history 25 events
-
2025-08-14price $1,150,000 669-char remark
Show marketing remark (669 chars)
Income-Producing 9-Unit Investment Opportunity. All units are separately metered. Located directly across from Meigs County High School, this well-positioned multi-family property is a valuable addition to any portfolio. With nearly all units currently occupied and under professional management, this opportunity offers immediate cash flow and long-term potential. Don't miss your chance to invest in a high-demand area—contact your favorite REALTOR® today to schedule a private showing and take the next step in growing your investment portfolio. All information is deemed reliable but not guaranteed. Buyers are advised to independently verify all details.
-
2025-05-28$1,200,000 Active 669-char remark
Show marketing remark (669 chars)
Income-Producing 9-Unit Investment Opportunity. All units are separately metered. Located directly across from Meigs County High School, this well-positioned multi-family property is a valuable addition to any portfolio. With nearly all units currently occupied and under professional management, this opportunity offers immediate cash flow and long-term potential. Don't miss your chance to invest in a high-demand area—contact your favorite REALTOR® today to schedule a private showing and take the next step in growing your investment portfolio. All information is deemed reliable but not guaranteed. Buyers are advised to independently verify all details.
-
2025-03-18historical $850
-
2025-03-18$850
-
2025-01-18historical $775
-
2025-01-17historical $775
-
2025-01-09$775
-
2024-12-10historical
-
2024-12-08historical $775
-
2024-12-08$775
-
2024-11-14historical $775
-
2024-11-14$775
-
2024-11-14$775
-
2024-04-30$1,200,000 Active
-
2024-04-30$1,200,000 Active
-
2023-09-28historical $750
-
2023-09-19historical $750
-
2023-09-18$750
-
2023-09-12historical $750
-
2023-08-31$750
-
2023-08-23$750
-
2019-11-08soldstatus $550,000
-
2018-09-20$685,000
-
2018-01-23$659,000
-
2004-11-30soldstatus $410,000
ⓘ Source: listings_history table (triggers on properties + properties_extension) + one-shot
backfill from property_details.listing_events for pre-trigger history.
Tax reassessment forecast TN · Resets to sale price
- Current annual tax
- $3,915 · $326/mo
- Projected year-2 tax
- $8,165 · $680/mo
- Expected delta
- +$4,250/yr (+$354/mo · 108.6%)
ⓘ Screening estimate from a state-policy table — verify with the county assessor before closing.
Climate risk First Street
- Flood 1/10 Low FEMA zone X (unshaded) · 0% chance over 30 yrs
- Wildfire 5/10 Major
- Heat 6/10 Major 7 d/yr ≥106°F today · 21 d/yr by 30 yrs out
- Wind 3/10 Moderate 5% chance of damaging wind over 30 yrs
- Air quality 3/10 Moderate 2 unhealthy d/yr today · 3 by 30 yrs out
Nearby sold comps map
Loading sold comps map…
Walkable amenities ~0.75 mi
Loading nearby amenities…
Taxation est. · year 1
- Rental income
- $112,848
- − Mortgage interest
- −$64,418
- − Property taxes
- −$3,915
- − Insurance
- −$5,750
- − Repairs & maintenance
- −$9,028
- − Management
- −$9,028
- − Depreciation
- −$33,455
- Taxable loss
- −$12,745
- Est. tax savings @ 24.0%
- +$3,059
- After-tax cash flow
- $10,175/yr
For passive investors: Depreciation is non-cash, so a rental often shows a tax loss while cash-flowing — sheltering income. Rental losses are passive: they offset passive income freely, and up to $25,000/yr can offset ordinary (W-2) income if you actively participate and your MAGI is under $100k (phasing out to $0 by $150k); unused losses carry forward. On sale, claimed depreciation is recaptured at up to 25%, and gains may owe capital-gains tax (a 1031 exchange can defer both). Figures are a year-1 estimate at your 24.0% rate — not tax advice; consult a CPA.
Schools (NCES district)
- District
- Meigs County
- NCES district ID
- 4702910
- Math proficiency
- 16% ▼ -18.00%
- Reading proficiency
- 22% ▼ -10.00%
- Median HH income
- $36,129
- Composite
- 15.74/100
- National rank
- #9278
- State rank
- #122 of 139 in TN
Livability — Decatur
- Score
- 61/100
- State rank
- #240
- US rank
- #17516
Category grades
Schools grade is shown separately in the Schools card above.
Census & demographics
- Census place
- Decatur, TN
- Population (ZIP)
- 8,509
Population outlook (Meigs County) Hauer SSP2
- Today (2025)
- 11,953 people
- By 2030
- 11,878 · -0.6%
- By 2040
- 11,514 · -3.7%
- By 2050
- 10,946 · -8.4%
- By 2075
- 9,639 · -19.4%
- By 2100
- 8,171 · -31.6%
Race, ethnicity, and origin ACS 2023
- Neighborhood character
- Predominantly White (90%)
- Race & ethnicity
- White 90% Two or more races 5% Black 4%
- Common ancestry
- Lithuanian 3% Iranian 2% Slovak 1%
- Foreign-born
- 1% · Canada
- Languages at home
- 97% English-only · French/Haitian/Cajun 1% Spanish 1%
Political lean MEDSL · Meigs
- 2024 margin
- Solid R (+67.5) · D 15.9% · R 83.4%
- 2008→2024 swing
- -33.9pp toward R · 2008: -33.6pp · 2024: -67.5pp
- All cycles
- 2024: R+67.5 2020: R+62.5 2016: R+57.5 2012: R+39.5 2008: R+33.6
Not yet ingested
- Civics
- —
Market trends
- HPI YoY
- ▲ 93.26%
- Current HPI
- 410.6623
- Rent YoY
- —
- Metro
- —
- State GDP YoY
- ▲ 2.78%
- F500 in state
- 22
Industry mix (Fortune 500 HQ in TN)
| Industry | F500 HQs | Revenue |
|---|---|---|
| Healthcare | 3 | $91B |
|
||
| Retail | 3 | $72B |
|
||
| Transportation / Logistics | 1 | $88B |
|
||
| Paper / Packaging | 1 | $19B |
|
||
| Insurance | 1 | $13B |
|
||
| Energy | 1 | $12B |
|
||
Price history
+180.5% since first listed25 events — show timeline
- 2025-08-14 Price Changed $1,150,000 GCAR
- 2025-05-28 Listed $1,200,000 GCAR
- 2025-03-18 Rental Removed $850 LEASESTAR
- 2025-03-18 Listed for Rent $850 LEASESTAR
- 2025-01-18 Rental Removed $775 BUILDIUM
- 2025-01-17 Rental Removed $775 LEASESTAR
- 2025-01-09 Listed for Rent $775 BUILDIUM
- 2024-12-10 Listing Removed — Knoxville MLS
- 2024-12-08 Rental Removed $775 BUILDIUM
- 2024-12-08 Listed for Rent $775 BUILDIUM
- 2024-11-14 Rental Removed $775 BUILDIUM
- 2024-11-14 Listed for Rent $775 LEASESTAR
- 2024-11-14 Listed for Rent $775 BUILDIUM
- 2024-04-30 Listed $1,200,000 RCAOR
- 2024-04-30 Listed $1,200,000 Knoxville MLS
- 2023-09-28 Rental Removed $750 LEASESTAR
- 2023-09-19 Rental Removed $750 BUILDIUM
- 2023-09-18 Listed for Rent $750 BUILDIUM
- 2023-09-12 Rental Removed $750 BUILDIUM
- 2023-08-31 Listed for Rent $750 LEASESTAR
- 2023-08-23 Listed for Rent $750 BUILDIUM
- 2019-11-08 Sold (Public Records) $550,000 Public Records
- 2018-09-20 Listed $685,000 RCAOR
- 2018-01-23 Listed $659,000 RCAOR
- 2004-11-30 Sold (Public Records) $410,000 Public Records
Property tax history
+0.3%/yrLatest (2025): $3,915 · +0.0% YoY. Source: county tax records.
Cash-flow waterfall
monthlySold comps — $/sqft
last 12 mo · ≤1 miLoading sold comps…