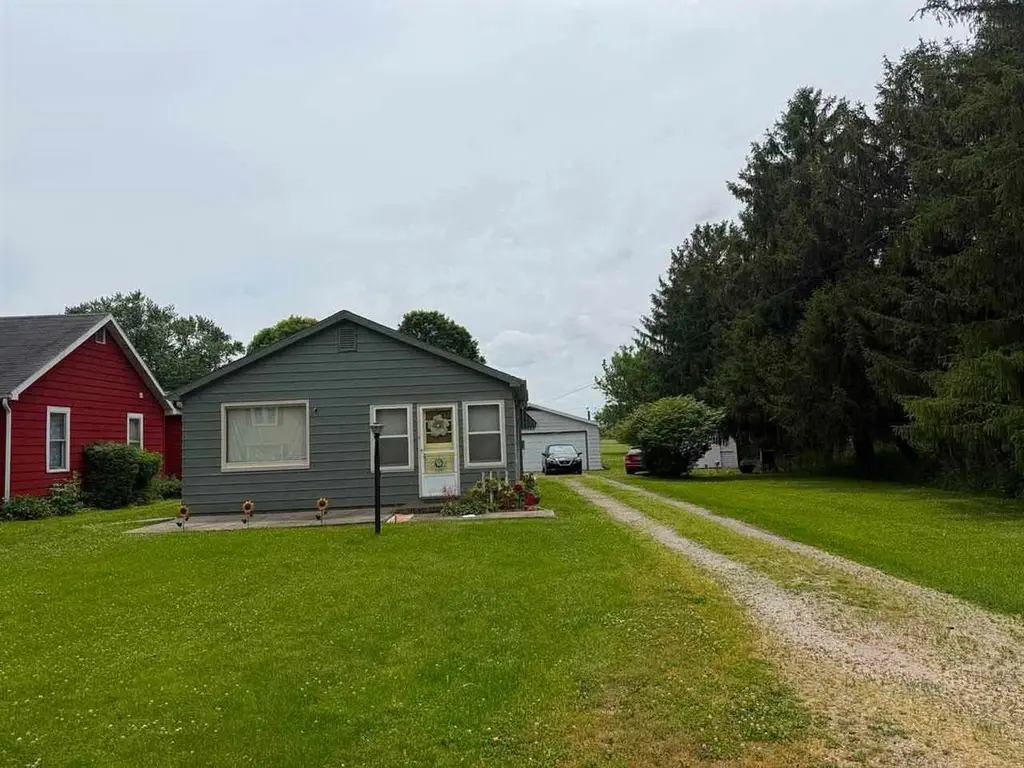
1405 W Hickory St · Union City, IN
Flood risk 1/10 · Minimal
- FEMA flood zone
- X (unshaded)
- Chance of flooding over 30 yrs
- 0.0%
- Est. flood insurance / yr
- $507 – $1,088
Fire risk 1/10 · Minimal
- Est. fire insurance / yr
- $717 – $1,331
Heat risk 3/10 · Minor
- Hot days now (above 100°F)
- 7 days/yr
- Hot days in 30 yrs
- 18 days/yr
Wind risk 2/10 · Minimal
- Chance of severe wind over 30 yrs
- 0.0%
Air-quality risk 3/10 · Minor
- Unhealthy air days now
- 2 days/yr
- Unhealthy air days in 30 yrs
- 3 days/yr
Risk factors via First Street. Map © Google.
Why this score? — see what drove the C grade
The composite is a weighted blend of 9 inputs, each scored 0–100. Each bar is that input's sub-score; the figure is the points it added to the 100-point composite (weight × sub-score).
- Cash flow +17.8/30.0
- Appreciation +10.0/10.0
- ARV discount +7.5/15.0
- DSCR +5.6/10.0
- 1% rule +3.9/10.0
- Livability +3.2/5.0
- Rent growth +2.5/5.0
- Schools +2.5/10.0
- Condition / age +2.5/5.0
$94,900
🖨 Deal sheet 📄 Offer letter ✓ Due diligence
Listing remarks MLS
2 bedroom home near Harter Park. Nice heated sunroom/porch. First time on the market since being built by the original owner in 1950. Original hardwood floors. Large detached garage with workshop area.
Key facts
- Large garage
- Shed
- Nice lot
Tags
Property features AI
Exterior
- Parking: Detached 2-car garage
- Utilities: Public water; Public sewer; Cable available
- Home design: Single-family residence; Single-story
- Construction: Aluminum siding
- Exterior features: Asphalt shingle roof; Lot approximately 90 x 186 (0.38 acres); Zoned residential
Interior
- Kitchen: Gas range; Refrigerator
- Bathrooms: 1 full bathroom
- Heating & cooling: Radiant heating; Window unit air conditioning
- Interior features: Gas Range; Refrigerator; Gas water heater; Crawl space basement; 5 total rooms
Neighborhood map
What this means for you Summary
Snapshot
- This is a 2-bed/1.0-bath single-family listed at $95k.
Deal economics
- At list price, monthly cash flow is $79 ($943/yr) — positive.
- The deal already cash-flows at list — no discount required.
- To meet the 1% rule (rent ≥ 1% of price), the offer needs to be $84k (11.4% below list).
- Recommended offer: $84k (11.4% below list) — sets the bar for 1% rule.
Location & tenants
- Location reads 63/100 on livability (#432 in IN) — a middle-class / working-renter tenant base. Strengths: cost of living A+, housing A+, crime A-; Watch: health & safety C-, schools D-, amenities F.
- Randolph Eastern School Corporation (town): math 29% / reading 31% proficiency, ranked #246 of 301 in IN (top 82%) — families likely to look elsewhere, expect single-tenant / working-renter base with shorter leases.
- Market conditions: 35 active listings in the ZIP; 1 comparable units currently listed for rent nearby; 19 units permitted in Randolph County in 2024 (0 in 5+ unit buildings).
Forward outlook
- In year one you build about $10k of equity ($656 loan paydown + $9k appreciation (10.0% local appreciation)).
- Randolph County population projected at -26% by 2050 — secular population decline; favor cash flow + early exit over multi-decade hold.
- At projected returns (10.0% appreciation + 3.0% rent growth), your $27k cash investment doubles in ~3 years — after that, you're playing with house money.
- By year 4, paydown + projected appreciation supports a ~$36k cash-out refi (75% LTV) — recoverable capital for the next deal without selling this one.
Negotiation context
- Only 8 days on market — expect competitive offers; lowballing is unlikely to land.
- 3 sale attempts since 5y ago; this cycle's ask has dropped $94.81M (100%) from the opening price — seller is motivated, your offer sets the floor, not the list.
- Current owner paid $53k; list at $95k implies a 79% gain — meaningful room to come down on a strong offer.
Risks & watch-outs
- Watch-outs: built in 1950 — expect roof / HVAC / electrical / plumbing capex.
Questions for the listing agent
- Built in 1950 — when were the roof, HVAC, electrical panel, plumbing, and water heater last replaced?
- Is there a deadline driving the sale (1031 exchange, divorce, estate, relocation)? That informs how much negotiation room exists.
- Schools are D-rated, which usually means shorter tenancies and higher turnover. Who's the typical renter profile here, and what's been the actual vacancy rate?
- What's the average days-on-market for RENTAL listings here right now (not sales)? A rising rental-DOM trend means longer vacancies and softer asking-rent achievability than the comps imply.
- What's the recent tenant-quality profile in this submarket — average credit score on applications, eviction rate, late-payment / NSF rate, and stable-employment percentage? A property-management company in the area should have these aggregated.
- How much new for-sale + rental construction is in the pipeline within 1–3 miles? Heavy new supply typically softens prices + rents 12–24 months out; constrained supply supports both.
Investment metrics
- 1% rule
- 0.89% ✗
- Cap rate
- 7.29%
- Cash-on-cash
- 3.55%
- DSCR
- 1.16
- GRM
- 9.4
CMA / ARV
- ARV (on-the-fly)
- $20,736
- Comps found
- 3
Show comp detail 3 sales within ~0.75 mi
| Address | Dist | Beds/Ba | Sqft | Sold | Price | $/sf | Match |
|---|---|---|---|---|---|---|---|
| 510 Sycamore St | 0.28mi | 2/1.0 | 825 (-4%) | 2mo | $20,000 | $24 | 77 |
| 606 Boggs Ave | 0.30mi | 2/1.0 | 888 (+3%) | 14mo | $95,000 | $107 | 70 |
| 212 S Walnut St | 0.66mi | 3/1.0 (+1) | 989 (+14%) | 16mo | $10,000 | $10 | 26 |
Match score weights: distance 35% · size 25% · config 20% · recency 20%. Top-matched comps best support the ARV.
Projected returns pro-forma
10.0% appreciation · 3.0% rent growth · sell at horizon
- IRR
- 26.8%
- Equity multiple
- 3.13×
- Total profit
- $56,658
- Equity at exit
- $85,493
- IRR
- 23.5%
- Equity multiple
- 7.13×
- Total profit
- $162,854
- Equity at exit
- $184,370
Cash invested: $26,572 (down + closing). Projections, not guarantees.
Landlord ↔ Tenant lean methodology
- Overall (STATE)
- 90 Strongly Landlord-Friendly
- State Indiana
- 90 Strongly Landlord-Friendly · R+11
- County
- — inherits STATE
- City
- — inherits STATE
ZIP-level market 47390
- Home prices YoY
- 9.1%
- Active inventory
- 35
- Price-to-rent
- 9.4×
Monthly cashflow live
- Estimated rent
- $841 medium interval (Pro) →
- Mortgage (P&I)
- −$498
- Tax from tax record
- −$49 /mo · $584/yr
- Insurance
- −$40
- HOA
- −$0
- Vacancy / Maint / Mgmt
- −$177
- Net cashflow
- $79
Break-even live
UW: 25.0% down · 7.5% · 30yr · 1.5% tax · 5.0% vac · 8.0% maint · 8.0% mgmt
Financing live
Cash to close
- Down payment
- $23,725
- Closing costs
- $2,847
- Reserves months
- —
- Total cash needed
- —
Loan-product check · same deal, 3 products live
Conventional
25% down · 7.5% · 30yr
- Down + closing
- —
- Monthly P&I
- —
- Monthly cashflow
- —
- DSCR
- —
- Eligible?
- —
Personal DTI + credit; lowest rate.
DSCR
20% down · 8.5% · 30yr
- Down + closing
- —
- Monthly P&I
- —
- Monthly cashflow
- —
- DSCR
- —
- Eligible?
- —
No personal income docs; deal must DSCR.
Hard money
10% down · 12.0% · 12mo
- Down + closing
- —
- Monthly P&I
- —
- Monthly cashflow
- —
- DSCR
- —
- Eligible?
- —
Short-term bridge; refi at stabilization.
Rent comps 1 comps
| Address | Beds | Baths | Sqft | Rent | $/sqft | DOM | Units | Dist |
|---|---|---|---|---|---|---|---|---|
| 310 N Walnut St Union City, IN | 1.0–2.0 | 1.0 | 750 | $841 | $1.12 | 43d | 1 | 0.58mi |
Listing history 8 events
-
2026-06-17status $94,900 Pending 8 DOM
-
2026-06-17days on market $94,900 Active 8 DOM
-
2026-06-16days on market $94,900 Active 7 DOM
-
2026-06-15days on market $94,900 Active 6 DOM
-
2026-06-13days on market $94,900 Active 4 DOM
-
2026-06-12days on market $94,900 Active 3 DOM
-
2026-06-09remarks 192-char remark
-
2026-06-09$94,900 Active 1 DOM
ⓘ Source: listings_history table (triggers on properties + properties_extension) + one-shot
backfill from property_details.listing_events for pre-trigger history.
Tax reassessment forecast IN · Partial reset (capped growth)
- Current annual tax
- $584 · $49/mo
- Projected year-2 tax
- $695 · $58/mo
- Expected delta
- +$112/yr (+$9/mo · 19.1%)
ⓘ Screening estimate from a state-policy table — verify with the county assessor before closing.
Climate risk First Street
- Flood 1/10 Low FEMA zone X (unshaded) · 0% chance over 30 yrs
- Wildfire 1/10 Low
- Heat 3/10 Moderate 7 d/yr ≥100°F today · 18 d/yr by 30 yrs out
- Wind 2/10 Low 0% chance of damaging wind over 30 yrs
- Air quality 3/10 Moderate 2 unhealthy d/yr today · 3 by 30 yrs out
Nearby sold comps map
Loading sold comps map…
Walkable amenities ~0.75 mi
Loading nearby amenities…
Taxation est. · year 1
- Rental income
- $10,092
- − Mortgage interest
- −$5,316
- − Property taxes
- −$584
- − Insurance
- −$474
- − Repairs & maintenance
- −$807
- − Management
- −$807
- − Depreciation
- −$2,761
- Taxable loss
- −$657
- Est. tax savings @ 24.0%
- +$158
- After-tax cash flow
- $1,100/yr
For passive investors: Depreciation is non-cash, so a rental often shows a tax loss while cash-flowing — sheltering income. Rental losses are passive: they offset passive income freely, and up to $25,000/yr can offset ordinary (W-2) income if you actively participate and your MAGI is under $100k (phasing out to $0 by $150k); unused losses carry forward. On sale, claimed depreciation is recaptured at up to 25%, and gains may owe capital-gains tax (a 1031 exchange can defer both). Figures are a year-1 estimate at your 24.0% rate — not tax advice; consult a CPA.
Schools (NCES district)
- District
- Randolph Eastern School Corporation
- NCES district ID
- 1803180
- Math proficiency
- 29% ▼ -15.00%
- Reading proficiency
- 31% ▼ -15.00%
- Median HH income
- $36,652
- Composite
- 24.92/100
- National rank
- #7570
- State rank
- #246 of 301 in IN
Livability — Union City
- Score
- 63/100
- State rank
- #432
- US rank
- #15530
Category grades
Schools grade is shown separately in the Schools card above.
Census & demographics
- Census place
- Union City, IN
- Population (ZIP)
- 5,084
Population outlook (Randolph County) Hauer SSP2
- Today (2025)
- 22,998 people
- By 2030
- 21,815 · -5.1%
- By 2040
- 19,360 · -15.8%
- By 2050
- 17,010 · -26.0%
- By 2075
- 12,491 · -45.7%
- By 2100
- 8,986 · -60.9%
Race, ethnicity, and origin ACS 2023
- Neighborhood character
- Predominantly White (79%)
- Race & ethnicity
- White 79% Hispanic / Latino 15% Two or more races 9% Black 3%
- Hispanic origin (detail)
- Mexican 10%
- Common ancestry
- Romanian 3% Portuguese 2% Italian 1%
- Foreign-born
- 6% · Canada, South Korea, Guatemala
- Languages at home
- 88% English-only · Spanish 10% Korean 1% Other Indo-European 1%
Political lean MEDSL · Randolph
- 2024 margin
- Solid R (+53.7) · D 22.3% · R 75.9% · Other 1.8%
- 2008→2024 swing
- -44.9pp toward R · 2008: -8.8pp · 2024: -53.7pp
- All cycles
- 2024: R+53.7 2020: R+52.4 2016: R+48.5 2012: R+24.1 2008: R+8.8
Not yet ingested
- Civics
- —
Market trends
- HPI YoY
- ▲ 22.82%
- Current HPI
- 273.6736
- Rent YoY
- —
- Metro
- —
- State GDP YoY
- ▲ 2.90%
- F500 in state
- 18
Industry mix (Fortune 500 HQ in IN)
| Industry | F500 HQs | Revenue |
|---|---|---|
| Industrial Machinery | 2 | $37B |
|
||
| Healthcare | 1 | $177B |
|
||
| Pharmaceuticals | 1 | $45B |
|
||
| Metals / Steel | 1 | $18B |
|
||
| Agriculture | 1 | $17B |
|
||
| Packaging | 1 | $12B |
|
||
Price history
+55.6% since first listed6 events — show timeline
- 2026-06-09 Price Changed $94,900 RRELMS
- 2026-06-09 Listed $94,900,000 RRELMS
- 2021-07-30 Sold (MLS) $53,000 IRMLS
- 2021-07-30 Sold (MLS) $53,000 RRELMS
- 2021-06-14 Listed $61,000 RRELMS
- 2021-06-14 Listed $61,000 IRMLS
Property tax history
+46.8%/yrLatest (2024): $584 · -2.0% YoY. Source: county tax records.
Cash-flow waterfall
monthlySold comps — $/sqft
last 12 mo · ≤1 miLoading sold comps…